Marine Weather ReviewNorth Atlantic Area
September through December 2007
By George P. Bancroft, NOAA National Center for Environmental Prediction
Introduction
The dominant storm track during the September to December period was from southwest to northeast, taking most cyclonic systems toward the area between Greenland and the northern British Isles. Occasionally high pressure which was parked near Great Britain shifted farther west and turned the low-pressure areas northward toward Greenland or the Davis Strait, with the lows reforming on the east side of Greenland before moving east. The cyclones often originated over the Atlantic provinces of Canada early in the season, through October, and later over or south of the Atlantic provinces or off the U.S. east coast. Among lows with no tropical origins, the number of hurricane-force storms increased later in the period. September produced three hurricane-force lows while December produced ten, twice as many as in November. One storm, in early December, developed central pressures below 950 hPa.
The 2007 Atlantic hurricane season was more active than that of 2006, but fewer tropical cyclones formed in or moved into Ocean Prediction Centers (OPC’s) marine area north of 31N in September to December 2007 than during the same period in 2006. Tropical cyclones Gabrielle, Jerry, Depression Fifteen and Noel affected OPC’s waters during the four-month period, occurring during the period from September to the beginning of November, with all except Noel originating outside the tropics. Of these only Noel was a hurricane, which became a powerful extratropical storm shortly after moving into OPCs southwestern Atlantic waters. A year ago there were five cyclones, concentrated mostly in September, and four of those were hurricanes.
Tropical Activity
Tropical Storm Gabrielle: Gabrielle had origins as a subtropical storm, forming near 30N 72W on the evening of September 8 with maximum sustained winds of 40 kts with gusts to 50 kts. The ship Crown Princess (ZCDM6) (32N 72W) reported a northeast wind of 45 kts just north of the center at 0000 UTC on the 8th. At 1800 UTC on the 8th the ship Yorktown Express (WDD6127) (31N 74W) reported south winds of 40 kts. The cyclone drifted northwest over the next two days, weakening slightly at first but restrengthening as it approached the Outer Banks of North Carolina on the morning of the 9th as a tropical storm, with maximum sustained winds of 45 kts with gusts to 55 kts. The cyclone then turned northeast and began to weaken, becoming a tropical depression off the Virginia capes early on September 10 with maximum sustained winds of 30 kts with gusts to 40 kts. Gabrielle then dissipated as a remnant low near 40N 64W on the afternoon of the 11th.
Tropical Storm Jerry: Subtropical Depression 11 formed near 36N 46W early on September 23 with maximum sustained winds of 30 kts with gusts to 40 kts, becoming, six hours later, Subtropical Storm Jerry with maximum sustained winds of 35 kts with gusts to 45 kts. The National Hurricane Center then reclassified Jerry as a tropical storm of the same strength at 0300 UTC on the 24th when the center was near 37N 46W. The cyclone then weakened to a depression twelve hours later while beginning a northeastward acceleration, before restrengthening by 0300 UTC on the 25th with maximum sustained winds of 40 kts with gusts to 50 kts, when the center passed near 45N 38W. Jerry then became extratropical early on September 25 while becoming absorbed by a frontal system.
Tropical Depression Fifteen: This cyclone formed from a non-tropical low near 30N 51W at 2100 UTC October 11 and drifted northeast, with maximum sustained winds of 30 kts with gusts to 40 kts, before weakening to a remnant low late on the 12th. Dissipation followed, near 33N 50W, late on the 13th.
Hurricane Noel: Noel was an unusual late-season hurricane moving into the far southwest portion of OPCs high seas area (Figure 1). At the 2100 UTC November 2 advisory time, the hurricane was centered near 31N 73W and heading north-northeast, with maximum sustained winds of 70 kts with gusts to 85 kts. The cyclone then maintained its hurricane-force winds as an extratropical storm as it moved through the U.S. east coast offshore waters as shown in Figure 1. The enhanced infrared satellite image in Figure 2 shows extratropical Noel with hybrid characteristics, retaining some circular cloud features of a hurricane and an "eye" as well as developing frontal cloud bands of a nontropical low. As the center passed near 37N 71W, a high-resolution scatterometer image revealed winds to 70 kts on the northwest side and 65 kts on the southeast side. These winds compare well with the hurricane-force gusts reported from several of the buoys listed in Table 1. The cyclone developed a lowest central pressure of 965 hPa when moving off the Labrador coast early on November 5. At 0000 UTC on the 5th the P&O Nedlloyd Marseille (MYSU5) near 52N 57W reported southwest winds of 60 kts. The cyclone then maintained its hurricaneforce winds as it moved through the Labrador Sea, before it weakened over Greenland late on the 5th.
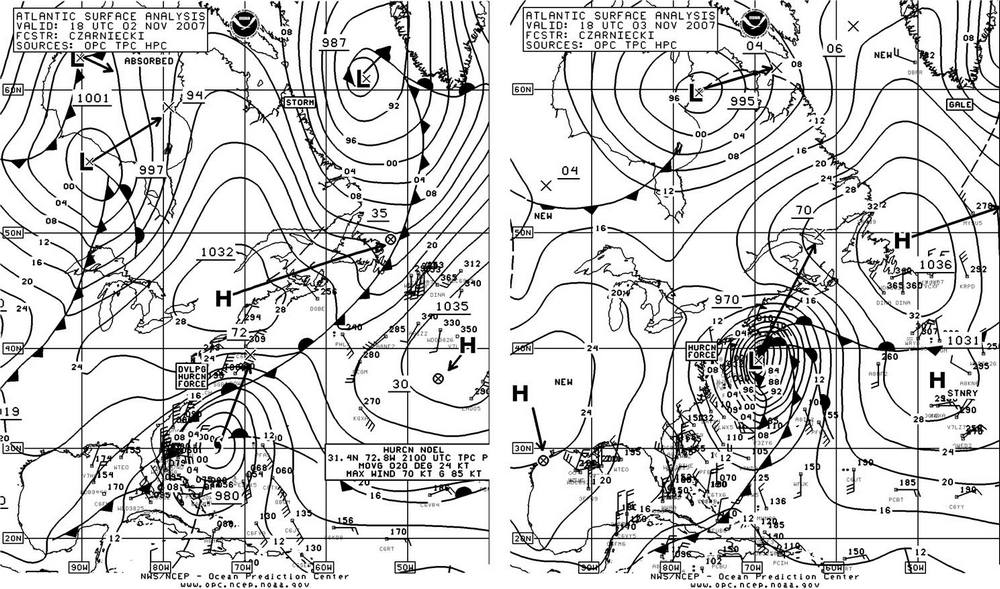
Figure 1. OPC North Atlantic Surface Analysis charts (Part 2 - west) valid 1800 UTC November 2 and 3, 2007,
showing Hurricane Noel becoming an intense extratropical storm.
(Click to enlarge)
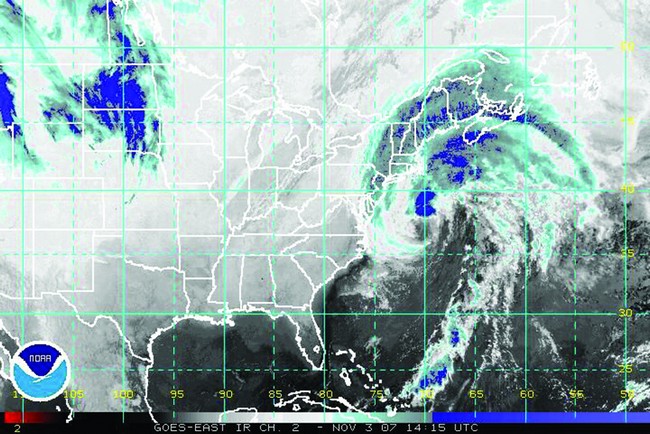
Figure 2. GOES-12 enhanced infrared satellite image of Noel (Figure 1) after becoming extratropical. The valid time is 1415 UTC November 3, 2007, or less than 4 hours prior to the valid time of the second part of Figure 1. Satellite senses temperature on a scale from black (warm) to white (cold) in this type of imagery, with the colder tops enhanced (in color or gray shades if viewed in black-and-white).
| OBSERVATION | POSITION | DATE/TIME (UTC) | WIND | SEAS(m/ft) |
|---|---|---|---|---|
| Buoy 41002 | 32.3N 75.4W | 03/0600 | NW 37 G47 | 6.5/21 |
| 02/2300 | maximum | 7.5/25 | ||
| Buoy 41025 | 35N75.4W | 02/2300 | N 39 G51 | 4.5/15 |
| 03/0600 | maximum | 6.0/20 | ||
| Buoy 41048 | 32N 69.6W | 03/0200 | S 51 G60 peak 64 | |
| 03/0300 | 11.5/34 | |||
| Buoy 44014 | 36.6N 74.8W | 03/0600 | N 37 G49 | 6.0/20 |
| 03/0800 | maximum | 6.5/21 | ||
| Buoy 44004 | 38.5N 70.4W | 03/2000 | NW 49 G66 | 7.5/25 |
| 03/1600 | maximum | 9.5/31 | ||
| 03/1800 | Sea level pressure 972.9 mb | |||
| Buoy 44009 | 38.5N 74.7W | 03/1100 | N 35 G45 | 5.0/16 |
| Buoy 44017 | 40.7N 72.0W | 03/1800 | N 39 G47 Peak 51 | 4.5/15 |
| Buoy 44008 | 40.5N 69.4W | 03/2300 | NW 51 G70 | 10.5/34 |
| Sea level pressure 972.5 | ||||
| Buoy 44018 | 41.3N 69.3W | 04/0000 | NW 49 G62 | |
| 04/0400 | 8.5/28 | |||
| Buoy 44013 | 42.3N 70.7W | 03/2000 | N 39 G49 | 5.5/18 |
| 03/2300 | maximum | 6.0/20 | ||
| Buoy 44011 | 41.1N 66.6W | 04/0300 | SW 45 G58 Peak 64 | 14.0/46 |
| 04/0200 | Sea level pressure 973.9 | |||
| Buoy 44037 | 43.5N 67.9W | 04/0600 | NW 41 G58 | |
| Buoy 44150 | 42.5N 64.0W | 04/0600 | S 51 G66 | |
| Chesapeake Light (CHLV2) | 36.9N 75.6W | 03/0800 | N 41 G48 | |
| Buzzards Bay (BUZM3) | 41.4N 70.9W | 03/1700 | N 46 G53 | |
| 03/1900 | Peak gust 58 | |||
| Isles of Shoals (IOSN3) | 43N 70.5W | 03/1900 | N 37 G42 Peak 48 | |
| Mount Desert Rock (MDRM1) | 44N 68W | 04/0600 | N 56 G64 |
Table 1. Buoy and C/MAN automated station observations taken during passage of intense extratropical low, formerly Hurricane Noel.
Other Significant Events of the Period
Storm in Davis Strait, September 7: A developing low moved north from the Labrador Sea through the Davis Strait on September 7, producing storm-force winds along Greenlands west coast during the day. Nuuk, Greenland on the Davis Strait coast reported a sustained wind from the south of 54 kts at 2100 UTC on the 7th. Winds were 50 to 60 kts offshore on high-resolution scatterometer imagery with local 65 kts.
North Atantic Storm, September 1213: A frontal wave of low pressure developed near 59N between Greenland and Iceland late on the 11th and tracked northeast while intensifying, developing a central pressure of 983 hPa near 63N 28W at 1800 UTC on the 12th. High-resolution QuikSCAT scatterometer winds from about four hours later revealed northeast winds to 65 kts northwest of the center in the Denmark Strait (a pattern similar to Figure 14 but not as strong) and 50 kts winds south of the center. The cyclone then moved east, passing through the Norwegian Sea by the 14th.
North Atlantic Storm, September 1315: This cyclone came from near the mouth of the St. Lawrence River early on the 12th and emerged off the Labrador coast near 56N 61W with a 978-hPa central pressure at 1200 UTC on the 13th. Figure 3 shows the storm twelve hours later with the ship Grand Princess (ZCBU5) reporting an east wind of 65 kts near the southern tip of Greenland. Figure 4 reveals a band of east winds 50 to as high as 70 kts in the high-resolution QuikSCAT imagery ahead of the front as it approaches Greenland, indicating that the ship report is likely reliable. The cyclone then weakened to a gale between Greenland and Iceland late on the 14th but redeveloped as a new storm center southeast of Iceland on the 15th and moved east through the Norwegian Sea on the 16th.
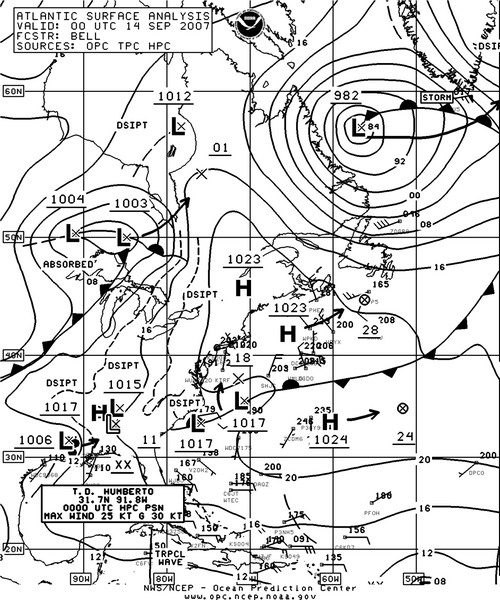
Figure 3. OPC North Atlantic Surface Analysis chart (Part 2) south of Iceland near 59N
valid 0000 UTC September 14, 2007.
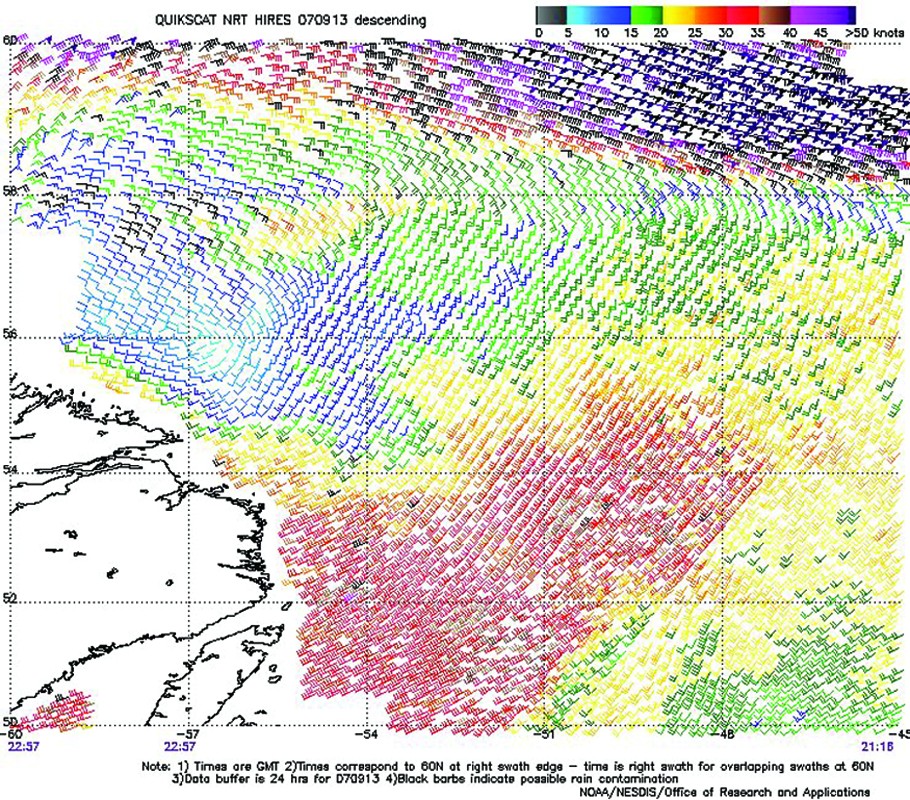
Figure 4. High-resolution QuikScat scatterometer image of
satellite-sensed winds around the north and east sides of the storm shown in
Figure 3. The resolution is 12.5 km versus 25 km in the standard version of
the imagery. The valid time of the pass is 2257 UTC September 13, 2007, or
about one hour prior to the valid time of Figure 3. The center of the storm is
off the left side of the image near the Labrador coast. Image is courtesy of
NOAA/NESDIS/Office of Research and Applications.
(Click to enlarge)
North Atlantic Storm of September 2125: A developing low moved from the central Labrador coast at 1800 UTC on the 20th to 23W at 1800 UTC on the 22nd with the central pressure down to 972 hPa.
Its frontal system approaching Iceland from the south developed east winds 50 to 70 kts between the front and Iceland’s south coast, as revealed by high-resolution scatterometer winds valid about four hours later. The satellite-sensed winds appear similar to Figure 4’s Greenland event. The cyclone then passed north of Great Britain on the 24th before moving into the Norwegian Sea on the 25th. The ship Dmitriy Pozharskiy (UCJC) (61N 3E) reported a south wind of 50 kts at 0000 UTC on the 25th.
North Atlantic Storms, October 813: Two cyclones tracked east near 40N south of the Canadian Maritime Provinces and then turned north over the north-central Atlantic as hurricane-force lows. Figure 5 depicts the rapid development of the first low, with the central pressure dropping an impressive 41 hPa in the twenty-four hour period ending at 0000 UTC October 9. The ship Yorktown Express (WDD6127) (39N 44W) reported southwest winds of 60 kts at 1200 UTC on the 8th. Meanwhile the weaker 993-hPa low in Figure 5 is shown curving west toward Greenland ahead of the main development and develops hurricane-force winds against the southern tip of Greenland. These winds can be seen as a separate area in Figure 6’s QuikSCAT image, along with those associated with the stronger low to the south, and are actually stronger, up to 80 kts, near the tip of Greenland. The strong low turned northwest and stalled 200 nmi south of Greenland late on the 9th before weakening and turning south on the 10th, and maintained hurricane-force winds near Greenland until early on the 10th. The second developing strong low followed a similar track from late on the 9th through October 11th, developing a lowest central pressure of 964 hPa near 55N 34W at 1200 UTC on the 11th. The ship Sandon (ZDGR8) (59N 46W) encountered northwest winds of 50 kts at 1200 UTC on the 12th. This cyclone then turned more northeast and weakened to a gale-force low as it approached Iceland late on the 13th. This low then became absorbed by a developing low passing to the east on the 15th.
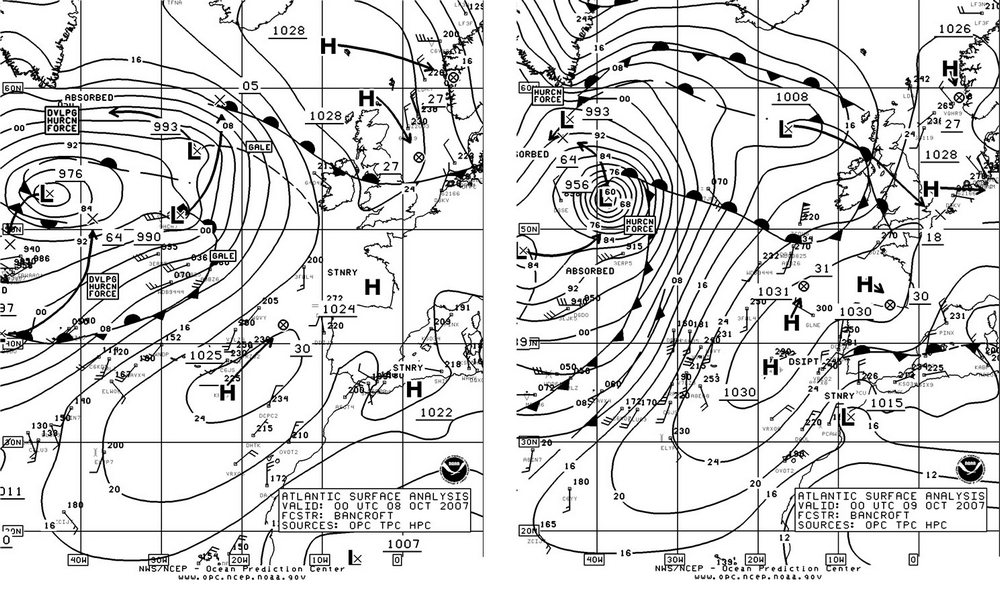
Figure 5. OPC North Atlantic Surface Analysis charts (Part 1) valid 0000 UTC October h and
0000 UTC October 9, 2007.
(Click to enlarge)
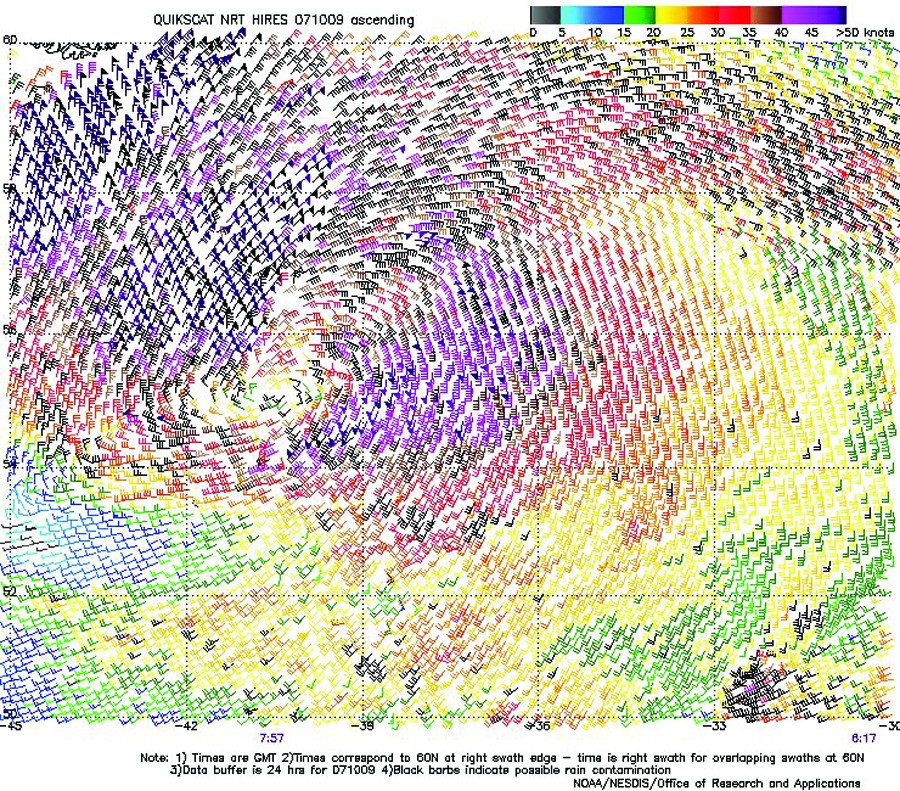
Figure 6. High-resolution QuikScat scatterometer image of satellite-sensed winds around the storm
shown in the second part of Figure 5. The valid time of the pass is 0757 UTC October 9, 2007, or
about eight hours later than the valid time of the second part of Figure 5. The center of the storm
appears near 55N 40W, and the southern tip of Greenland is near the upper-left corner.
Image is courtesy of NOAA/NESDIS/Office of Research and Applications
(Click to enlarge)
Northwest Atlantic/Greenland Storms, October 1518: The primary development consisted of a cyclone that formed from the merger of low pressure near Newfoundland and another intensifying low coming from southeast of Newfoundland early on the 15th, to form a 979-hPa low south of Greenland near 54N 44W at 0000 UTC on the 17th which then looped to the northwest and southwest in the Labrador Sea. This system was joined by another intensifying low coming from the south on the 17th, to near 57N 44W with a 970-hPa central pressure at 0600 UTC on the 18th. Storm-force winds accompanied these systems except for hurricane-force near the southern tip of Greenland briefly early on the 17th with the first low and early on the 18th with the second low (as in Figure 4). A merged system then looped to the southeast with winds diminishing to gale force late on October 18 before turning northeast toward Iceland through the 20th.
North Atlantic Storm of October 2123: A frontal system moved off the coast from Labrador southward late on October 20. A low pressure center formed on the front near 57N 51W with a 979-hPa central pressure at 1200 UTC on the 21st, when Hibernia Platform (VEP717, 46.7N 48.7W) reported southwest winds of 60 kts. The cyclone then tracked northeast and developed a lowest central pressure of 956 hPa near 64N 34W at 0600 UTC on the 23rd. The cyclone briefly produced hurricane-force winds north of the center in the Denmark Strait late on the 23rd, before the low stalled and weakened the next day, and became absorbed by a new storm system passing to the south late on the 24th.
Northeast Atlantic and North Sea Storm, November 79: With strong high pressure over the eastern waters, the next major development occurred over the far northern waters as depicted in Figure 7. The frontal wave of low pressure southwest of Iceland rapidly deepened as it moved beyond the high-pressure ridge, with the central pressure dropping 31 hPa in the twentyfour hour period ending at 0600 UTC November 8. The second part of Figure 7 shows the cyclone at maximum intensity (975 hPa) labeled as a hurricaneforce low. The buoy 62138 (58.3N 1.9W) reported west winds of 70 kts, while 62147 (57.8N 0.8W) had northwest winds of 60 kts at that time. Six hours later buoy 62138 and the ship British Falcon (MGRL8) (60N 4E) reported northwest winds of 65 kts. Also at that time the vessel Jura (MLCU2) (61N 1W) encountered north winds of 60 kts. Storm-force northwest winds continued in the North Sea until late on the 9th after the storm center moved inland over Norway late on the 8th. This was the strongest system, in terms of winds, to affect this part of the Atlantic basin during the period.
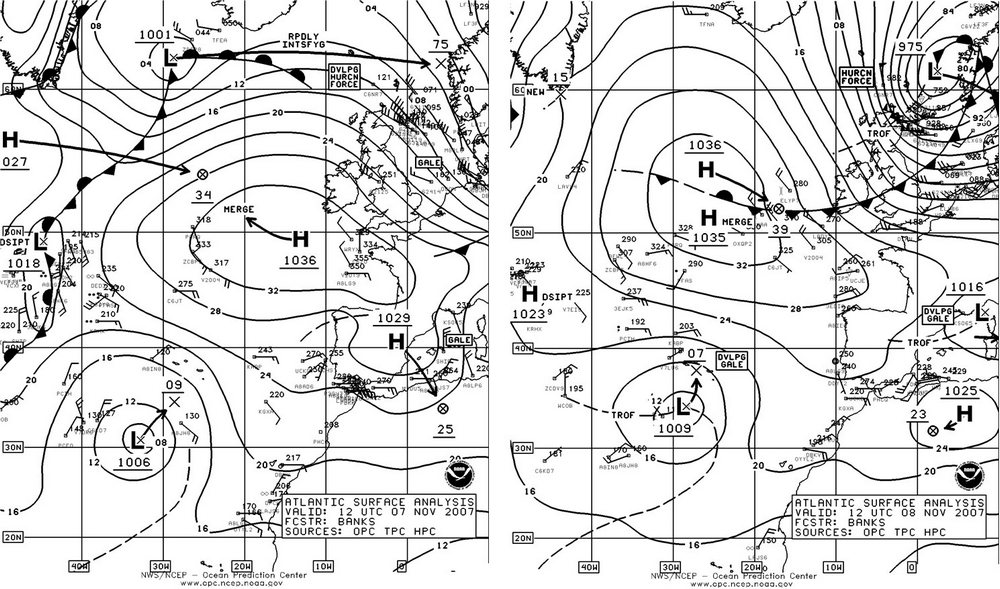
Figure 7. OPC North Atlantic Surface Analysis charts (Part 1) valid 1200 UTC November 7 and 8, 2007.
(Click to enlarge)
Southwestern North Atlantic Storm, November 1921: With blocking high pressure developing to the north over eastern Canada, the developing low off the U.S. east coast depicted in Figure 8 deepened 28 hPa in the twenty-four hour period ending at 1200 UTC on the 20th, but was a slow mover. Forming in a highpressure environment, this cyclone was able to develop hurricane-force winds with only a 988-hPa central pressure. The high-resolution scatterometer image in Figure 9 reveals winds up to 70 kts on the northwest side of the cyclone, with the center apparent near 37N 61W. The system stalled near 39N 58W late on the 20th before drifting southeast on the 21st. The Star Florida (LAVW4) near 39N 63W reported north winds of 45 kts at 1200 UTC November 21. The Turandot (SGBA) reported northeast winds of 45 kt near 37N 61W six hours later. The cyclone weakened to a gale 600 nmi south of Newfoundland late on the 21st as a new low formed north of the island of Newfoundland and headed northeast past Iceland on the 24th.
Northwest Atlantic/Greenland Storm, November 2426: A developing storm moved northeast from the island of Newfoundland late on November 23rd. The center moved to near 59N 49W with a 972-hPa central pressure at 1800 UTC on the 25th, while a secondary center formed to the east near 59N 39W. Brief hurricane- force northeast winds developed with the second center near the southern tip of Greenland at that time, as in the October 8-13 storms. The second center became dominant on the 26th as it headed northeast and weakened to a galeforce low.
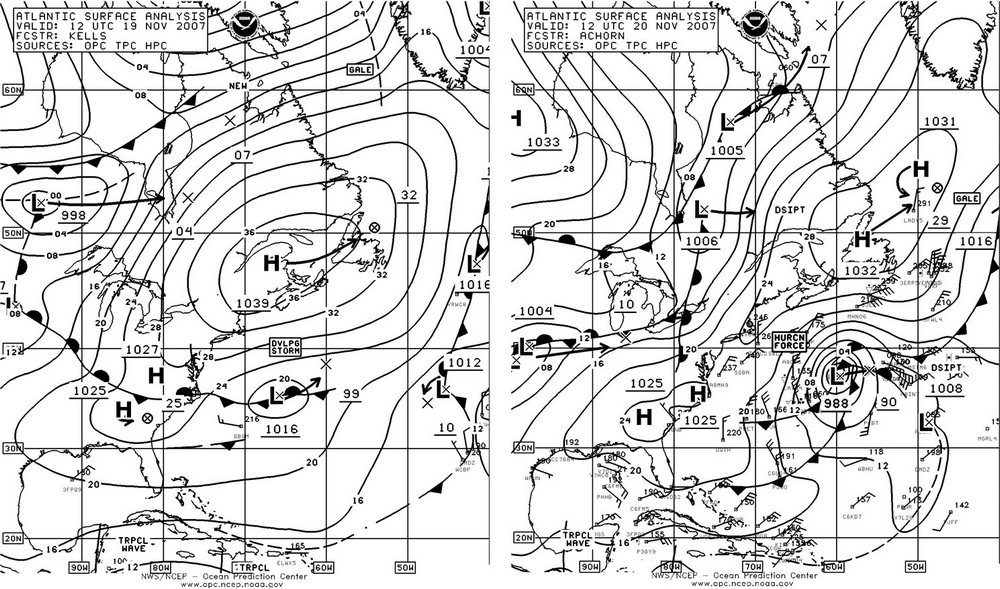
Figure 8. OPC North Atlantic Surface Analysis charts (Part 2) valid 1200 UTC November 19 and 20, 2007.
(Click to enlarge)
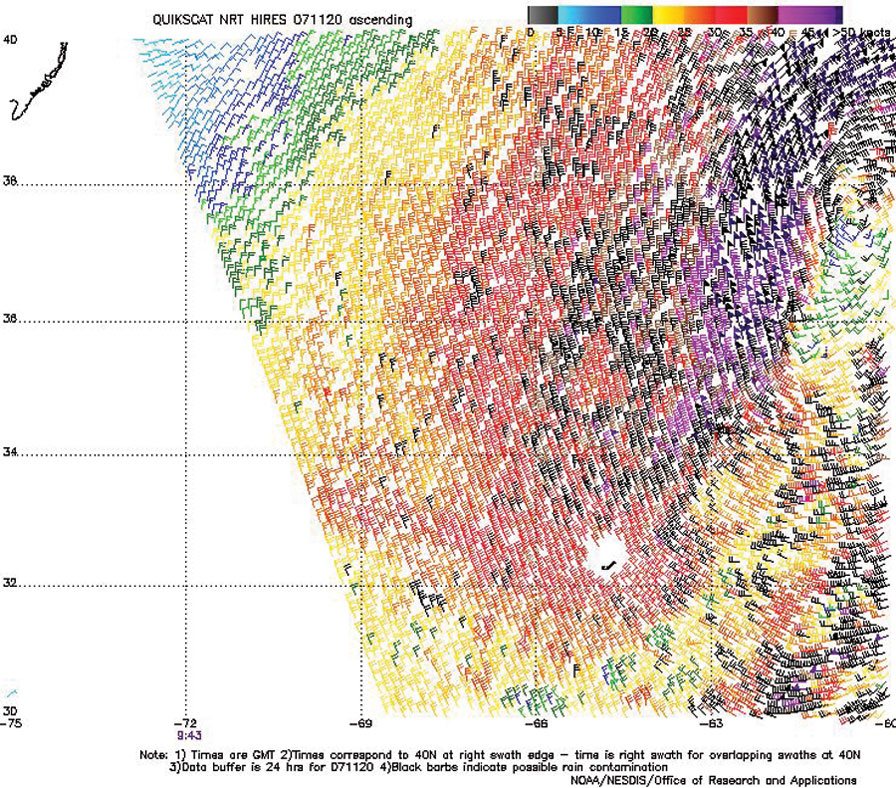
Figure 9. High-resolution QuikScat scatterometer image of
satellite-sensed winds around the west side of the storm shown in Figure 8.
The valid time of the pass is 0943 UTC November 20, 2007, or about two and
one-quarter hours prior to the valid time of the second part of Figure 8.
Image is courtesy of NOAA/NESDIS/Office of Research and Applications.
(Click to enlarge)
North Atlantic Storm, November 28-December 1: The development of this major storm over a thirtysix hour period is depicted in Figure 10. The central pressure fell 30 hPa in the twenty-four hour period ending at 1200 UTC on the 29th. The second part of Figure 10 shows the cyclone at maximum intensity, making it the second most intense of the period in the North Atlantic. With ship reports sparse in this area, the scatterometer imagery in Figure 11 reveals hurricane-force winds of up to 75 kts on the southwest side of the cyclone whose center is off the northeast edge of the image. Some ship, buoy and platform observations taken in this storm are listed in Table 2. The cyclone subsequently moved east along 60N with a slow weakening trend, with hurricane- force winds lasting until the 30th as the cyclone center was passing south of Iceland.
North Atlantic Storm, December 2-5: This system rapidly developed as it moved east from the island of Newfoundland late on December 1, developing hurricane-force winds west of the center as it passed over the Grand Banks late on December 2. The cyclone then turned northeast on the 3rd and developed a lowest central pressure of 954 hPa near 54N 35W at 0600 UTC on the 4th, while a second center formed southwest of Iceland and moved northwest and then west. The primary center maintained hurricane-force winds until early on the 4th with the second center developing hurricane force winds west of the center early on the 5th. The primary cyclone moved northeast and passed east of Iceland late on the 5th, while the second center stalled and weakened, dissipating on the 7th. Selected ship, buoy and platform observations are listed in Table 3.
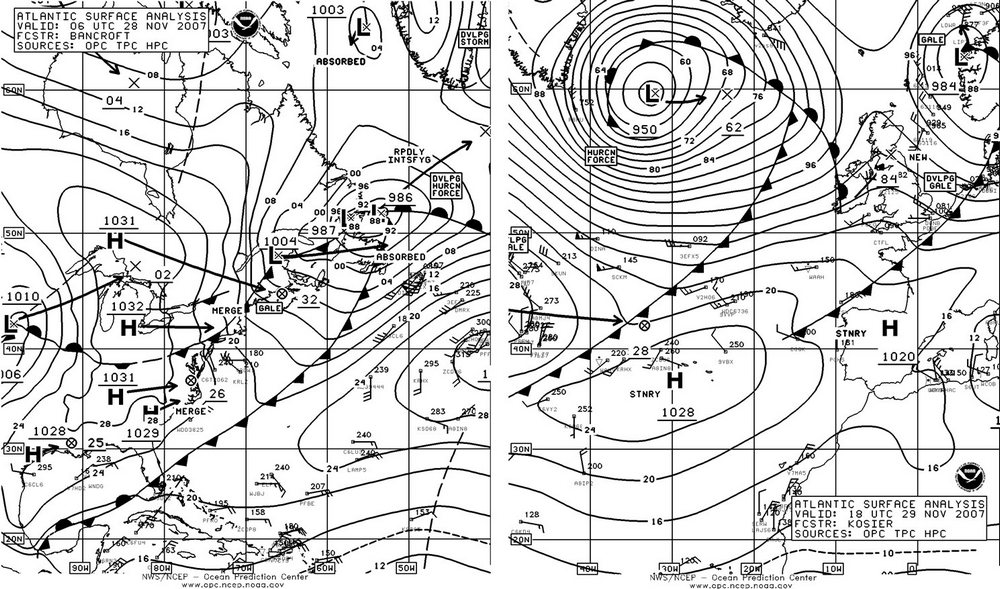
Figure 10. OPC North Atlantic Surface Analysis charts valid 0600 UTC November 28 (Part 2) and
1800 UTC November 29, 2007 (Part 1).
(Click to enlarge)
| OBSERVATION | POSITION | DATE/TIME(UTC) | WIND | SEAS(m/ft) |
|---|---|---|---|---|
| Atlantic Conveyer (SCKM) | 47N 37W | 29/1800 | W 55 | 7.5/24 |
| EWL Rotterdam (DINA) | 49N 39W | 29/1800 | W 55 | 4.5/14 |
| Canmar Honour (ZCBP5) | 47N 42W | 30/0000 | W 35 | 8.5/28 |
| Hibernia (VEP717) | 46.7N 48.7W | 28/0600 | SW 67 | |
| 28/2100 | W 55 | |||
| GSF Grand Banks (YJUF7) | 46.8N 48W | 28/1500 | SW 46 | |
| Terra Nova FPSO (VCXF) | 46.4N 48.4W | 28/0000 | SW 46 | |
| Buoy 44705 | 49.8N 42.9W | 29/0500 | W 50 | |
| Buoy 62108 | 53N 15.8W | 30/1300 | W 25 | 11.5/38 |
Table 2. Ship, buoy and platform observations taken during the storm of November 28-December 1, 2007.
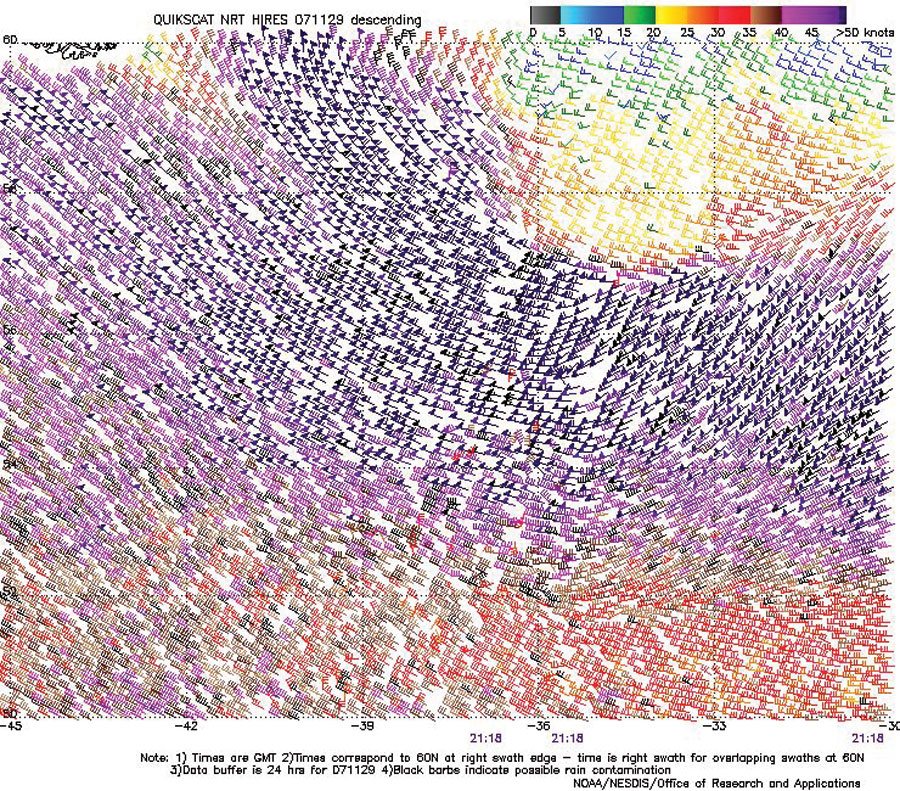
Figure 11. High-resolution QuikScat scatterometer image of satellite-sensed winds around the storm
in Figure 10. The valid time of the pass is 2118 UTC November 29, 2007, or about three and onequarter
hours later than the valid time of the second part of Figure 10. The center of the storm is off
the upper-right corner of the image. The southern tip of Greenland is near the upper left corner.
Image is courtesy of NOAA/NESDIS/ Office of Research and Applications.
(Click to enlarge)
North Atlantic Storm, December 79: This cyclone originated just south of Newfoundland on the afternoon of the 6th and tracked northeast to 55N 33W with a 972 hPa central pressure at 1800 UTC on the 7th, with the central pressure dropping 28 hPa in the preceding twenty-four hours. Figure 12 displays the development of this storm to maximum intensity over a thirty-six hour period. The cyclone developed a lowest central pressure of 963 hPa near 57N 22W at 1200 UTC on the 8th, when the center began to turn more southeast. High-resolution QuikSCAT winds were available and revealed hurricane-force winds to 70 kts on the southwest side of the storm early on the 8th, similar to Figure 11. The cyclone moved inland and weakened over northern Europe on the 9th. Some ship and buoy observations taken during this storm are listed in Table 4.
| OBSERVATION | POSITION | DATE/TIME(UTC) | WIND | SEAS(m/ft) |
|---|---|---|---|---|
| Jumbo Spirit (PFFH) | 43N 60W | 02/1200 | NW 55 | 13.0/42 |
| Flinterduin (PEBT) | 41N 60W | 02/1200 | NW 50 | 11.5/37 |
| President Truman (WNDP) | 39N 46W | 02/1200 | SW 40 | 8.5/28 |
| 39N 32W | 03/1800 | S 35 | 9.5/31 | |
| MOL Innovation (9VVP) | 45N 57W | 02/1800 | NW 50 | 7.5/25 |
| Overseas Ambermar (WDC7019) | 39N 43W | 03/1800 | W 35 | 12.0/40 |
| Hibernia (VEP717) | 46.7N 48.7W | 03/1500 | NW 68 | |
| GSF Grand Banks (YJUF7) | 46.8N 48W | 03/1500 | NW 57 | |
| 03/1800 | NW 45 | 7.5/24 | ||
| Terra Nova FPSO (VCXF) | 46.4N 48.4W | 03/1500 | NW 57 | |
| Buoy 44138 | 44.3N 53.6W | 02/2000 | NW 45 | 10.0/32 |
| 02/2300 | NW 45 | 10.5/35 |
Table 3. Ship, buoy and platform observations taken during the storm of December 25, 2007.
| OBSERVATION | POSITION | DATE/TIME(UTC) | WIND | SEAS(m/ft) |
|---|---|---|---|---|
| CSCL Fuzhou (ELYA7) | 47N 12W | 08/0600 | SW 45 | 13.0/42 |
| Marseille Star (9HCH7) | 47N 16W | 08/0600 | SW 35 | 8.0/26 |
| Esmeralda (A8IN8) | 48N 7W | 09/1800 | NW 50 | 10.0/33 |
| BATFR13 | 49.5N 4.5W | 09/0900 | W 55 | |
| Hanjin Geneva (DHZQ) | 45N 9W | 09/0900 | W 50 | 12.0/39 |
| Buoy 44705 | 49.6N 44.1W | 07/2300 | W 40 | |
| Buoy 62108 | 53.4N 17.9W | 08/2100 | maximum | 18.5/60 |
| Buoy 62095 | 53.0N 15.9W | 09/0000 | maximum | 17.0/56 |
| Buoy 62081 | 51.0N 13.3W | 09/0700 | NW 50 | 13.5/45 |
| 09/0300 | maximum | 16.5/54 | ||
| Buoy 62092 | 51.2N 10.5W | 09/0200 | SW 40 | 12.0/39 |
| 09/0400 | maximum | 13.5/45 | ||
| Buoy 62029 | 48.7N 12.5W | 09/0200 | NW 40 | 10.5/35 |
| 09/1100 | maximum | 16.0/52 | ||
| Buoy 62023 | 51.4N 7.8W | 09/0200 | W 60 | 10.5/34 |
| Buoy 62107 | 50.1N 6.1W | 09/0200 | SW 50 | 6.5/22 |
| Buoy 62163 | 47.5N 8.4W | 09/0600 | W 40 | 9.0/29 |
| 09/1100 | maximum | 14.0/46 |
Table 4. Ship and buoy observations taken during the storm of December 79, 2007.
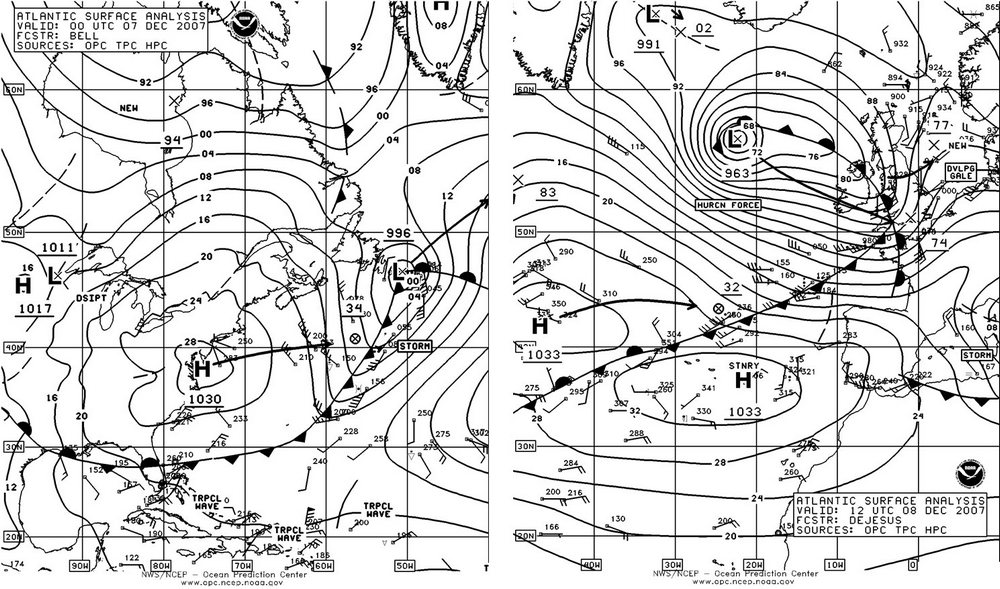
Figure 12. OPC North Atlantic Surface Analysis charts valid 0000 UTC December 7 (Part 2)
and 1200 UTC December 8, 2007 (Part 1).
(Click to enlarge)
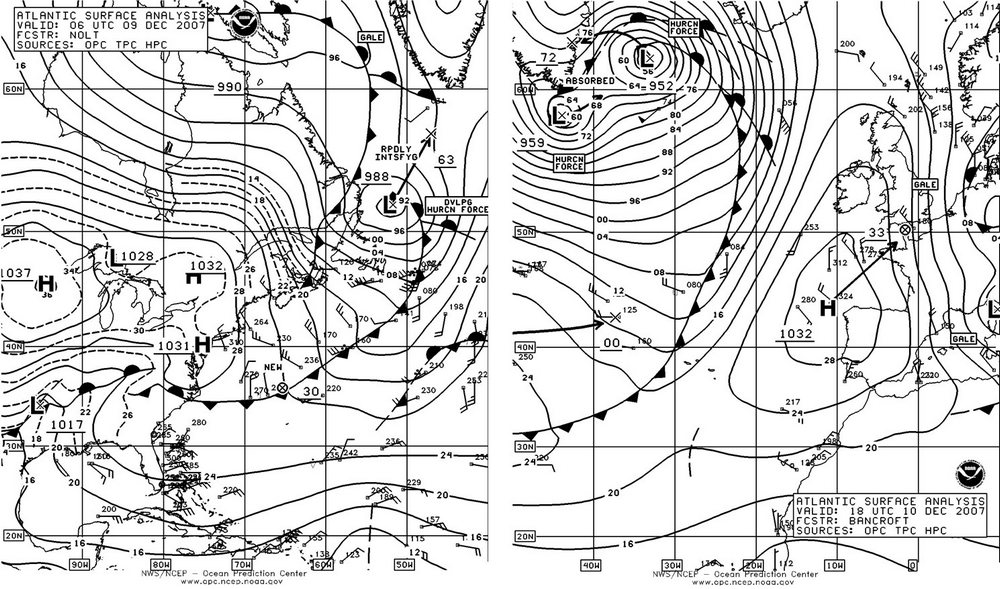
Figure 13. OPC North Atlantic Surface Analysis charts valid 0600 UTC December 9 (Part 2)
and 1800 UTC December 10, 2007 (Part 1).
(Click to enlarge)
North Atlantic Storms, December 911: This storm complex developed near Greenland as depicted in Figure 13, over a thirtysix hour period. The initial cyclone shown south of Greenland developed hurricane- force winds as it stalled south of Greenland late on the 9th with the winds appearing similar to those in the scatterometer image of Figure 11. The secondary intense low east of Greenland in Figure 13 originated about 300 nmi southeast of Newfoundland with a 1012 hPa center with the central pressure dropping 44 hPa during the next twenty-four hours. Figure 14 shows the high-resolution scatterometer winds around the secondary storm for the pass closest to the time of the second part of Figure 13. The author is inclined to accept the 90 kts winds in the Denmark Strait north of the low center from comparison with a short-term forecast of winds from a global atmospheric model. A ship, Nordon (PBHU) near 59N 31W, reported southwest winds of 50 kts at 1800 UTC on the 10th. The ship Independent Venture (A8CG2) (49N 44W) encountered west winds of 35 kts and 8.0 m seas (26 ft) six hours earlier. The two storm centers merged near the Greenland coast and weakened early on the 11th with dissipation following shortly thereafter.
Northeast Atlantic Storm, December 1113: A frontal wave of low pressure emerged from the U.S. mid- Atlantic coast early on December 10 and moved east-northeast before turning more northeast and intensifying rapidly west of the British Isles. The cyclone briefly developed hurricane-force winds as it approached Iceland with a 972 hPa central pressure at 0000 UTC on the 13th. The system passed north of Iceland six hours later.
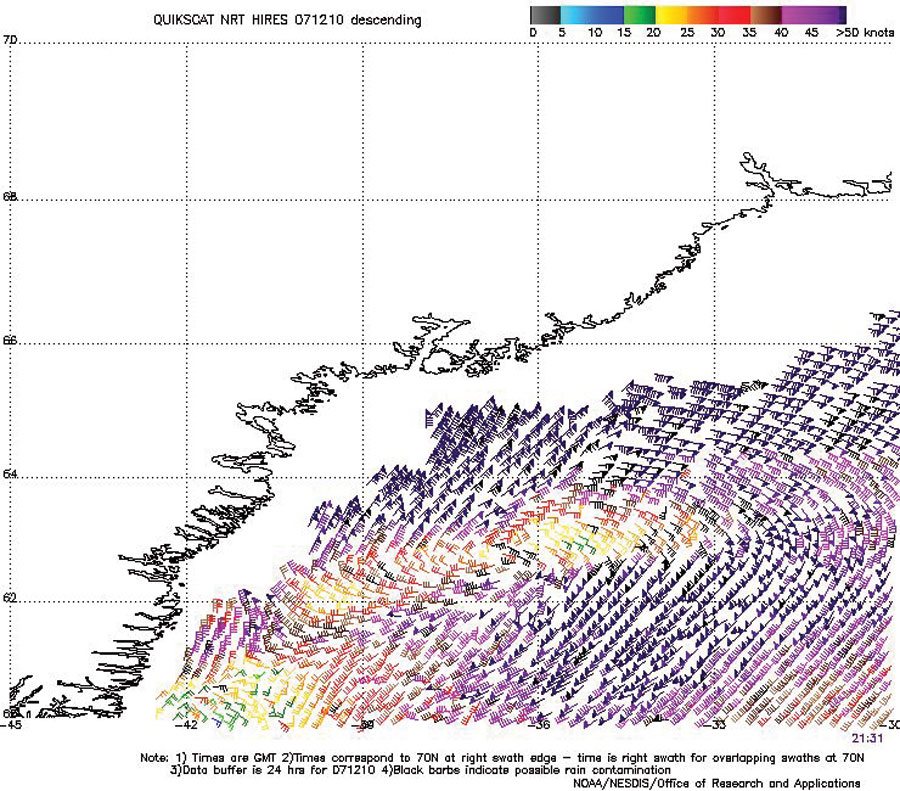
Figure 14. High-resolution QuikScat scatterometer image of satellite-sensed winds
around the storm east of Greenland shown in the second part of Figure 13. The
valid time of the pass is 2133 UTC December 10, 2007, or about three and one-half
hours later than the valid time of the second part of Figure 13.
Image is courtesy of NOAA/NESDIS/Office of Research and Applications.
North Atlantic Storm, December 1215: This cyclone developed as shown in Figure 15 and became the most intense cyclone of the period, not only of the North Atlantic but of the North Pacific as well. A storm of similar intensity developed about one year earlier as described in Reference 1. The second part of Figure 15 shows the cyclone at maximum intensity with a 928 hPa central pressure (27.40 in). The central pressure dropped 41 hPa in the twenty-four hour period ending at 1800 UTC on the 13th. Figure 16 is a 500 hPa analysis valid during the time of rapid intensification. Features supporting this development include the very strong jet stream of 135 kts, and diverging contours of 500 hPa north of the 500 hPa low, near where the surface low was at that time. See Reference 2 for more information on use of the 500 hPa chart. The hurricane-force winds lasted from the 13th through the 14th. The winds appearing in scatterometer imagery were similar to those in Figure 14 except not as strong north of the center with winds to 70 kts and a broader coverage of storm to hurricane-force winds. The Grand Banks platform (VCXF) (46.4N 48.5W) reported west winds of 60 kts and 4.0 m seas at 0900 UTC on the 13th, while GSF Grand Banks (YJUF7) at 46.8N 48W) encountered west winds of 50 kts. At 1000 UTC on the 13th the buoy 44704 (46.6N 39.9W) reported southwest winds of 50 kts. At 2000 UTC on the 14th a stationary ship or platform near the southwest coast of Iceland reported seas up to 13.0 m (42 ft). The cyclone subsequently stalled and weakened, and became absorbed by the next developing storm described below.
North Atlantic Storm, December 1517: The next development, not as strong, originated about 300 nmi southeast of Newfoundland late on the 14th and moved rapidly north, replacing the old cyclone east of Greenland early on the 16th with the central pressure as low as 964 hPa, before stalling and weakening near the Greenland coast through the 17th. Hurricane-force winds lasted for less than a day beginning 0000 UTC December 16.
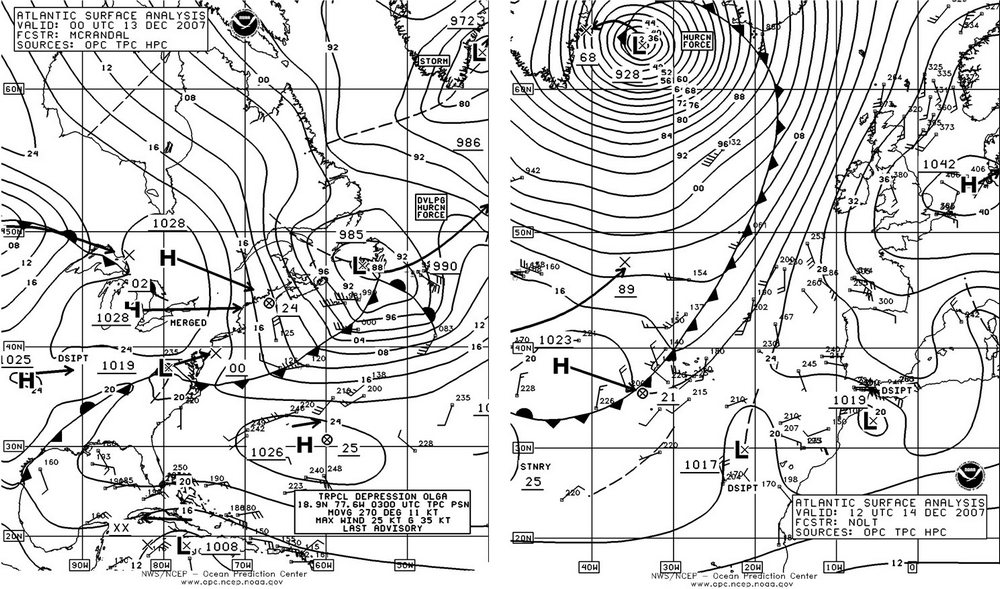
Figure 15. OPC North Atlantic Surface Analysis charts valid 0000 UTC December 13 (Part 2)
and 1200 UTC December 14, 2007 (Part 1).
(Click to enlarge)
North Atlantic Storm, December 1618: The next development was farther east with initial formation of a 996 hPa low neaar 42N 39W at 0600 UTC December 16. The cyclone tracked northeast and slowed while intensifying, developing a lowest central pressure of 974 hPa near 48N 30W at 0000 UTC on the 17th with the system stalling shortly thereafter, and dissipating late on the 17th. OPC analyzed this as a hurricane-force low only from 0000 UTC on the 17th until 06Z that day. The ship Finnpine (SFIR) (53N 30W) reported north winds of 60 kts at 0600 UTC on the 17th. Six hours later the vessel Barbet Arrow (C6QF6) (47N 28W) reported northwest winds of 35 kts and 11.5 m seas (37 ft). At 1800 UTC on the 17th the ship Western Highway (3EJK5) (45N 28W) encountered north winds of 55 kts and 5.5 m seas (18 ft). The buoy 44548 (44.3N 30W) reported a south wind of 60 kts at 1500 UTC on the 16th.
North Atlantic Storm, December 2831: The four-month period ended with yet another hurricaneforce low. This one originated as a frontal wave of low pressure near Georges Bank on December 27 and tracked northeast, developing hurricane-force winds as it passed east of Newfoundland late on the 28th. The central pressure dropped 22 hPa in the twenty-four hour period ending at 0000 UTC on the 29th. Hibernia Platform (VEP717) at (46.7N 48.7W) reported southwest winds of 70 kts at 0000 UTC on the 29th, while the platform VCXF (46.4N 48.4W) encountered southwest winds of 60 kts and 6.5 m seas (21 ft). GSF Grand Banks (YJUF7) at (46.8N 48W) reported southwest winds of 55 kts at this time, followed six hours later by a report of 7.5 m seas (24 ft). The Dresden Express (DHDE) near 43N 40W reported southwest winds of 55 kts at 0600 UTC on the 29th. The storm center continued to deepen as it moved north toward Greenland, developing a lowest central pressure of 952 hPa at 1800 UTC on the 30th near 64N 32W, where it remained through the end of the month. The ship Atlantic Carrier (SCKB) (55N 26W) encountered west winds of 45 kts and 10.5 m seas (35 ft) at 1800 UTC on the 30th. The system began to weaken by the 31st but hurricane-force winds persisted through the end of the month.
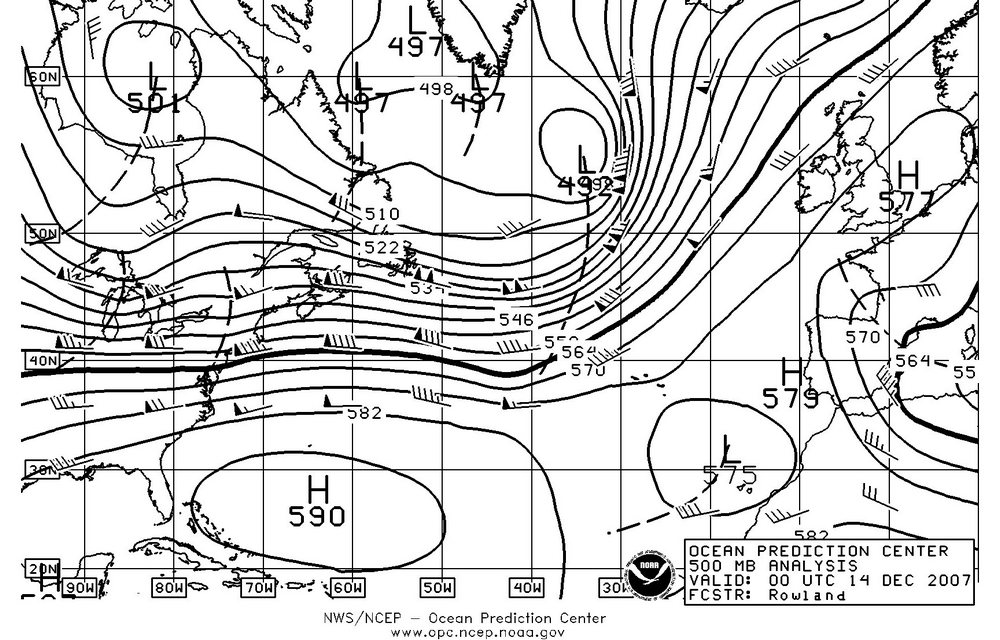
Figure 16. OPC North Atlantic 500 mb analysis valid 0000 UTC December 14, 2007, during the period of rapid intensification of the cyclone shown in Figure 15. The chart is computer- generated with short-wave trough manually added as dashed lines.
References
1. Bancroft, George, "Marine Weather Review, North Atlantic Area, September to December 2006", Mariners Weather Log April 2007.
2. Joe Sienkiewicz and Lee Chesneau, "Mariner’s Guide to the 500-Millibar Chart", Mariners Weather Log Winter 1995.
3. From Tropical Prediction Center website, http://www.nhc.noaa.gov/aboutsshs.shtml.
Back to top