Tropical Atlantic and Tropical East Pacific Areas September through December 2015
Marshall Huffman and Andy Latto
Tropical Analysis and Forecast Branch
National Hurricane Center, Miami, Florida
NOAA National Centers for Environmental Prediction
Tropical North Atlantic Ocean to 31N and Eastward to 35W, including the Caribbean Sea and the Gulf of Mexico
Atlantic Highlights
The TAFB Atlantic High Seas area of responsibility (AOR) extends from 7°N to 31°N west of 35°W, including the Caribbean Sea and Gulf of Mexico. Forty eight gale warnings were issued for this area from January through April 2016; with four storm force wind warnings and no hurricane force wind warnings issued during the period. The 48 warnings issued in the Atlantic basin was the second highest number of warnings ever issued by TAFB during a winter season, following the record breaking winter season of 2015 with 54 warnings. The number of warnings was up from the January through April five year average of 31 warnings. Of the 48 warnings issued, 15 of these were located in the Gulf of Mexico, 13 of these were located in the Atlantic Ocean, and 20 were located in the Caribbean Sea.
Table 1. Non-tropical warnings issued for the Atlantic Ocean between 01 January 2016 and 30 April 2016. Storm events are shaded and the duration of the storm warning is in parentheses.
| Onset | Region | Peak Wind | Gale Duration (Storm) | Forcing |
|---|---|---|---|---|
| 01 Jan 0000 UTC | Caribbean | 35 kts | 24h | Pressure Gradient |
| 01 Jan 1800 UTC | Gulf of Mexico | 40 kts | 24h | Cold Front |
| 03 Jan 0000 UTC | Gulf of Mexico | 35 kts | 06h | Cold Front |
| 03 Jan 1800 UTC | Gulf of Mexico | 35 kts | 06h | Cold Front |
| 06 Jan 1200 UTC | SW North Atlantic | 55 kts | 66h (12h) | Cold Front |
| 10 Jan 0600 UTC | SW North Atlantic | 50 kts | 78h (12h) | Cold Front |
| 15 Jan 0600 UTC | Gulf of Mexico | 35 kts | 12h | Pressure Gradient |
| 15 Jan 1200 UTC | SW North Atlantic | 40 kts | 36h | Pressure Gradient |
| 17 Jan 0000 UTC | Gulf of Mexico | 50 kts | 18h (12h) | Cold Front |
| 17 Jan 1200 UTC | SW North Atlantic | 40 kts | 24h | Pressure Gradient |
| 22 Jan 0600 UTC | Gulf of Mexico | 40 kts | 42h | Cold Front |
| 22 Jan 1800 UTC | SW North Atlantic | 35 kts | 66h | Cold Front |
| 26 Jan 0600 UTC | Caribbean | 35 kts | 12h | Pressure Gradient |
| 27 Jan 0600 UTC | Caribbean | 35 kts | 12h | Pressure Gradient |
| 27 Jan 0600 UTC | Gulf of Mexico | 35 kts | 42h | Cold Front |
| 29 Jan 0600 UTC | SW North Atlantic | 40 kts | 30h | Cold Front |
| 04 Feb 0000 UTC | Gulf of Mexico | 35 kts | 06h | Cold Front |
| 04 Feb 1800 UTC | Gulf of Mexico | 35 kts | 12h | Cold Front |
| 07 Feb 1200 UTC | SW North Atlantic | 50 kts | 36h (12h) | Cold Front |
| 08 Feb 1800 UTC | Gulf of Mexico | 35 kts | 36h | Cold Front |
| 09 Feb 0000 UTC | SW North Atlantic | 35 kts | 42h | Cold Front |
| 11 Feb 0600 UTC | Caribbean | 35 kts | 12h | Pressure Gradient |
| 12 Feb 0600 UTC | Caribbean | 35 kts | 12h | Pressure Gradient |
| 15 Feb 0600 UTC | Caribbean | 35 kts | 12h | Pressure Gradient |
| 16 Feb 0600 UTC | SW North Atlantic | 35 kts | 12h | Cold Front |
| 19 Feb 0600 UTC | Caribbean | 35 kts | 12h | Pressure Gradient |
| 20 Feb 0600 UTC | Caribbean | 35 kts | 12h | Pressure Gradient |
| 21 Feb 0600 UTC | Caribbean | 35 kts | 12h | Pressure Gradient |
| 23 Feb 1800 UTC | Gulf of Mexico | 35 kts | 30h | Cold Front |
| 04 Mar 1200 UTC | SW North Atlantic | 35 kts | 06h | Cold Front |
| 07 Mar 1800 UTC | SW North Atlantic | 40 kts | 24h | Cold Front |
| 09 Mar 0600 UTC | Gulf of Mexico | 35 kts | 36h | Cold Front |
| 10 Mar 0000 UTC | Caribbean | 35 kts | 36h | Pressure Gradient |
| 11 Mar 1800 UTC | Caribbean | 35 kts | 18h | Pressure Gradient |
| 20 Mar 0000 UTC | Gulf of Mexico | 40 kts | 30h | Cold Front |
| 23 Mar 0000 UTC | Caribbean | 35 kts | 12h | Pressure Gradient |
| 24 Mar 0000 UTC | Caribbean | 35 kts | 06h | Pressure Gradient |
| 25 Mar 0000 UTC | Caribbean | 35 kts | 12h | Pressure Gradient |
| 26 Mar 0000 UTC | Caribbean | 35 kts | 12h | Pressure Gradient |
| 27 Mar 0600 UTC | Caribbean | 35 kts | 06h | Pressure Gradient |
| 28 Mar 0000 UTC | Caribbean | 35 kts | 12h | Pressure Gradient |
| 31 Mar 0600 UTC | Gulf of Mexico | 40 kts | 06h | Pressure Gradient |
| 02 Apr 0600 UTC | Gulf of Mexico | 40 kts | 18h | Cold Front |
| 09 Apr 0600 UTC | Caribbean | 35 kts | 06h | Pressure Gradient |
| 10 Apr 0600 UTC | Caribbean | 35 kts | 06h | Pressure Gradient |
| 11 Apr 0600 UTC | Caribbean | 35 kts | 06h | Pressure Gradient |
| 20 Apr 0600 UTC | SW North Atlantic | 35 kts | 12h | Cold Front |
| 25 Apr 1200 UTC | SW North Atlantic | 40 kts | 24h | Pressure Gradient |
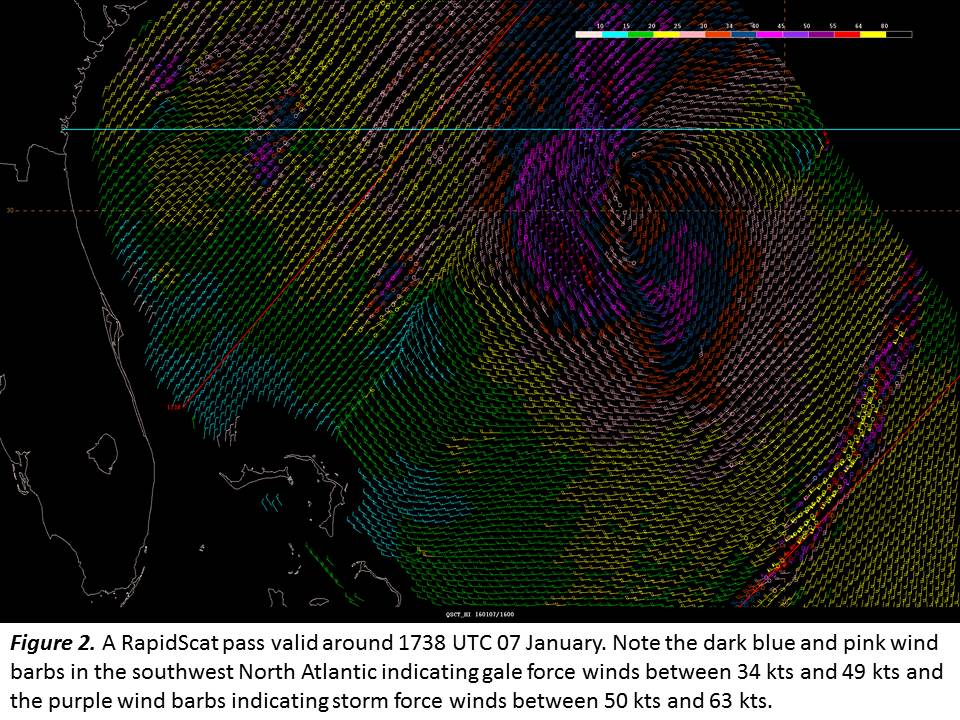
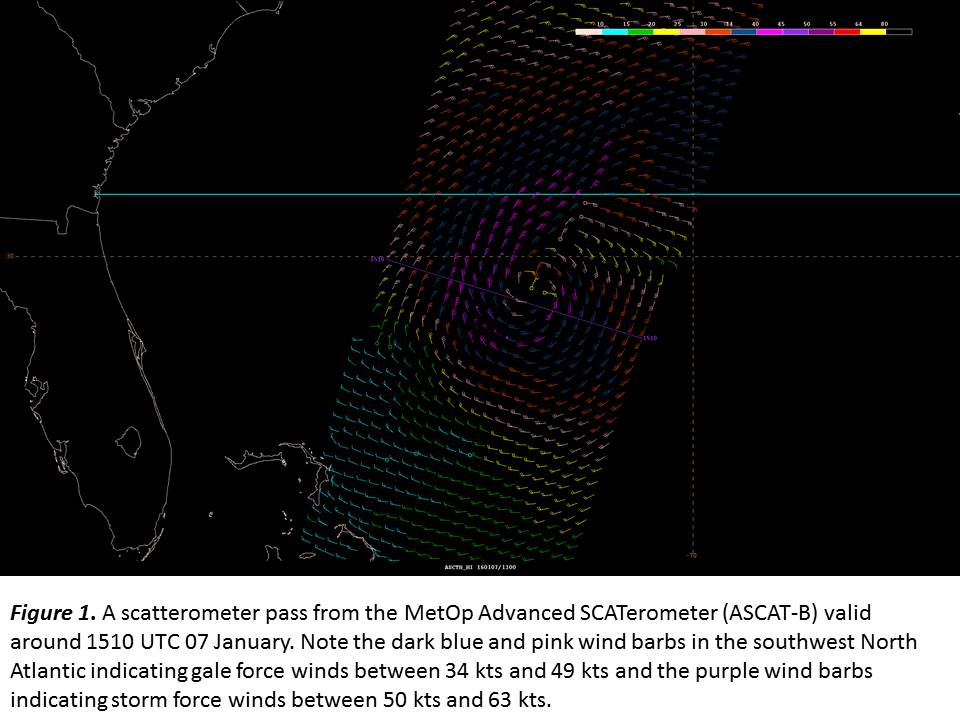
Table 1 details the warnings issued in the TAFB Atlantic High Seas AOR from January through April 2016. The strongest wind event this winter season was a storm force event that occurred in the southwest North Atlantic region that materialized as a weak 1012 hPa low pressure area on 06 January at 1800 UTC across the northwestern Bahamas. The low went through a period of rapidintensification, deepening to 987 hPa, a drop of more than 1 hPa an hour within a 24 hour Figure 2. A RapidScat pass valid around 1738 UTC 07 January. Note the dark blue and pink wind barbs in the southwest North Atlantic indicating gale force winds between 34 kts and 49 kts and the purple wind barbs indicating storm force winds between 50 kts and 63 kts. period by 07 January at 1800 UTC. The result of this rapid deepening generated gale force conditions for almost three days beginning 06 January at 1200 UTC in the vicinity of the low center. A brief 12 hour period of storm force winds occurrednear the low center with Figure 1 showing a MetOp AdvancedxxSCATerometer (ASCAT-B) pass from 07 January. Note the blue and pink wind barbs indicating 34-49 kts gale force winds and purple wind barbs indicating 50-63 kts storm force winds in the southwest North Atlantic that reached the surface. Warnings were discontinued across the region by 0600 UTC 09 January.
Figure 2 shows a RapidScat pass several hours later on 07 January indicating the storm force winds within the southwestern quadrant of the low. The RapidScat instrument is currently a scatterometer onboard the International Space Station (ISS).
During this storm force wind event, several ships reported gale or storm force conditions and these are summarized in Table 2.
Table 2. Ship observations during the gale warning period beginning 06 January 1200 UTC and ending 09 January 0600 UTC.
| Ship | Call Sign | Wind Speed | Location | Date/Time |
|---|---|---|---|---|
| Carnival Fantasy | H3GS | 40 kts | 23.5N 80.0W | 06 Jan 1200 UTC |
| Carnival Fascination | C6FM9 | 35 kts | 26.5N 79.3W | 06 Jan 1200 UTC |
| Celebrity Eclipse | 9HXC9 | 39 kts | 25.6N 77.5W | 06 Jan 2300 UTC |
| COSCO Germany | CQGT | 45 kts | 28.4N 74.3W | 07 Jan 1200 UTC |
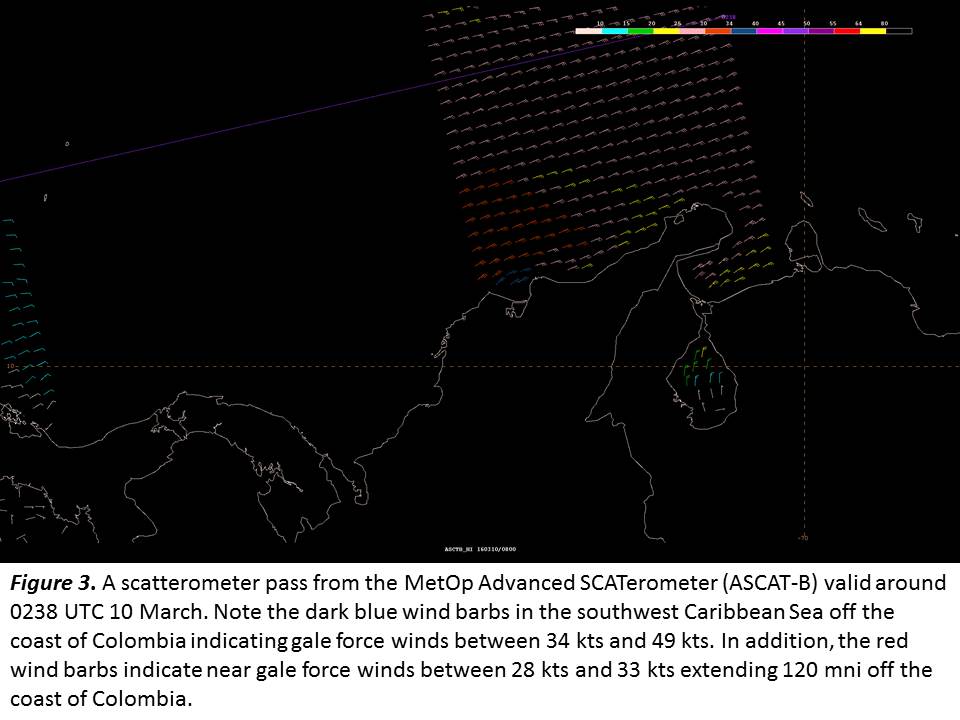
The longest duration gale force wind event for the Caribbean Sea was 36 hours in length and formed due to a strong pressure gradient set up between a relatively strong high pressure system anchored across the southwest North Atlantic Ocean and lower pressure across the northwestern South American continent. Gale force conditions persisted for a day and a half before a frontal trough across the southeastern United States weakened the southwest North Atlantic ridging and relaxed the pressure gradient across the Caribbean Sea. Figure 3 shows a MetOp Advanced SCATerometer (ASCAT-B) pass from 10 March.
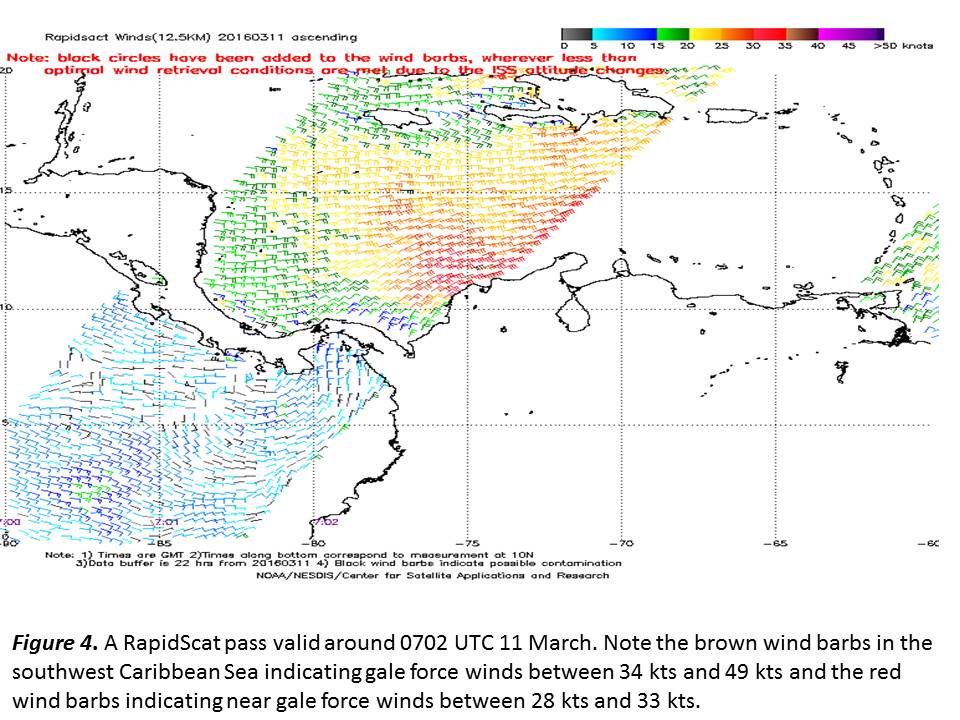
Note the blue wind barbs indicating 34 to 40 kts winds in the southwestern Caribbean Sea near the coast of Colombia that reached the surface. In addition, the red wind barbs indicate near gale force winds, 28 to 33 kts winds extending 120 nmi off the northern coast of Colombia. Figure 4 shows a RapidScat pass more than 24 hours later early on 11 March indicating the extent of near gale to gale force winds continuing across a large portion of the southwest Caribbean Sea. Warnings were discontinued in the Caribbean Sea by 1200 UTC 11 March.
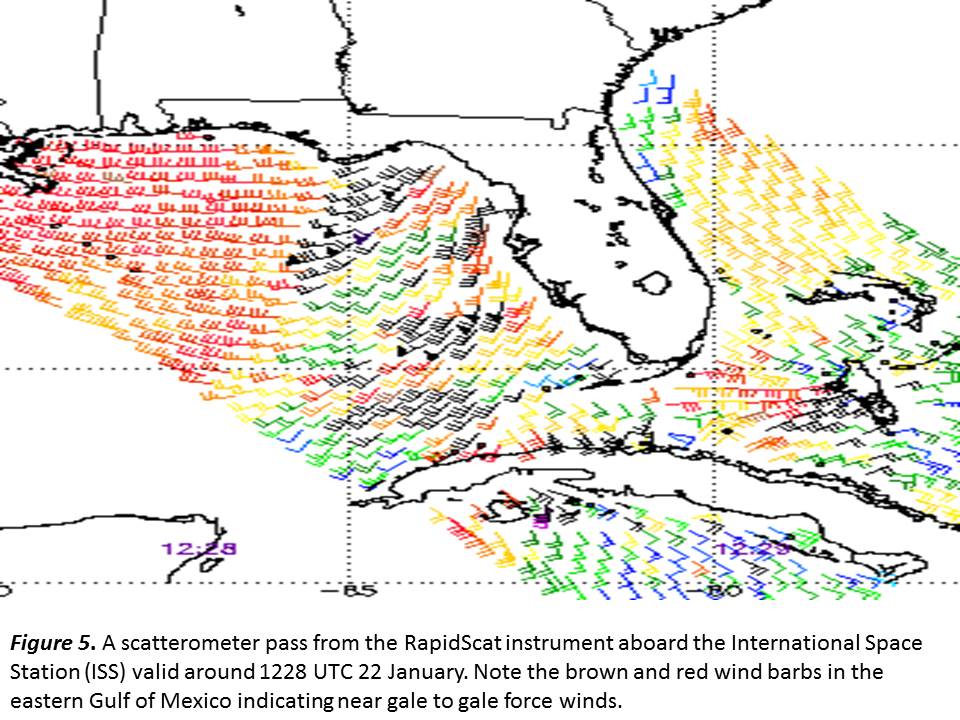
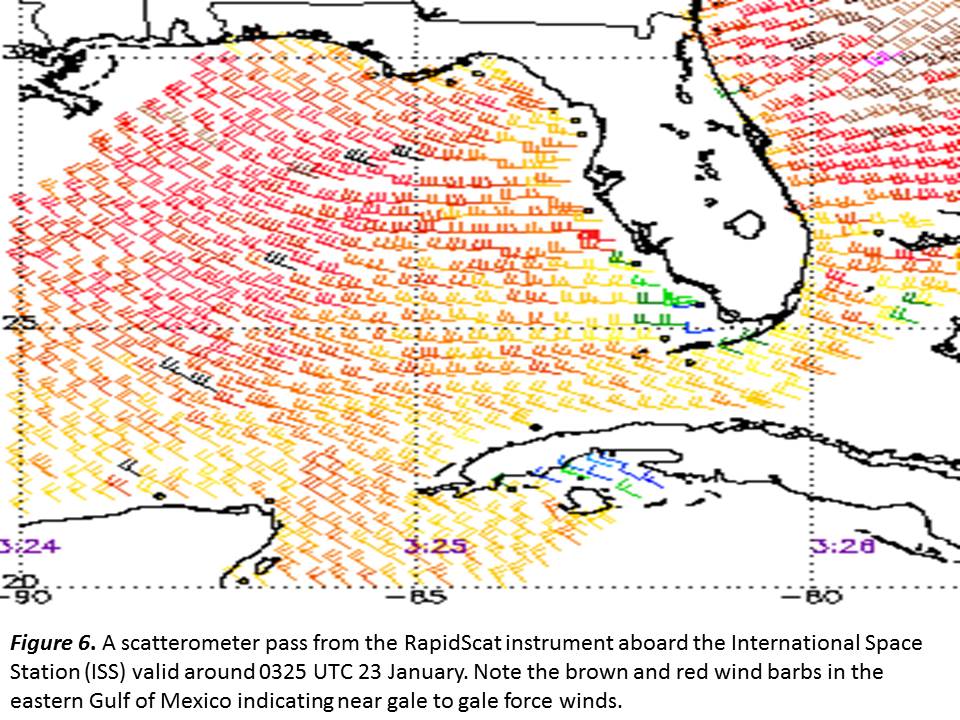
The strongest and longest duration Gulf of Mexico warning was a gale force warning that occurred across the basin in the four month period. This gale force warning began at 0600 UTC 22 January and persisted for 42 hours. A strong surface pressure gradient materialized across the Gulf of Mexico waters after the passage of a strong cold front. Table 3 summarizes ships that reported winds of gale force or greater west of the cold front. The following two figures, Figure 5 and Figure 6, are RapidScat passes valid during the warning period time showing brown and red wind barbs which indicate near gale to gale force conditions.
Table 3. Ship observations during the gale warning period beginning 22 January 0600 UTC and ending 24 January 0000 UTC.
| Ship | Call Sign | Wind Speed | Location | Date/Time |
|---|---|---|---|---|
| Discoverer Deep Seas | V7HC6 | 38 kts | 28.7N 90.0W | 22 Jan 0600 UTC |
| Overseas Anacortes | KCHV | 40 kts | 28.7N 88.0W | 22 Jan 0600 UTC |
| Pacific Sharav | D5DY4 | 44 kts | 27.1N 91.2W | 22 Jan 0700 UTC |
| Maersk Carolina | WBDS | 37 kts | 26.6N 89.2W | 22 Jan 1200 UTC |
| Maersk Carolina | WBDS | 35 kts | 27.3N 91.1W | 22 Jan 1800 UTC |
| Norwegian Jade | C6WK7 | 36 kts | 28.2N 92.9W | 23 Jan 0000 UTC |
| Brasil Voyager | C6ZJ8 | 38 kts | 29.1N 87.1W | 23 Jan 0000 UTC |
| Caribbean Princess | ZCDG8 | 45 kts | 24.2N 88.6W | 23 Jan 0000 UTC |
| Carnival Dream | 3ETA7 | 35 kts | 22.5N 85.7W | 23 Jan 0100 UTC |
| Asia Vision | C6AX3 | 40 kts | 23.9N 84.1W | 23 Jan 0300 UTC |
| Norwegian Dawn | C6FT7 | 40 kts | 22.1N 86.5W | 23 Jan 0700 UTC |
| Seabulk Trader | KNJK | 45 kts | 26.8N 89.9W | 23 Jan 1000 UTC |
| Norwegian Star | C6FR3 | 43 kts | 23.6N 86.0W | 23 Jan 1200 UTC |
| Regal Princess | ZCEK6 | 40 kts | 23.7N 81.8W | 23 Jan 2000 UTC |
Tropical Eastern North Pacific Ocean to 30N and East of 140W
Pacific Highlights
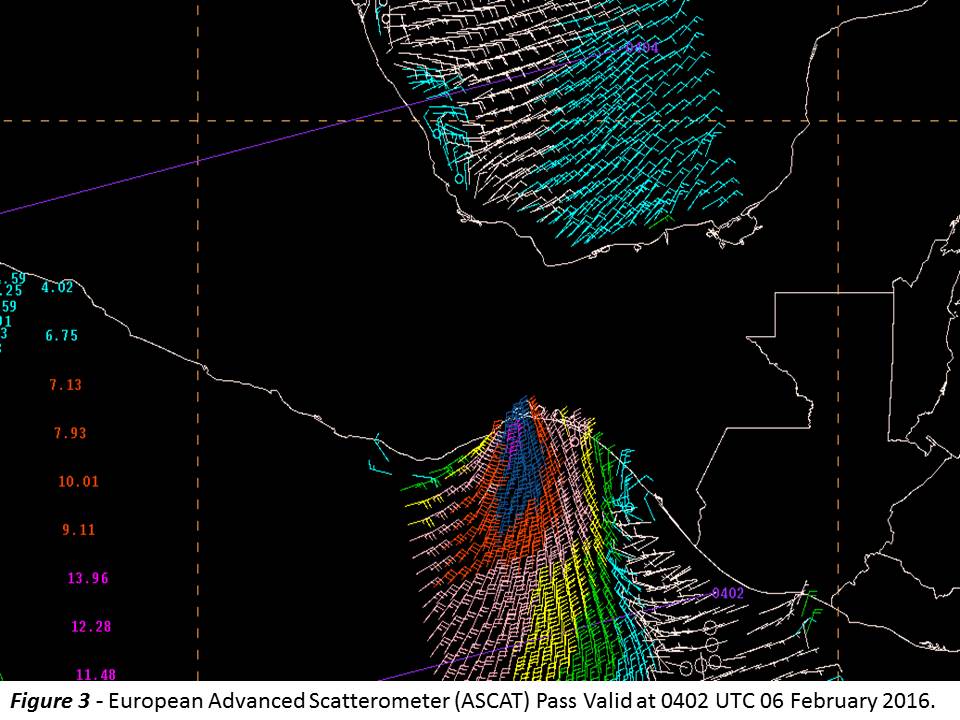
There were 25 gale or stronger events in the North Pacific east of 140W between 30N and the equator from 01 January 2016 to 30 April 2016 (Table P-A). Of these events, 11 occurred over the gulf of Tehuantepec, 4 over the Gulf of Papagayo, 5 over the open waters of the Pacific N of 27N, 4 over the Gulf of California, and 1 over the tropical Pacific. Four of the events over the Gulf of Tehuantepec reached Storm Force of 50 kts or greater with nine events over this portion of the Pacific persisting 36 hours or longer at gale force.
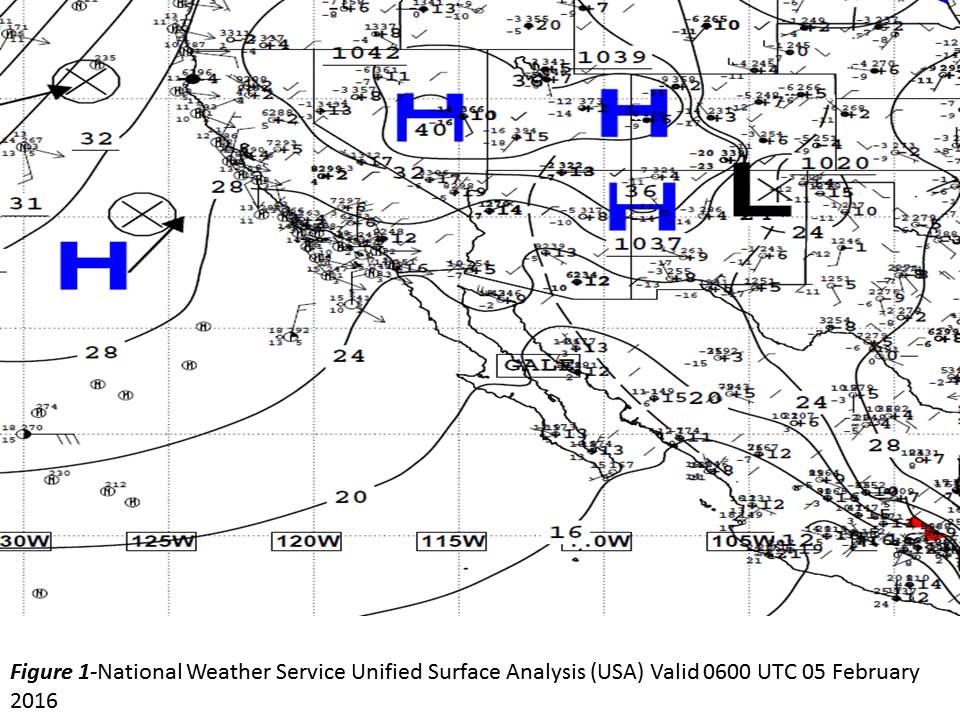
February 5 Gulf of California Gale:
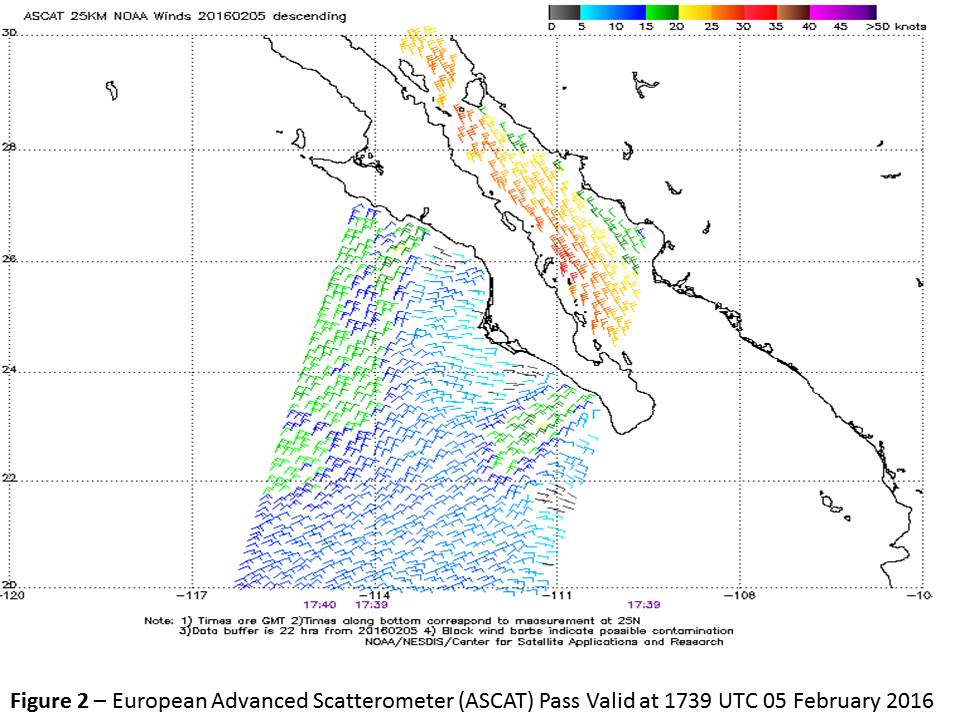
There were several Gulf of California Gale events during the first four months of 2016. These gale events can occur from a variety of pressure forcing schemes. Gale events February 1 and again March 8 occurred due to a strong cold front passing across the region. A different setup forced the gale event on February 5. Figure 1, a trough of low pressure developed over western Mexico to the east of the Gulf of California, while a very strong 1042 hPa high pressure builds southeastward over the Great Basin. This particular event was not directly from a frontal passage, but rather from the tight pressure gradient that established itself across the region. Figure 2, a Strong to gale-force north-northwest winds extend across the entire length of the Gulf of California. This particular event lasted only 12 hours, as the diurnally driven trough dissipated. By the time the trough redeveloped the next day, the strong high to the north had shifted to the east.
Table P-A lists the Gale or greater events over the northern Pacific east of 140 W between 30 N and the Equator.
| Onset | Region | Peak Wind Speed | GALE/STORM Duration | Forcing |
|---|---|---|---|---|
| 0430 UTC 01 Jan | Gulf of Tehuantepec | 40 kts | 108 hr | Gap |
| 0430 UTC 03 Jan | Eastern Pacific 27N | 35 kts | 12 hr | Front |
| 1630 UTC 10 Jan | Eastern Pacific 28N | 35 kts | 06 hr | Front |
| 1630 UTC 10 Jan | Gulf of Tehuantepec | 40 kts | 24 hr | Gap |
| 0430 UTC 13 Jan | Gulf of Tehuantepec | 35 kts | 12 hr | Gap |
| 1630 UTC 17 Jan | Gulf of Tehuantepec | 50 kts | 72 hr / 6hr | Gap |
| 1030 UTC 19 Jan | Gulf of Papagayo | 35 kts | 30 hr | Gap |
| 1630 UTC 22 Jan | Gulf of Tehuantepec | 50 kts | 54 hr / 24hr | Gap |
| 1030 UTC 24 Jan | Gulf of Papagayo | 35 kts | 36 hr | Gap |
| 1030 UTC 28 Jan | Gulf of Tehuantepec | 40 kts | 36 hr | Gap |
| 1030 UTC 01 Feb | Gulf of California | 35 kts | 18 hr | Front |
| 1030 UTC 04 Feb | Gulf of Tehuantepec | 50 kts | 252 hr / 30hr | Gap |
| 0430 UTC 05 Feb | Gulf of California | 35 kts | 18 hr | Front |
| 1630 UTC 07 Feb | Gulf of Papagayo | 40 kts | 126 hr | Gap |
| 0430 UTC 14 Feb | Eastern Pacific 13N | 40 kts | 36 hr | Trough |
| 0430 UTC 17 Feb | Gulf of Tehuantepec | 45 kts | 84 hr | Gap |
| 1030 UTC 19 Feb | Gulf of Papagayo | 35 kts | 36 hr | Gap |
| 0430 UTC 23 Feb | Eastern Pacific 29N | 35 kts | 06 hr | Front |
| 2230 UTC 24 Feb | Gulf of Tehuantepec | 55 kts | 96 hr/ 12 hr | Gap |
| 1030 UTC 08 Mar | Eastern Pacific 29N | 35 kts | 12 hr | Front |
| 1030 UTC 08 Mar | Gulf of California | 35 kts | 12 hr | Front |
| 2230 UTC 10 Mar | Eastern Pacific 27N | 35 kts | 12 hr | Front |
| 2230 UTC 20 Mar | Gulf of Tehuantepec | 45 kts | 54 hr | Gap |
| 1030 UTC 29 Mar | Gulf of California | 35 kts | 12 hr | Front |
| 0430 UTC 03 Apr | Gulf of Tehuantepec | 40 kts | 114 hr | Gap |
Gulf of Tehuantepec Gale and Storm Warnings:
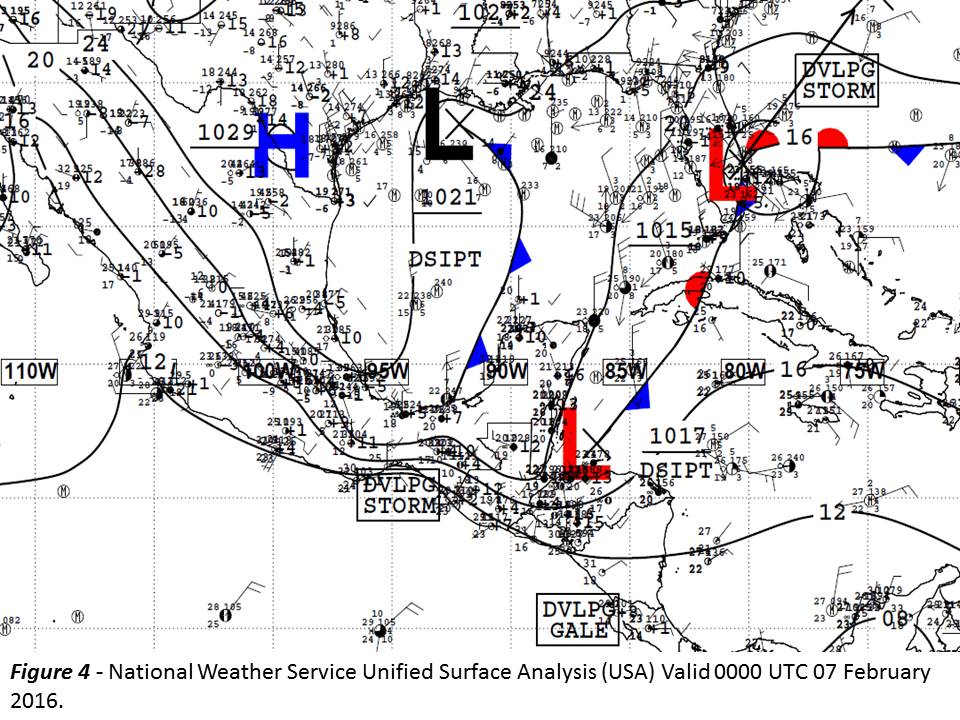
The Gulf of Tehuantepec wind events are usually driven by mid-latitude cold frontal passages through the narrow Chivela Pass in the Isthmus of Tehuantepec between the Sierra Madre de Oaxaca Mountains on the west and the Sierra Madre de Chiapas Mountains on the east. The northerly winds from the southwest Gulf of Mexico funnel through the pass delivering stronger winds into the Gulf of Tehuantepec. The 906 hours of duration of gale force or higher warnings in the January through April 2016 period for the Gulf of Tehuantepec nearly matched the 936 hours during the same period in 2015, and was 45% greater than the 627 hours in 2014. The 72 hours of storm warnings for this period in 2016 exceeded the 60 hours of storm warnings for this same period in 2015.
The longest duration gale/storm event that occurred during the January to April 2016 time period began 1030 UTC February 4 with long duration gale force winds lasting until 2230 UTC February 14 (a total of 252 hours). Storm-force winds developed during two different time periods during this long duration gale, (from 0430 UTC-2230 UTC February 5, and from 1030 UTC- 2230 UTC February 7) totaling 30 hours. The same high pressure ridge that forced the February 1 Gulf of California event eventually helped to force this Tehuantepec event. Also, the classic setup for driving a Tehuantepec event was indicated in computer model forecasts and Gale warnings were hoisted 24 hours in advance of the event while the strong cold front crossed northeastern Mexico. (Figure 3) Severe gale winds are occurring over the Gulf of Tehuantepec north of 15N along 95W. (Figure 4) Gale conditions were already underway over the Gulf of Tehuantepec while a reinforcing Gulf of Mexico cold front pushed across the coast of southern Mexico. A strong 1029 hPa high over southern Texas behind the front forced the Tehuantepec gap winds to increase to storm force over the subsequent 12 hours.
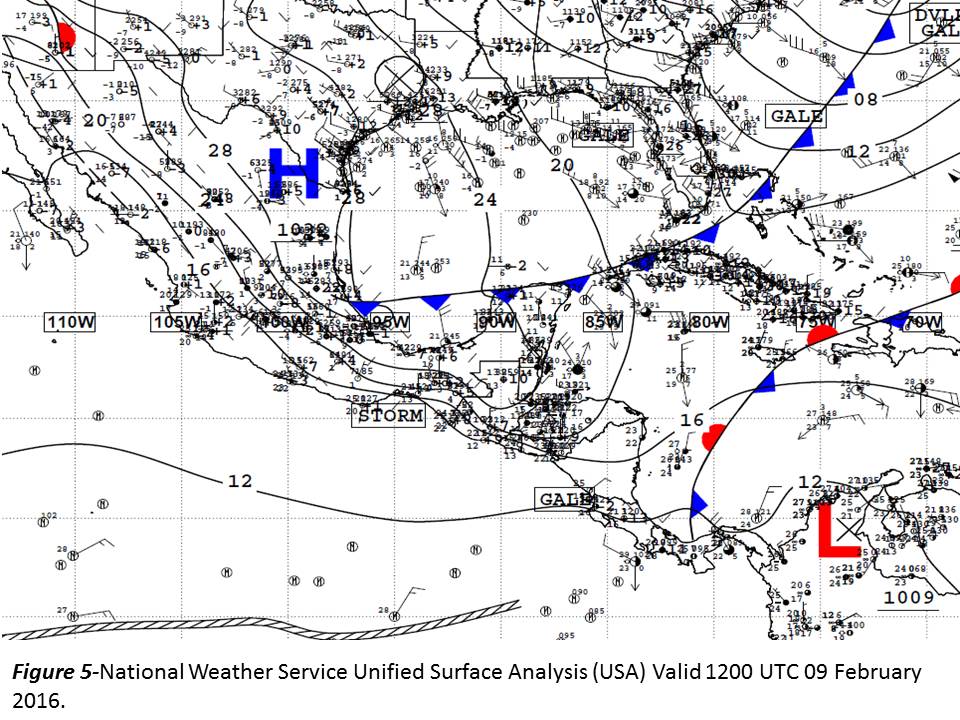
Five Day Papagayo Gale:
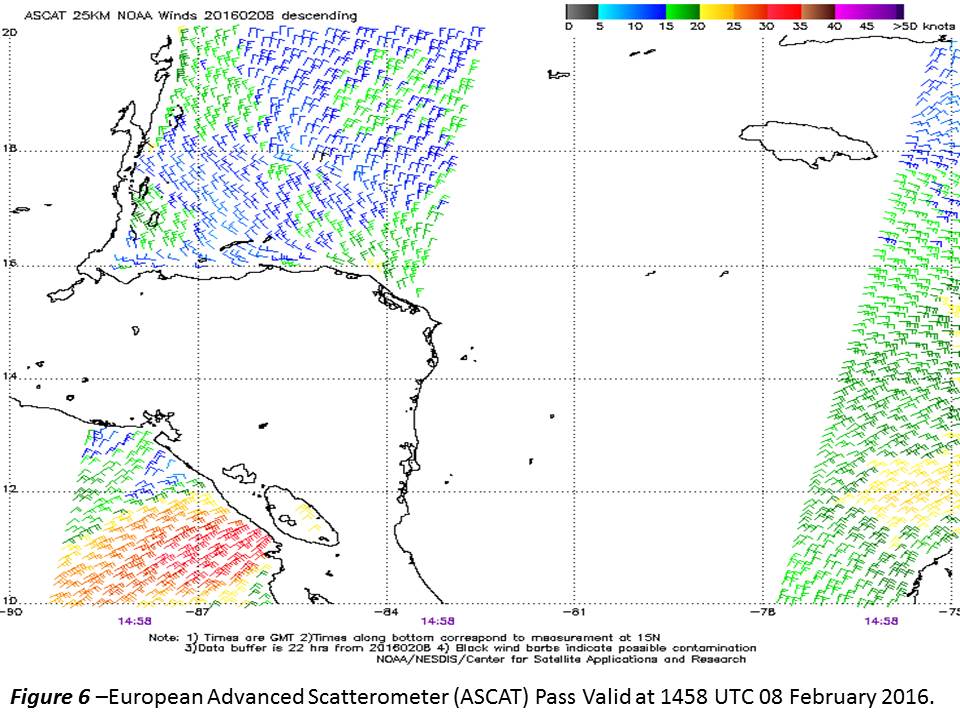
The Gulf of Papagayo gap wind events are usually driven by strong Caribbean Sea trade winds that traverse the San Juan River valley and the southern portion of Lake Nicaragua to the Pacific Ocean. Winds in the Gulf of Papagayo during these events are usually less than gale force. On rare occasions a strong cold front reaches the coast of southern Nicaragua and funnels stronger winds through the gap. The winds are further enhanced by nocturnal and early morning drainage flow. The same strong high pressure that forced the long duration early February Tehuantepec event built southeastward over the Gulf of Mexico February 4 and was reinforced on February 8 as a series of cold fronts swept across the Gulf of Mexico and western Caribbean. The strength of the first high forced a cold front unusually far south into the southwestern Caribbean on February 6 and 7, initiating this gap wind event. The second high helped to reinforce the tight pressure gradient across the region (Figure 5). A cold front has already passed southeast of Nicaragua and has stalled out over the southwestern Caribbean to Panama. (Figure 6) Winds to gale-force extend from the Gulf of Papagayo as far west as 88W between 10.5N and 11.5N. The ISLAND PRINCESS (ZCDG4) also reported gale force winds on 11 February 2016 while passing by the Gulf of Papagayo.
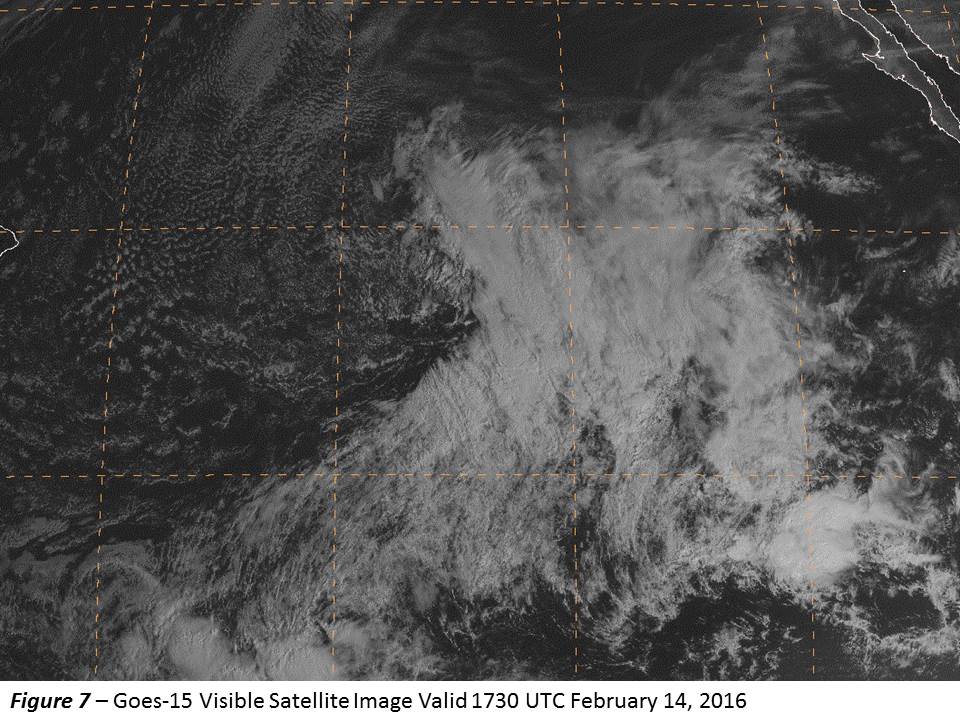
Valentine's Day Tropical Pacific Gale Event:
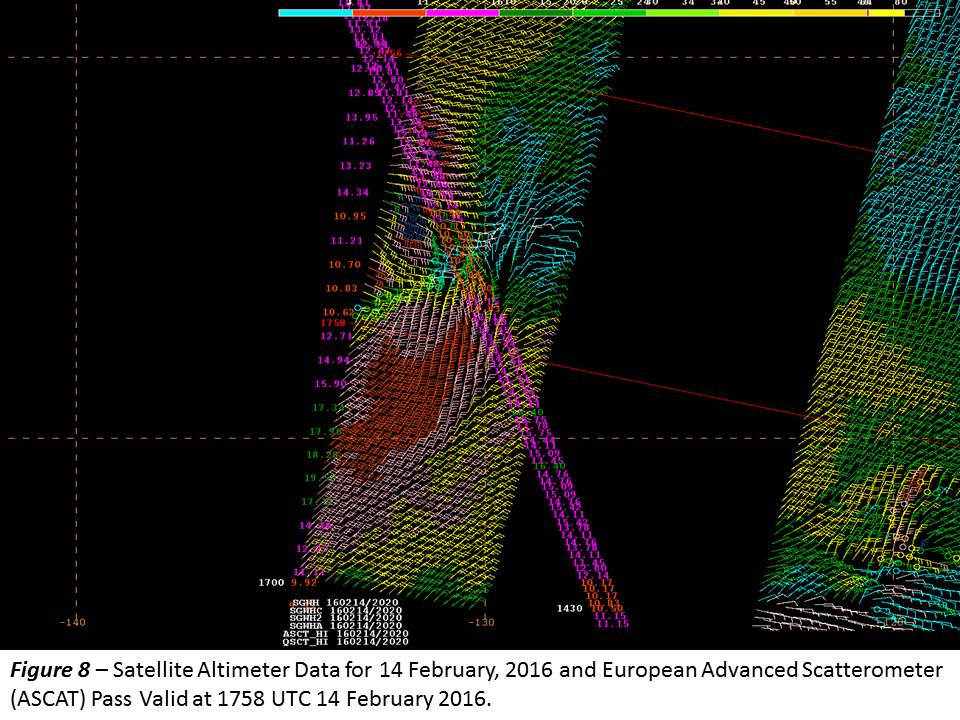
A broad upper level low over the tropical eastern Pacific began to translate to the surface in the form of a surface trough on February 1 near 06N132W to 14N128W. Intensifying high pressure to the north of the trough tightened the pressure gradient on both sides of trough. This gradient supported a broad area of winds to 30 kts, locally to gale force of 40 kts, beginning 0430 UTC February 14, 2016 and persisting for 36 hours. (Figure 7) A large area of cloud cover imagery produced by the combination of the upper level trough and surface trough over the region was evident in visible satellite imagery. (Figure 8) An area of 25 kts to 35 kts winds are verified from 08N to 19N between 128W and 136W around the surface trough. Combined seas to 18 ft were occurring at the end of a long fetch of winds nearing gale force.
The trough would remain quasistationary through February 15. However, with the high to the north of the area weakening, the pressure gradient loosened and winds diminished below galeforce.
Back to top