Marine Weather Review - North Atlantic Area
September to December 2015
George P. Bancroft
Ocean Forecast Branch, Ocean Prediction Center, College Park,
MD
NOAA National Center for Environmental Prediction
Introduction
The fall to early winter period of September to December 2015 featured mainly a progressive pattern of developing cyclones moving from southwest to northeast across the North Atlantic toward Greenland and Iceland, with some of cyclones less frequently taking a more northerly track toward the Davis Strait then weakening and reforming to the east of Greenland, or a more southern track over the central North Atlantic waters toward Europe. There was an uneven trend toward the usual increase in the number of hurricane force lows as the season progressed toward early winter. September featured one such event toward the end of the month, in the far northern waters northwest of Iceland. There were five hurricane force lows in October and ten in December, but November brought only one such system of non-tropical origin. Otherwise the trend supported the seasonal increase in numbers of hurricane force lows found in a study done in 2005 based on QuikSCAT winds (VonAhn and Sienkiewicz, 2005). The most intense cyclones occurred in December, with four developing central pressures below 950 hPa in the northern waters including the deepest at 928 hPa at t he end of the month.
The four month period includes the last half of the hurricane season in the Atlantic basin. It was a continuation of less active than normal season, influenced by a strong El Nino pattern. Of the six named systems occurring during this period, three moved north or northeastward into OPC's area of responsibility and included two hurricanes. One of these, Joaquin, was the strongest and was a major hurricane south of the area near the Bahamas. There was one named cyclone in November, compared to the previous season which had none. All became post tropical (or extratropical) as they gained latitude and entered the mid-latitude westerlies. Additional information on tropical cyclones may be found in Reference 5 (Tropical Cyclone Reports).
Tropical Activity
Tropical Storm Henri: Henri was a short lived tropical storm over the southwestern waters early in September, drifting northeast and crossing 31N into OPC's marine area near 61W as a tropical storm on the afternoon of September 9 with maximum sustained winds of 45 kt. Henri then accelerated northward the following night and on the 10th, passing near 36N 60W at 0600 UTC on the 11th before dissipating as a trough the following day.
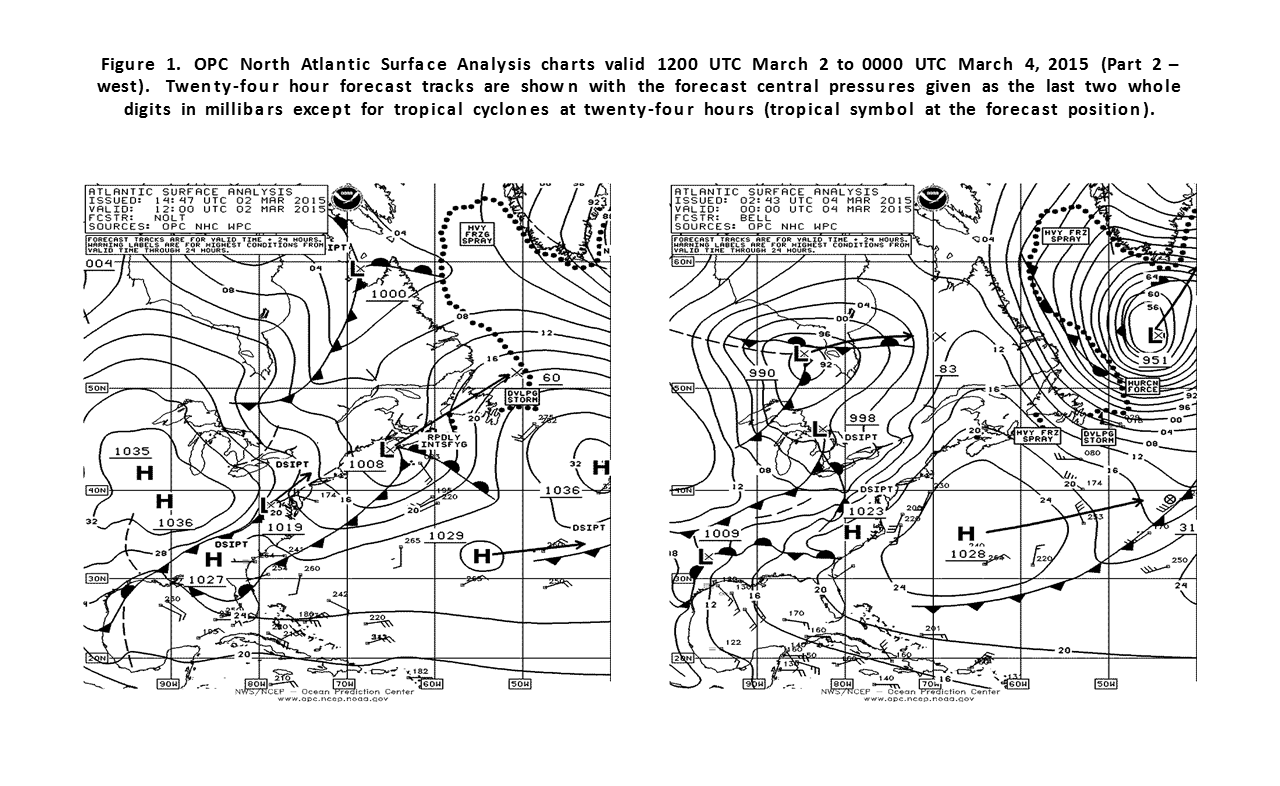
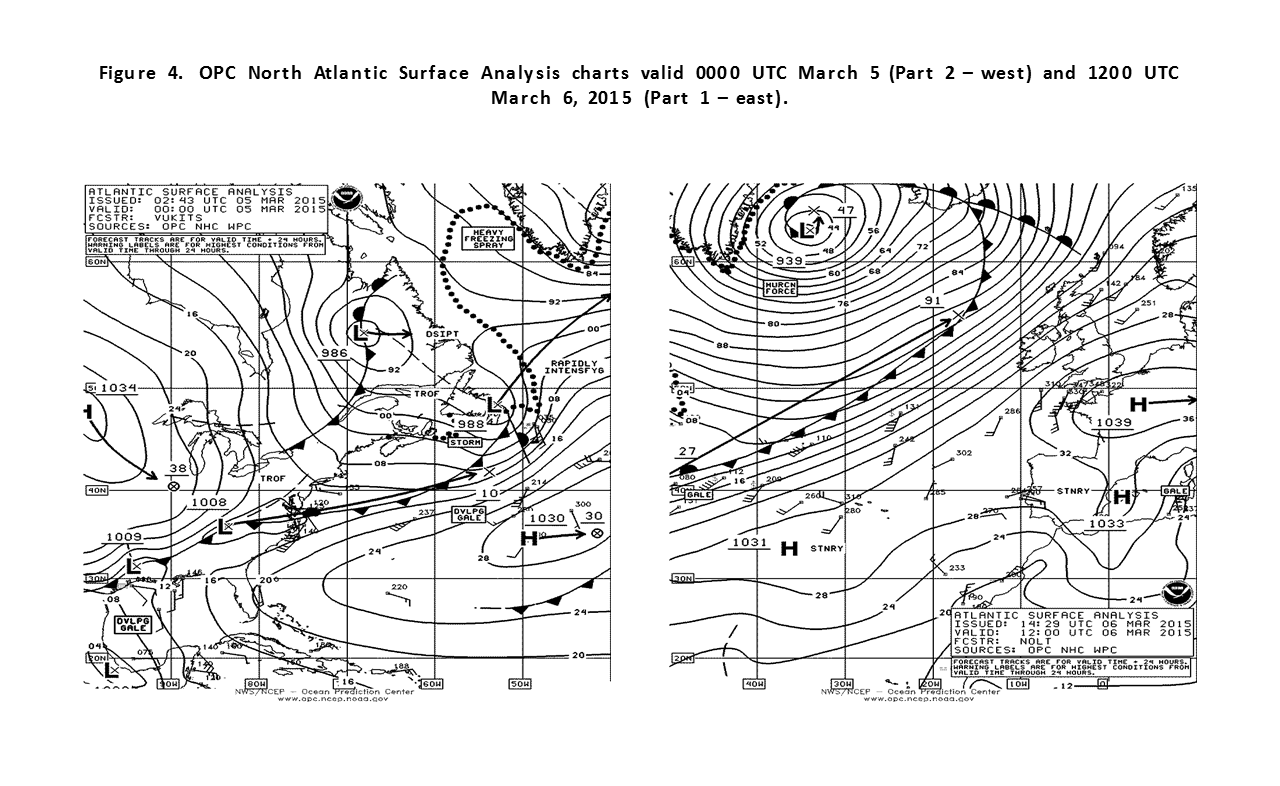
Hurricane Joaquin: After attaining major hurricane status near the Bahamas by October 3, a weakening Hurricane Joaquin accelerated northeast into OPC's marine area of responsibility with 85 kt sustained winds at 1800 UTC on the 4th and passed 60 nm northwest of Bermuda six hours later. Joaquin then maintained 75 kt sustained winds the following night and through the morning of the 6th before weakening further and becoming a tropical storm near 41N 44W at 1800 UTC on the 7th with 60 kt sustained winds. As the hurricane passed to the north, the Independent Pursuit (A8MB5) near 35N 60W reported southwest winds of 40 kt at 1200 UTC on the 6th. Figure 1 depicts Joaquin transitioning to a post tropical storm force low over the twelve hour period ending at 0600 UTC on the 6th. Post Tropical Joaquin then passed near 43N 24W at 0000 UTC on the 9th. Two hours later the Norwegian Star (C6FR3) encountered southeast winds of 60 kt and 7.0 meter seas (23 feet) near 41N 19W. The cyclone then moved east and then southeast over the following two days and weakened to a gale on the 9th, passed briefly inland over Portugal on the 12th and then turned toward the south and dissipated south of Portugal late on the 14th.
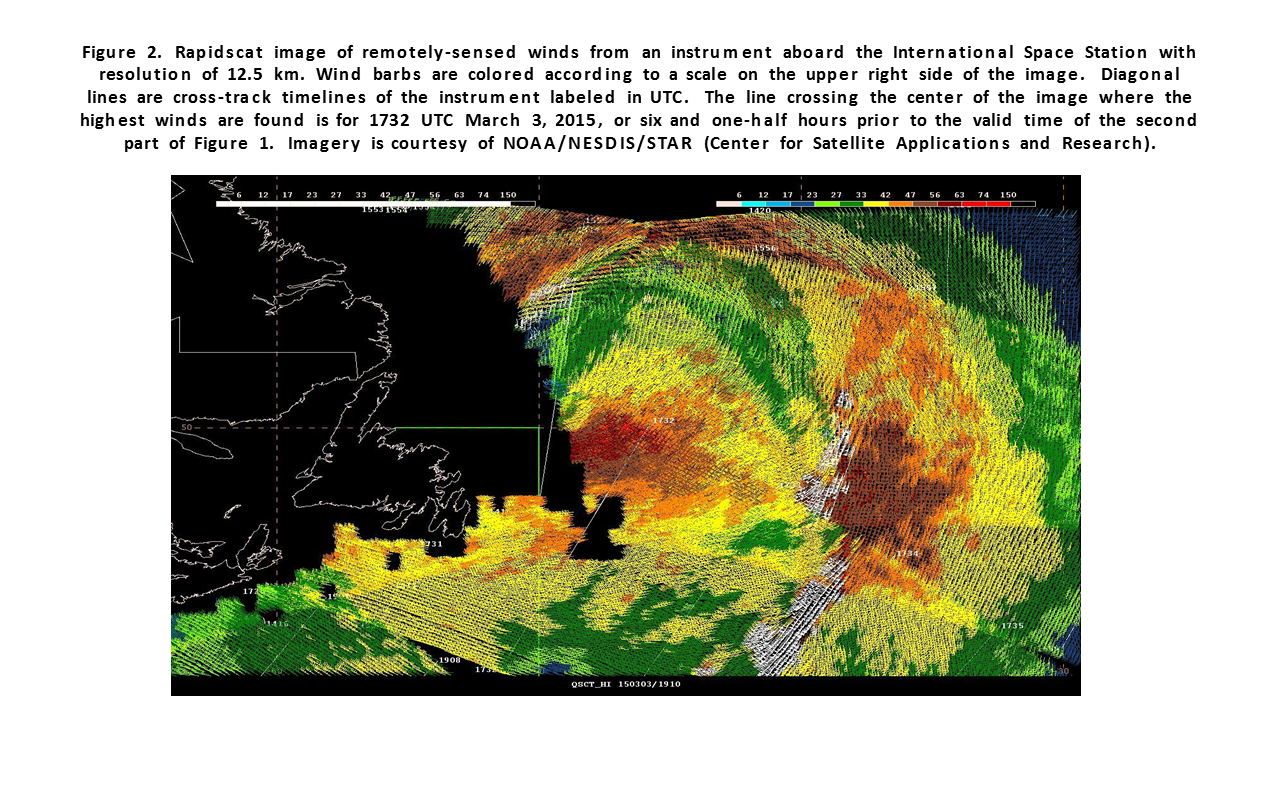
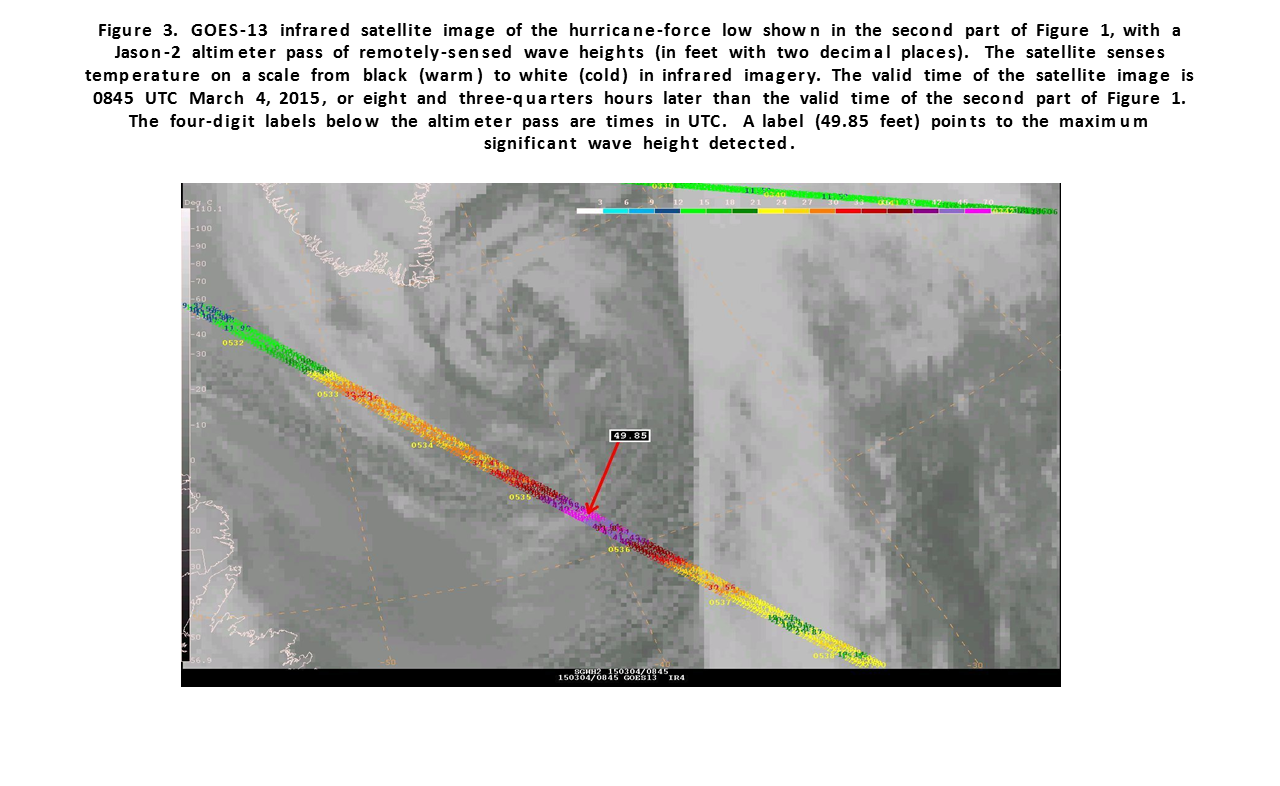
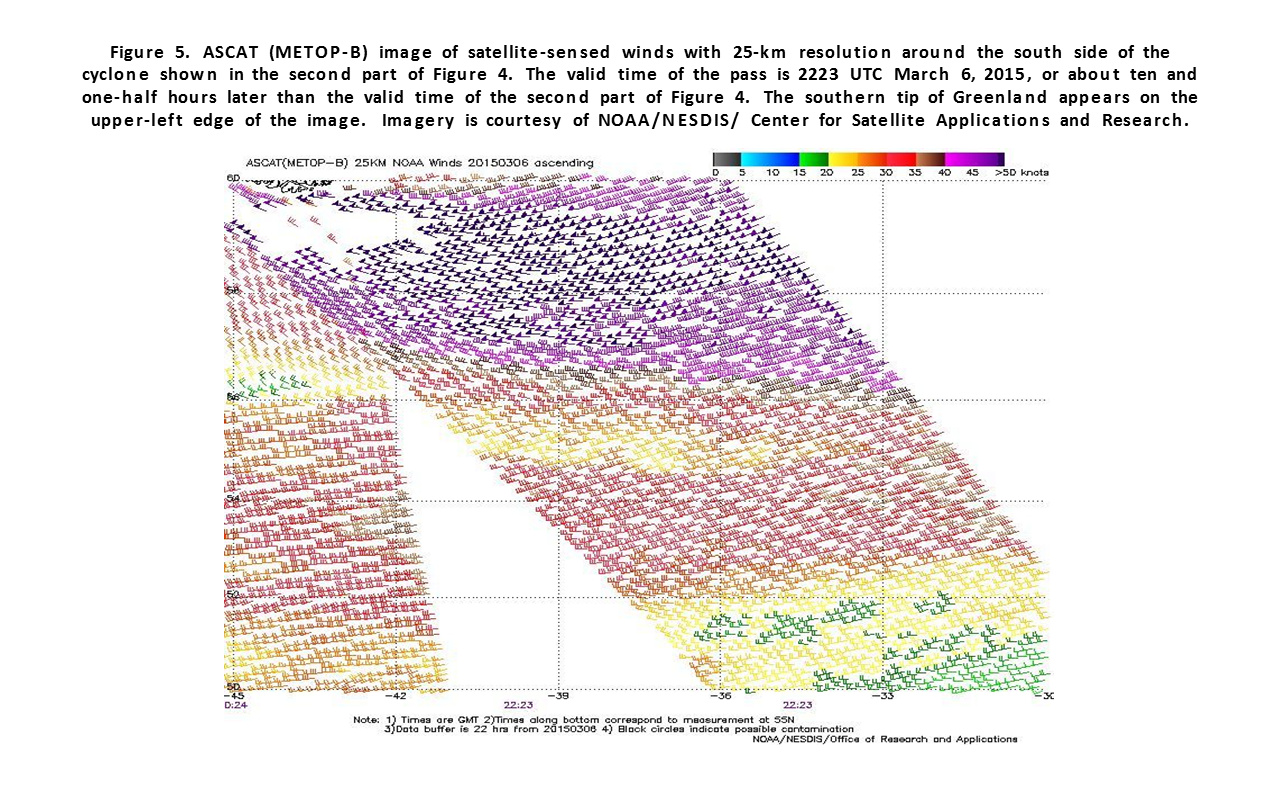
Hurricane Kate: Tropical Depression 12 formed near 23N 74W on the night of November 8 and moved north, became Tropical Storm Kate the following day and then crossed 31N as a strong tropical storm with sustained winds of 60 kt; at 1800 UTC on the 10th. Kate then became a 65 kt hurricane near 33N 71W six hours later while turning toward the northeast. The maximum intensity was 75 kt, reached 12 hours later. The Bremen Express (DGZL) near 34N 57W reported southwest winds of 35 kt and 11.3 meter seas (37 feet) at 1800 UTC on the 11th. Kate then weakened to a tropical storm on the 11th. Figure 2 and Figure 3 shows Kate developing frontal structure and becoming fully extratropical in the 24 hour period ending at 0000 UTC on the 13th. Figure 4 is an ASCAT image of the post tropical low with hybrid wind structure still showing a core of stronger winds of 50 kt close to the center. The extratropical Kate subsequently moved east through the 13th and then became absorbed by a larger low to the north by the 14th; resulting to a large gale to the north early on the 17th.
Other Significant Events of the Period
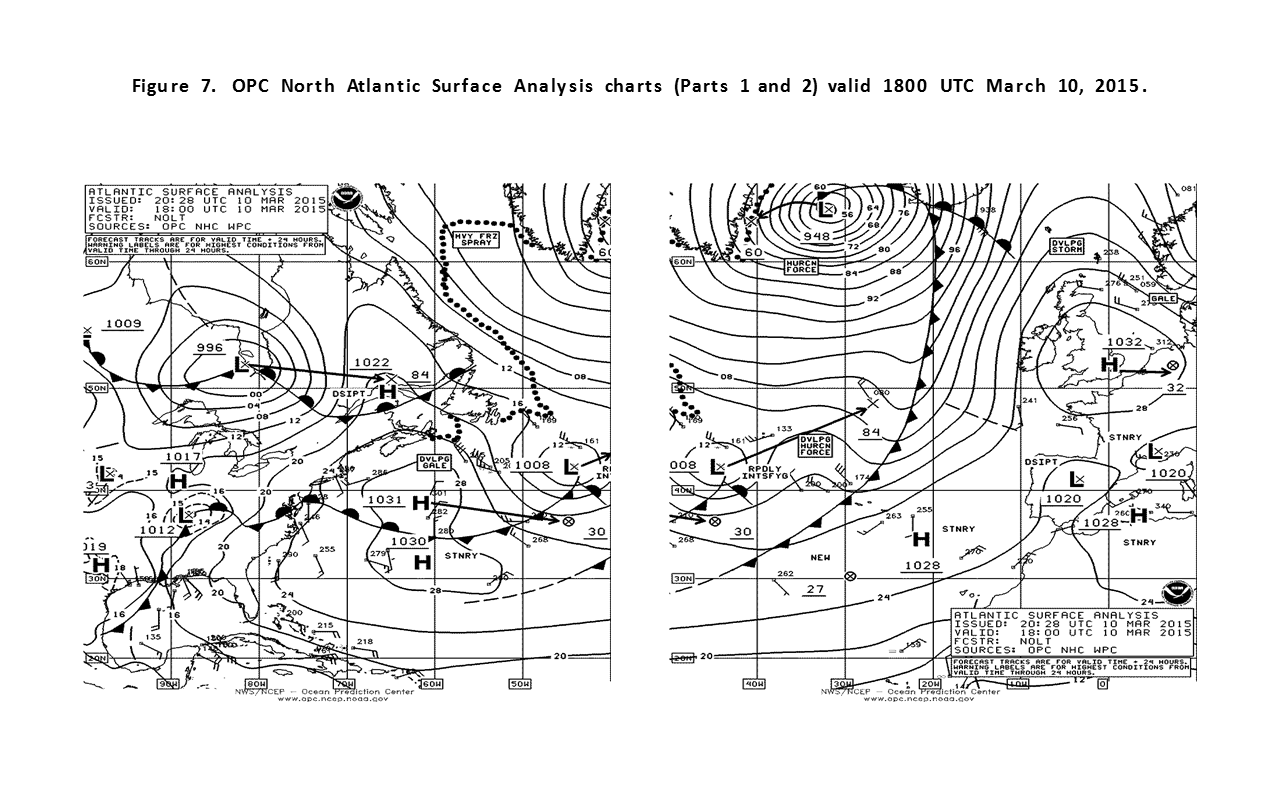
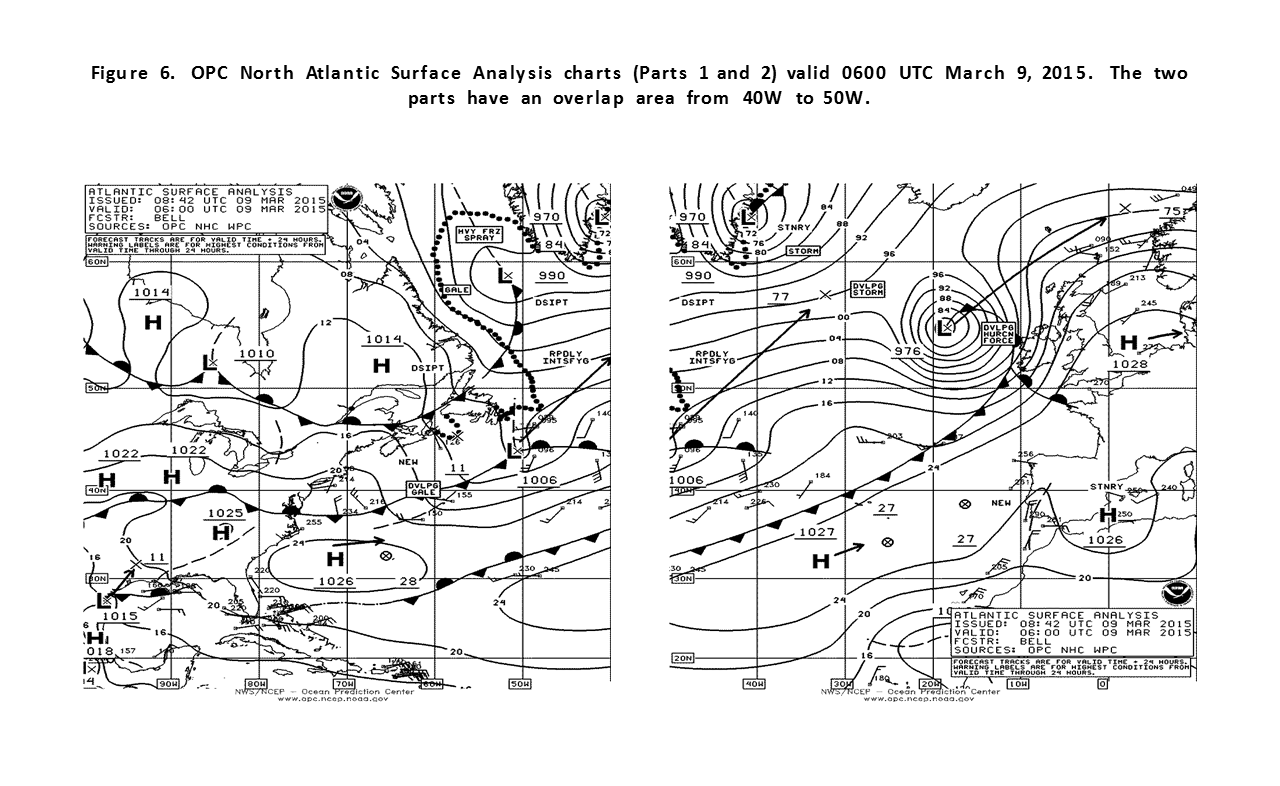
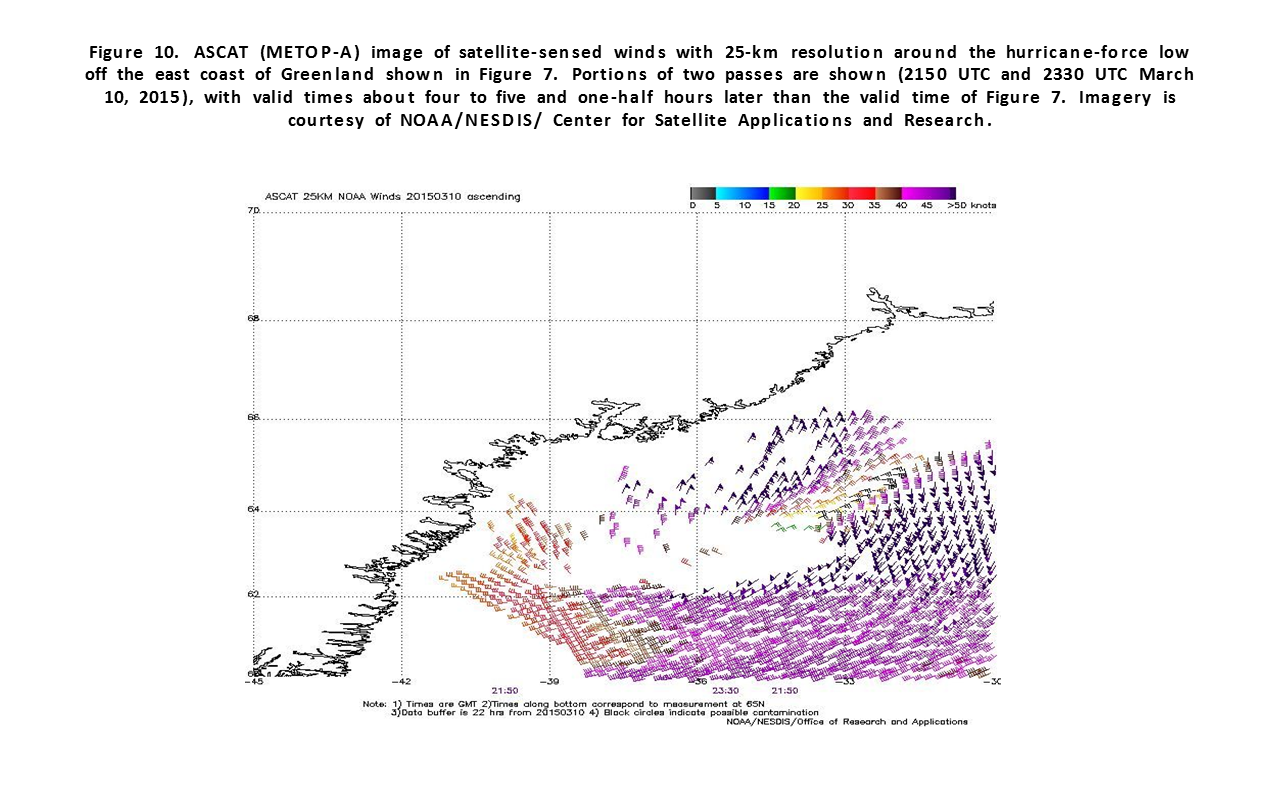
North Atlantic Storms, September 5-10: A series of strong lows developed and moved through the northern waters early in September, developing similar intensities with central pressures of 975 to 980 hPa. An initial developing low dropped southeast out of the Davis Strait on the 4th and 5th, developed storm force winds with a 980 hPa central pressure in the Labrador Sea on the night of the 5th, then turned east and then north on the 6th before dissipating near the east Greenland coast on the 7th. The Maria S. Merian (DBBT) near 53N 55W reported northwest winds of 50 kt at 0600 UTC on the 6th. Anther developing low originating over the south central waters early on the 6th moved northeast and then north and became a storm near 46N 28W on the afternoon of the 7th. It developed a lowest central pressure of 978 hPa near 54N 25W at 1200 UTC on the 8th. The ASCAT image in Figure 7 reveals gale force winds and even some 50 kt wind retrievals on the east side near that time. The first part of Figure 6 shows the cyclone six hours later near 57N 25W turning northwest toward Greenland, where it weakened the following day. A third developing storm, moving east of Newfoundland on the 7th, turned toward the northeast and then north as depicted in Figure 6, developing a lowest central pressure of 975 hPa before weakening northwest of Iceland on the 10th. Its winds were similar to those shown in Figure 7.
North Atlantic/ Greenland Storm, September 16-20: A developing low, originating in the Gulf of Saint Lawrence on September 15th, developing storm force winds as it moved just north of the Grand Banks on the night of the 16th. The platform Terra Nova (VCXF, 46.4N 48.4W) reported northwest winds of 51 kt and 8.5 meter seas (28 feet) at 1200 UTC on the 17th. Hibernia (VEP717, 46.7N 48.7W) at the higher height of 139 m reported northwest winds of 60 kt at that time. A Rapidscat pass from 0706 UTC on the 17th showed winds to 50 kt over the Grand Bank. The cyclone reformed as a new center to the north late on the 17th which moved toward the east Greenland waters and developed a lowest central pressure of 977 hPa near 58N 38W at 0000 UTC on the 19th. The cyclone then turned east along 63N and then southeast and dissipated south of Iceland late on the 21st
North Atlantic Storm, Greenland area, September 25-26: Low pressure originating over the north central waters on the afternoon of September 25 moved north to the east Greenland waters where it briefly developed hurricane force northeast winds north of the center in the Denmark Strait, based on the appearance of ASCAT winds of 50 to 60 kt on the 26th. This was the first hurricane force event of the season. Winds were similar to those of the next event in early October (Figure 9) except a little weaker. The cyclone then looped to the west and then southwest late on the 26th and weakened near the Greenland coast on the 27th.
North Atlantic Storm, Greenland area, October 4-5: While a pair of developing storms dropped southeast from the Davis Strait and southern Labrador Sea, low pressure formed near the east Greenland coast and made a cyclonic loop in the east Greenland waters and intensified to as low as 969 hPa over a 36 hour period (Figure 8). The hurricane force winds with this low were north of the chart area in the Denmark Strait as shown in Figure 9. The ASCAT-B image has several 65 kt wind retrievals. The cyclone then drifted northwest and weakened near the Greenland coast the next day.
Northwestern Atlantic Storm, October 10-12: In this increasingly active pattern, the next developing cyclone moved northeast from the Gulf of Saint Lawrence and developed a lowest central pressure of 960 hPa in the Labrador Sea over a 24 hour period (Figure 10). The central pressure fell 35 hPa in the 24 hour period ending at 0000 UTC on the 11th , well above the “bomb” threshold at 60N (Sanders and Gyakum, 1980). At 0000 UTC on the 11th the platform Hibernia (VEP717, 46.7N 48.7W) reported southwest winds of 50 kt, and twelve hours later seas of 3.5 meters (11 feet). To the north, the Mary Arctica (BATEU00) near 65N 32W encountered east winds of 40 kt. The ASCAT-A pass in Figure 11 returned the strongest winds in the easterly flow between the occluded front and southern Greenland, which given the low bias in ASCAT this may support a marginal hurricane force event. OPC included a hurricane force label for this system on the analysis near this time (Figure 10). A similar pattern of winds occurred in a December event but with a deeper low and stronger winds, to be covered below. The cyclone then reformed east of Greenland with a weakening trend late on the 11th and the system then weakened in the Denmark Strait on the 13th.
North Atlantic Storm, October 19-22: The development of the first in a series of systems moving northeast and developing hurricane force winds over the northern waters is depicted in Figure 12, covering a 24 hour period in which the central pressure fell 30 hPa, leading to a maximum intensity of 970 hPa. It originated as a low pressure wave south of Nova Scotia near 35N early on the 18th. The Atlantic Compass (SKUN) near 50N 37W reported west winds of 60 kt and 11.9 meter seas (39 feet) at 0000 UTC on the 21st. The Maersk Newcastle (A8DM9) near 46N 47W encountered northwest winds of 45 kt and 7.9 meter seas (26 feet) 12 hours earlier. Buoy 62105 (55.2N 12.7W) reported highest seas of 11.0 meters (36 feet) at 0100 UTC on the 22nd. The ASCAT image in Figure 13 returned a swath of winds 50 to 65 kt in the southwest semicircle of the low. The cyclone then moved northeast with a weakening trend, passing east of Iceland by the 22nd.
North Atlantic Storm, October 24-26: The second in a series of late October cyclones originated over the Canadian Maritime Provinces on October 23rd and moved east over the north central Atlantic waters, where it developed hurricane force winds on the night of the 24th and on the 25th, with the system developing a lowest central pressure of 968 hPa near 51N 23W at 1800 UTC on the 25th. The Maersk Teal (S6HK) near 50N 20W reported northwest winds of 60 kt at 1100 UTC on the 25th. The ship BATFR56 near 45N 29W encountered northwest winds of 50 kt three hours later. The Atlantic Cartier (SCKB) near 56N 26W reported north winds of 58 kt and 13.4 meter seas (44 feet) at 1800 UTC on the 26th. An ASCAT pass from 1257 UTC on the 25th returned winds 50 to 60 kt on the southwest and west sides of the low center, similar to Figure 13 for the preceding event. The cyclone subsequently weakened while tracking slowly east and then southeast toward Europe, and dissipated by the 28th.
North Atlantic Storm, October 27-30: A third late October storm originated as a low pressure wave south of Newfoundland near 40N late on the 25th and moved northeast, developing a central pressure of 960 hPa near 54N 23W at 1800 UTC on the 28th. Hurricane force winds occurred on the 28th and early on the 29th, with an ASCAT pass from 2143 UTC on the 28th returning a swath of west to northwest winds 50 to 55 kt south and southwest of the center, similar to the November event described below. The lowest central pressure of 957 hPa occurred near 59N 29W at 1800 UTC on the 29th as the system turned toward the northwest, with top winds down to storm force. Weakening followed, as the cyclone stalled and dissipated southwest of Iceland on the 31st.
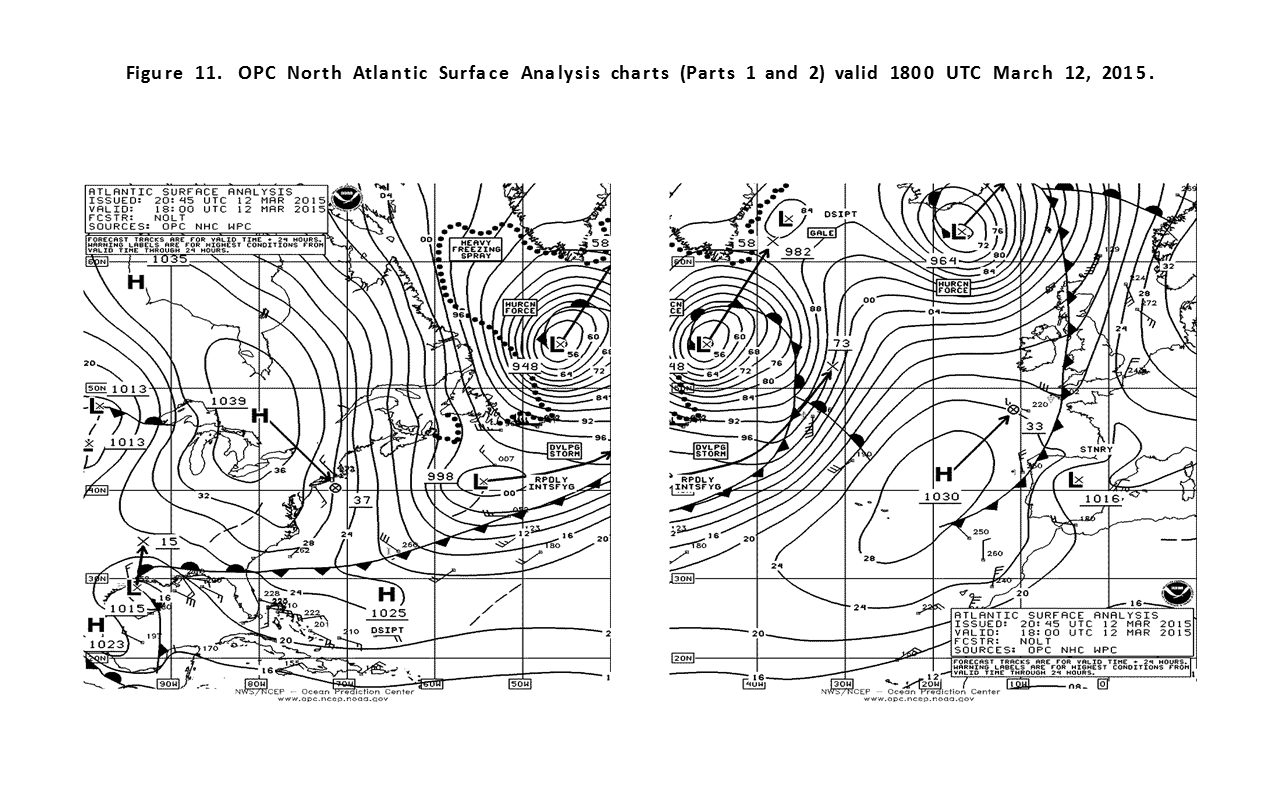
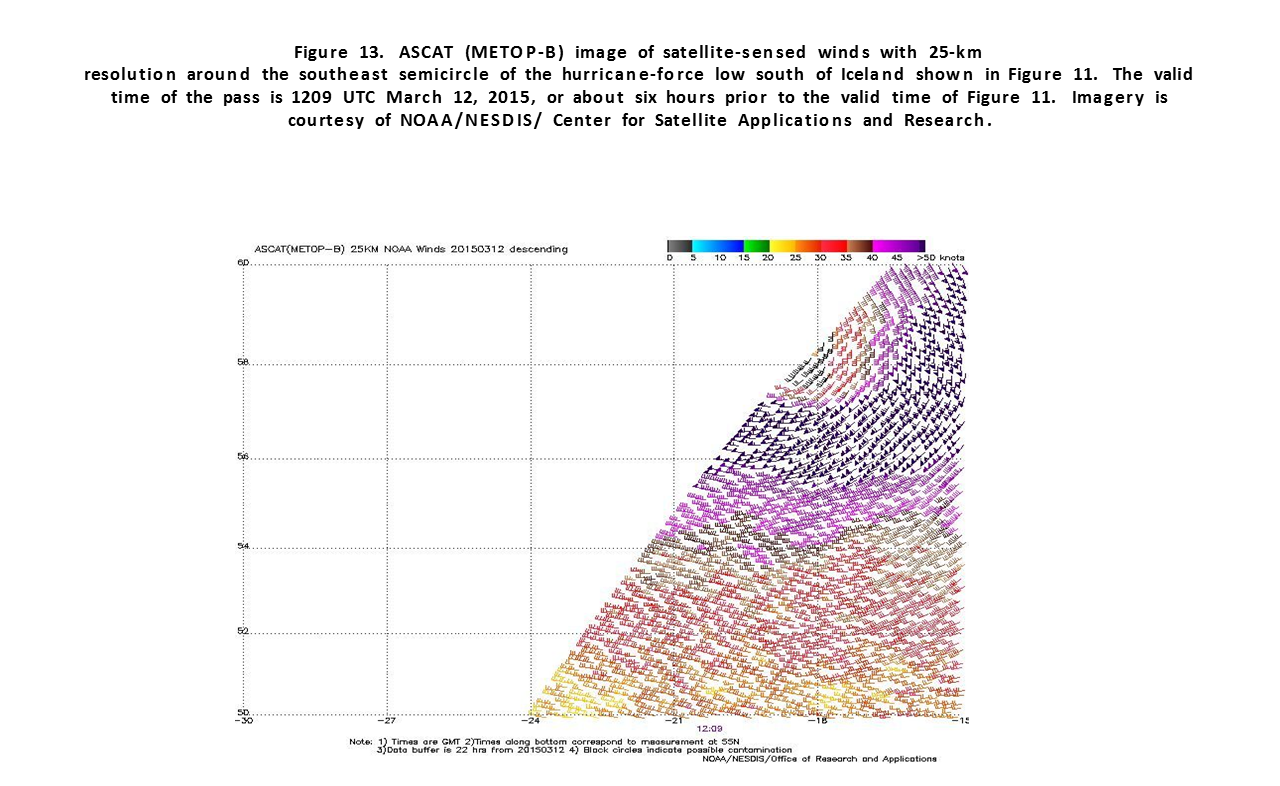
Northeast Atlantic Storm, November 11-13: Concurrent with the passage of Kate as a tropical cyclone and extratropical storm and referring back to Figure 2 and Figure 3, a non-tropical cyclone rapidly intensified while passing west and then north of the British Isles, with the central pressure falling 24 hPa during this 24 hour period. Figure 3 shows the cyclone at maximum intensity. Figure 5 is an ASCAT-B image showing a swath of west to northwest winds of 50 to 60 kt south and southwest of the cyclone’s center. The Walther Herwig III (DBFR) reported west winds of 45 kt near 59N 15W at 2300 UTC November 12th. The buoy 64041 (60.7N 2.8W) reported southwest winds of 55 kt at 0600 UTC on the 13th and a highest wave height of 10.4 meters (34 feet) two hours later. Buoy 62105 (55.2N 12.8W) reported southwest winds of 40 kt with gusts to 62 kt at 1300 UTC on the 12th and highest seas 9.8 meters 32 feet) two hours later. Another buoy, 64045 (59.1N 11.7W), reported seas of 10.7 meters 35 feet) at 0100 UTC on the 13th. The system subsequently weakened while moving northeast into the Norwegian Sea on the 13th.
North Atlantic/ Greenland area, November 30-December 2: A new low formed over the north central waters late on November 29th and moved northeast into the east Greenland waters on the night of the 30th before turning northwest and developing hurricane force winds with a 956 hPa center near 63N 40W at 1200 UTC December 1. The central pressure fell 35 hPa in the preceding 24 hours. An ASCAT (METOP-B) pass from 1425 UTC on the 1st returned a swath of northeast winds 50 to 70 kt north of 64N near the east Greenland coast, similar to Figure 9 for the early October event. The Newfoundland Lynx (VAAZ) near 55N 56W reported northwest winds of 45 kt at 1000 UTC November 30. The system then stalled and weakened near the Greenland coast over the next few days with winds lowering to gale force late on the 2nd.
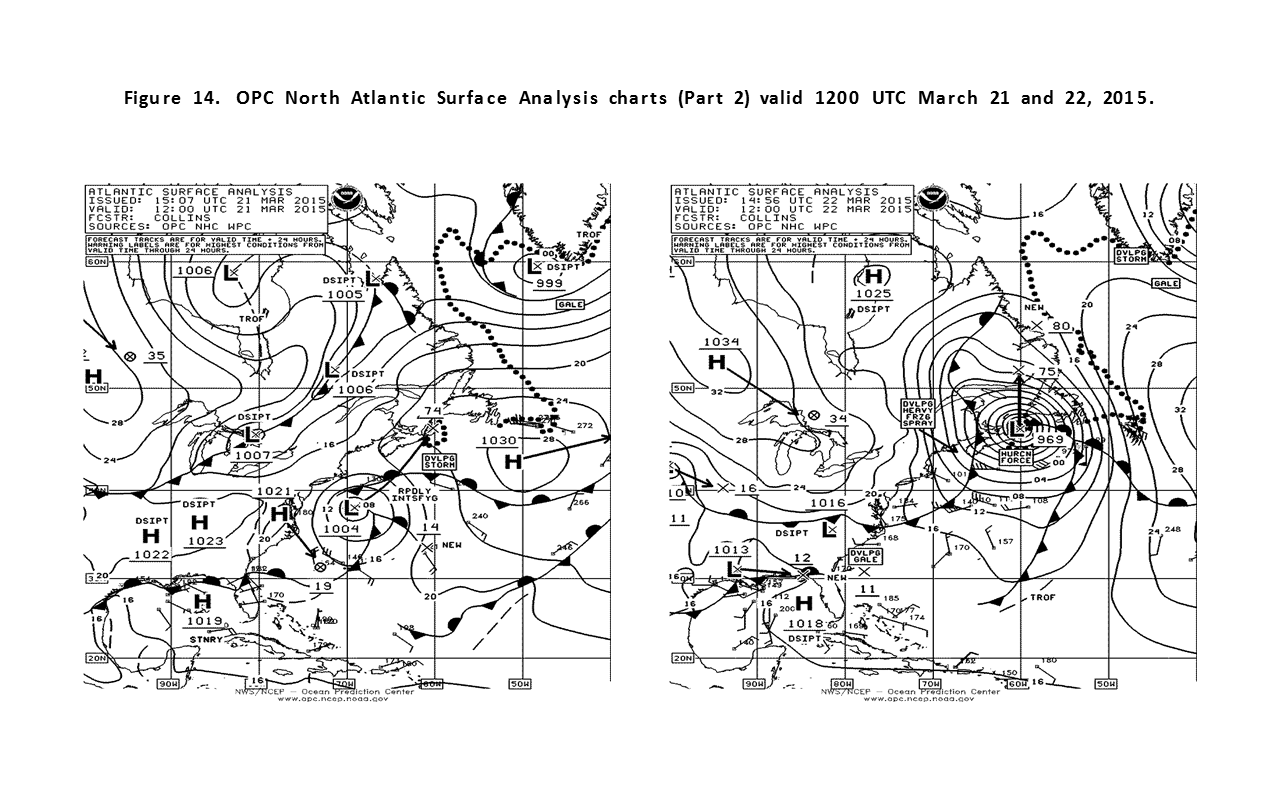
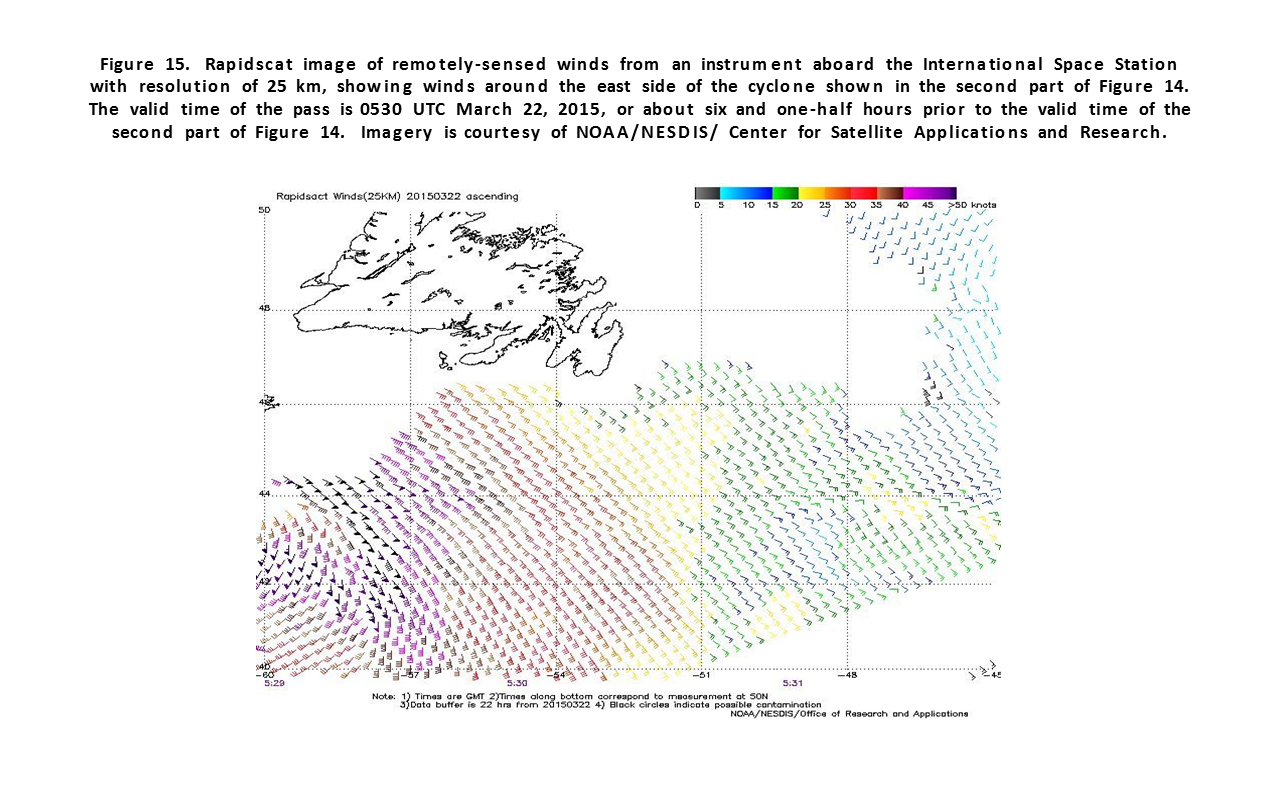
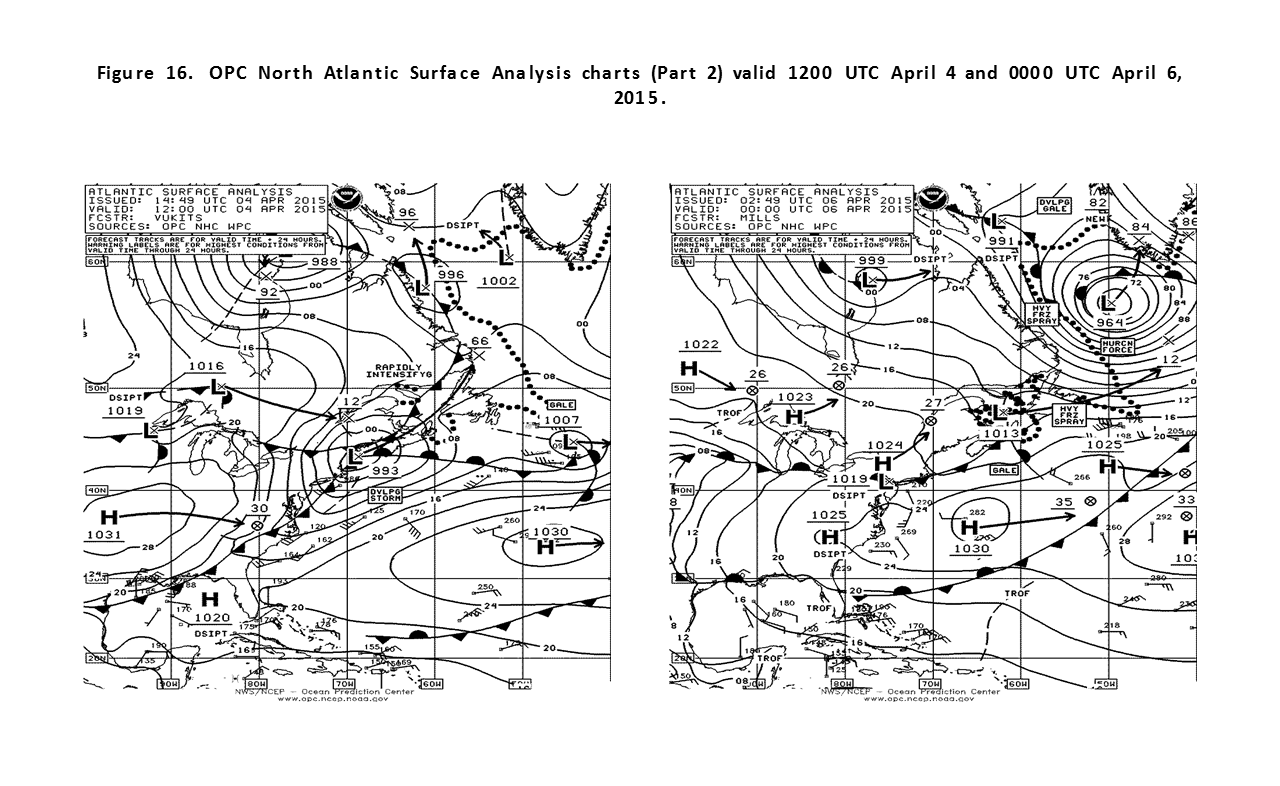
North Atlantic Storms, December 3-9: The development of the second most intense cyclone of the four month period over a 36 hour period is depicted in Figure 14, when the central pressure dropped 57 hPa. It was one of two December cyclones with central pressures below 940 hPa. An ASCAT pass from 2222 UTC on the 4th returned an area of west to southwest winds to 55 kt on the south side when the center was near the south coast of Iceland. A not quite as intense event followed, originating over the south central waters on December 5th and moving north, with Figure 15 showing the final 36 hours of development. The central pressure fell 39 hPa in the 24 hour period ending at 1200 UTC on the 7th. The ASCAT-B image in Figure 16 revealed a stronger wind pattern than in the previous event, with more widespread winds of 50 kt or more and some 70 kt winds in the easterly flow north of the center. The Maersk Palermo (PDHW) reported west winds of 45 kt near 45N 15W at 0600 UTC on the 7th. Buoy 62105 (55.1N 13.3W) reported southwest winds of 40 kt with gusts to 55 kt and 7.0 meter seas (23 feet) at 1000 UTC on the 9th and highest seas 7.9 meters (26 feet) two hours later. The cyclone then turned northwestward and weakened, and made a cyclonic loop in the east Greenland waters before dissipating on the 10th. A weaker event occurred at the same time over the southwest waters, originating near the North Carolina coast on the 7th and then tracking northeast to 41N 58W with a lowest pressure of 990 hPa at 1200 UTC on the 9th , when it briefly developed hurricane force winds. It then moved east along 41N through the 11th before turning northeast and becoming absorbed west of Ireland on the 15th. The ship ZDKY3 (40N 58W) reported northwest winds of 45 kt and 8.2 meter seas (27 feet).
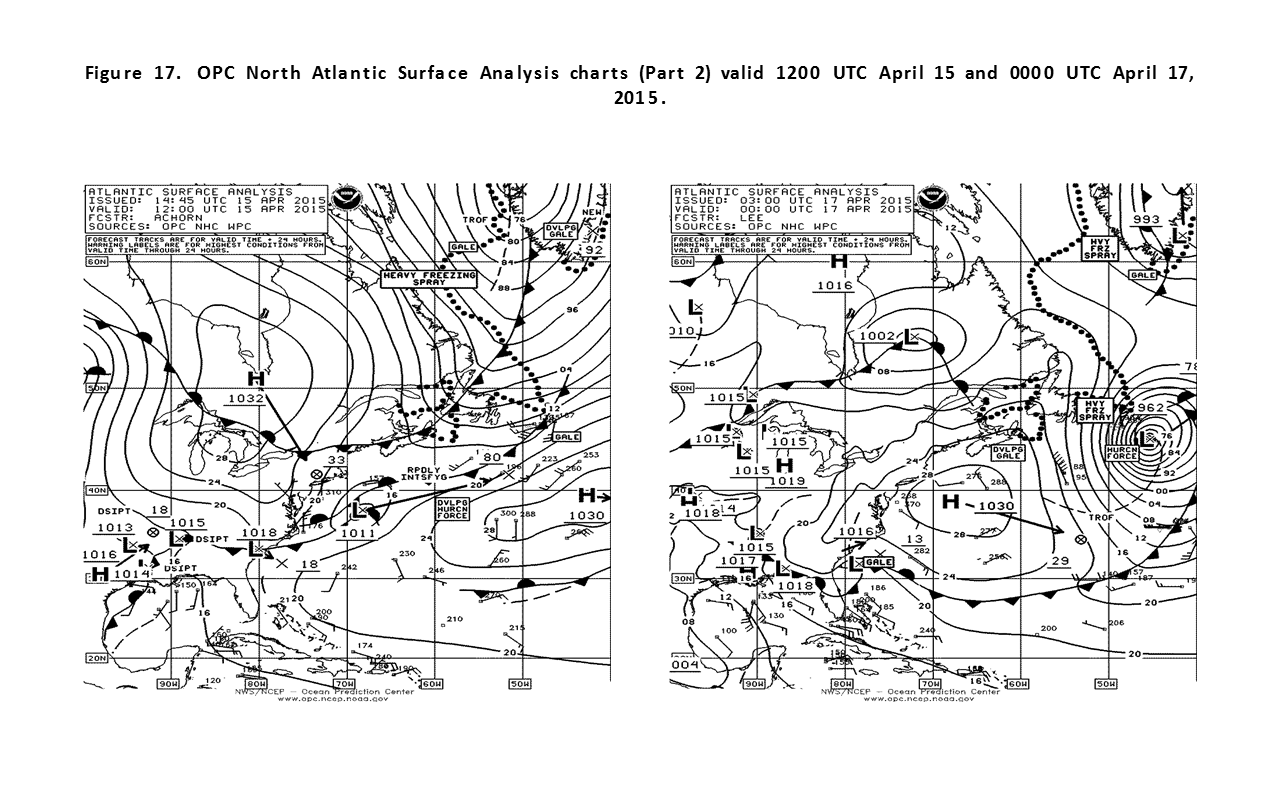
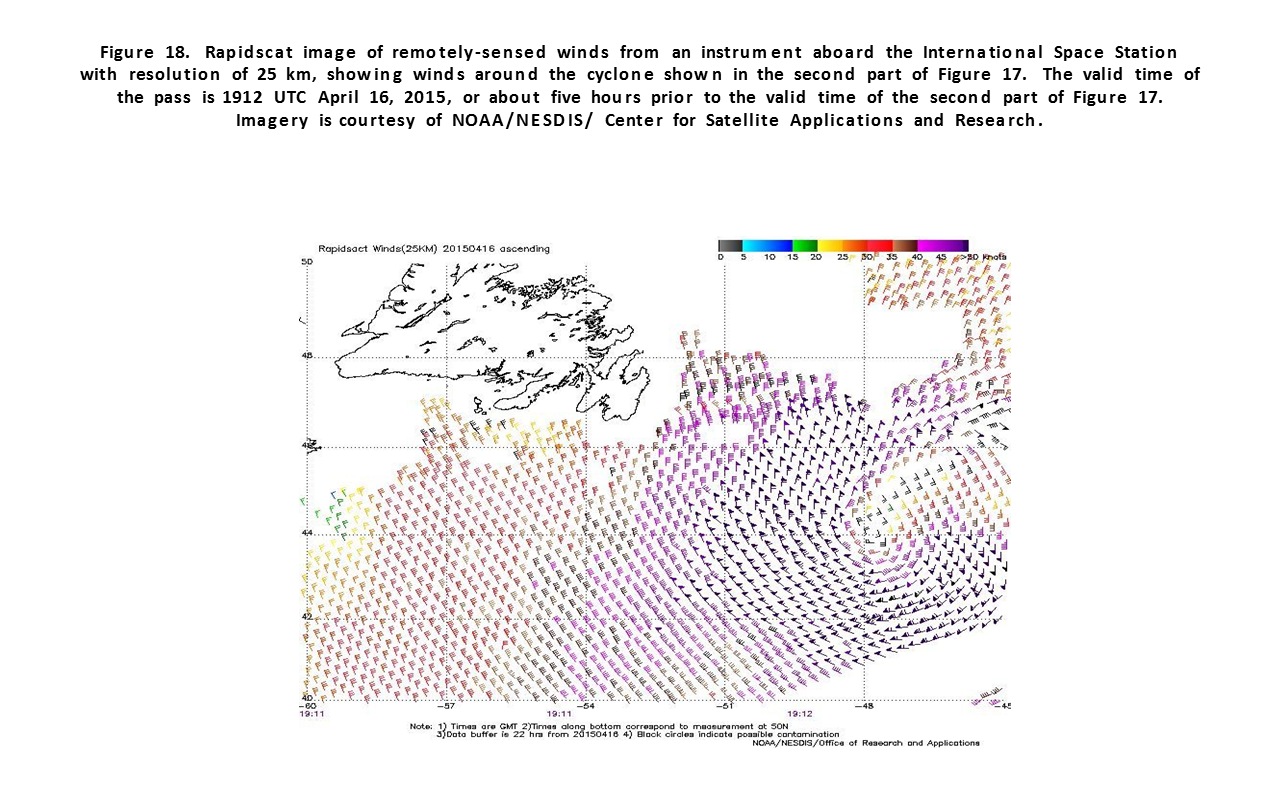
North Atlantic Storm, December 15-19: A low pressure system moved east from New England on the 15th and developed storm force winds south of Nova Scotia later that day and then hurricane force winds out over the central North Atlantic on the 17th (Figure 17), before turning toward the northeast with a weakening trend. The second part of Figure 17 shows the cyclone at maximum intensity. Figure 18 is a 12.5 km resolution Rapidscat image of winds around the cyclone near maximum intensity, with numerous hurricane force wind retrievals on the south side of the circulation. Figure 19 showing remotely sensed wave heights from radar altimeters aboard the Jason 2 and AltiKa satellites. Note the 45 foot (13.7 meters) observation in the swath cutting through the south side of the analyzed low center. The platform Hibernia (VEP717, 46.7N 48.7W) reported north winds of 60 kt at 1200 UTC on the 17th. 12 hours later the Nrp Viana Do Castelo (CTPA) near 38N 25W reported south winds of 50 kt.
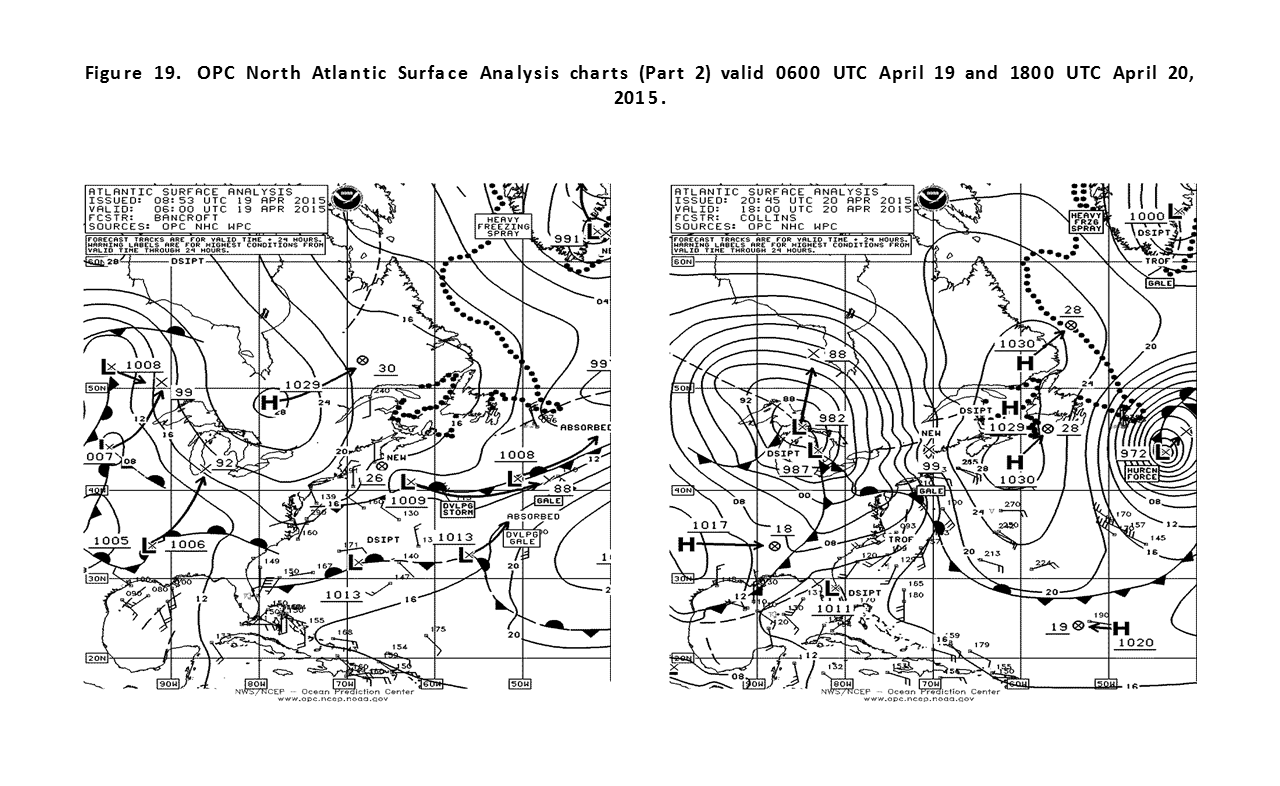
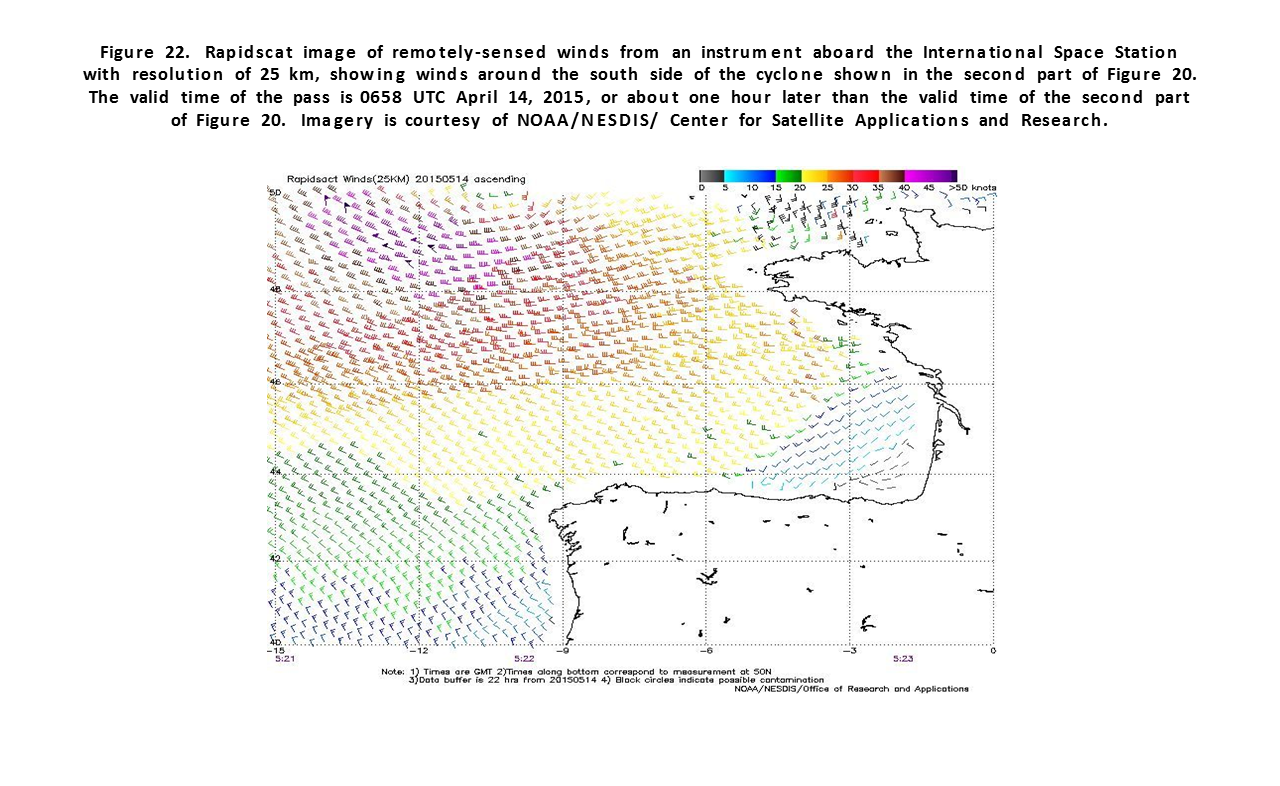
North Atlantic Storm, December 19-22: This intense system in the northwestern Atlantic (Figure 20) developed from the consolidation and rapid intensification of the low pressure complex over the south of the Canadian Maritime Provinces over a 36 hour period. The central pressure fell 44 hPa in the 24 hour period ending at 0600 UTC on the 20th, almost twice the “bomb” rate at 60N. The ASCAT-B image in Figure 21 has some similarity to Figure 11 for the October 10-12 event, except with more coverage of 50-55 kt winds, especially on the south side of the cyclone. The platform Hibernia (46.7N 48.7W) reported northwest winds of 52 kt at 1200 UTC on the 21st, and highest seas of 6.4 meters (21 feet) three hours later. The cyclone subsequently moved east and slowly weakened through the 21st before degenerating into a trough by the 22nd.
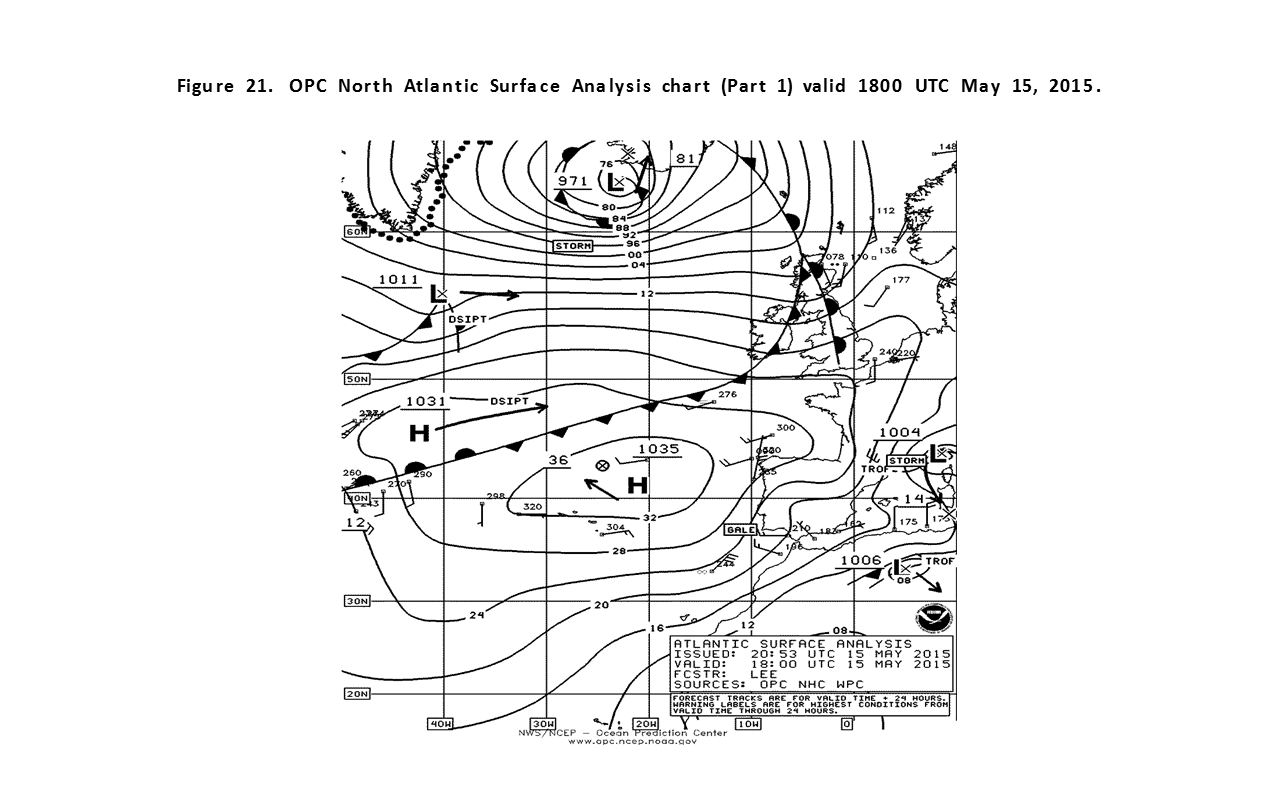
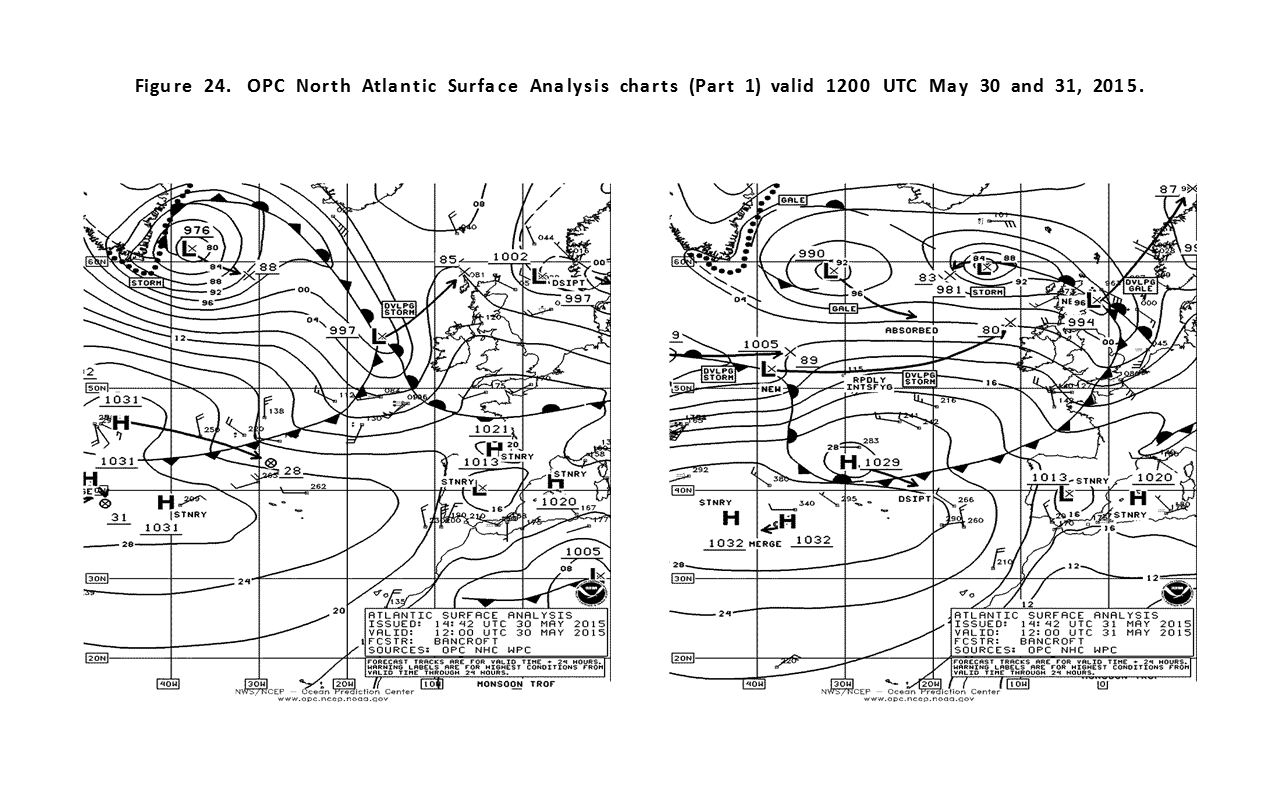
Northwest Atlantic/ Greenland Storms, December 24-30: Late December was very active in the northern waters, starting with development of a strong low in the Davis Strait on December 25th which developed hurricane force southeast winds between the occluded front and the southwest Greenland coast (Figure 22). Figure 23 with partial ASCAT coverage reveals this enhanced southeast flow. The system weakened in the Davis Strait while forming a new center near the southern tip of Greenland, with the new low taking over and developing hurricane force winds with a 955 hPa center on the 27th (Figure 22). This low then lingered in the east Greenland waters to the end of the month while briefly redeveloping hurricane force winds on the 30th (Figure 24) before weakening on the 31st. An ASCAT-B pass from 2238 UTC on the 30th revealed a swath of west to northwest winds50 to 55 kt extending from the southern tip of Greenland.
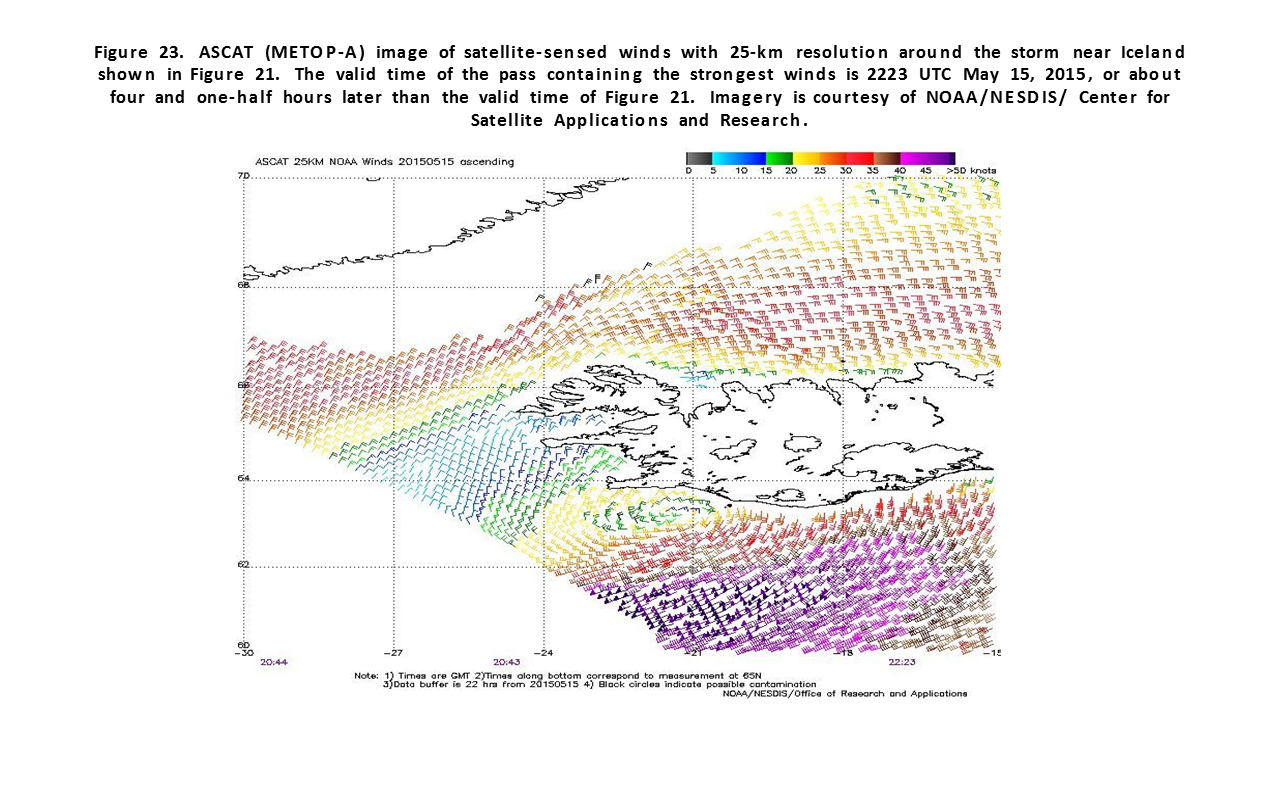
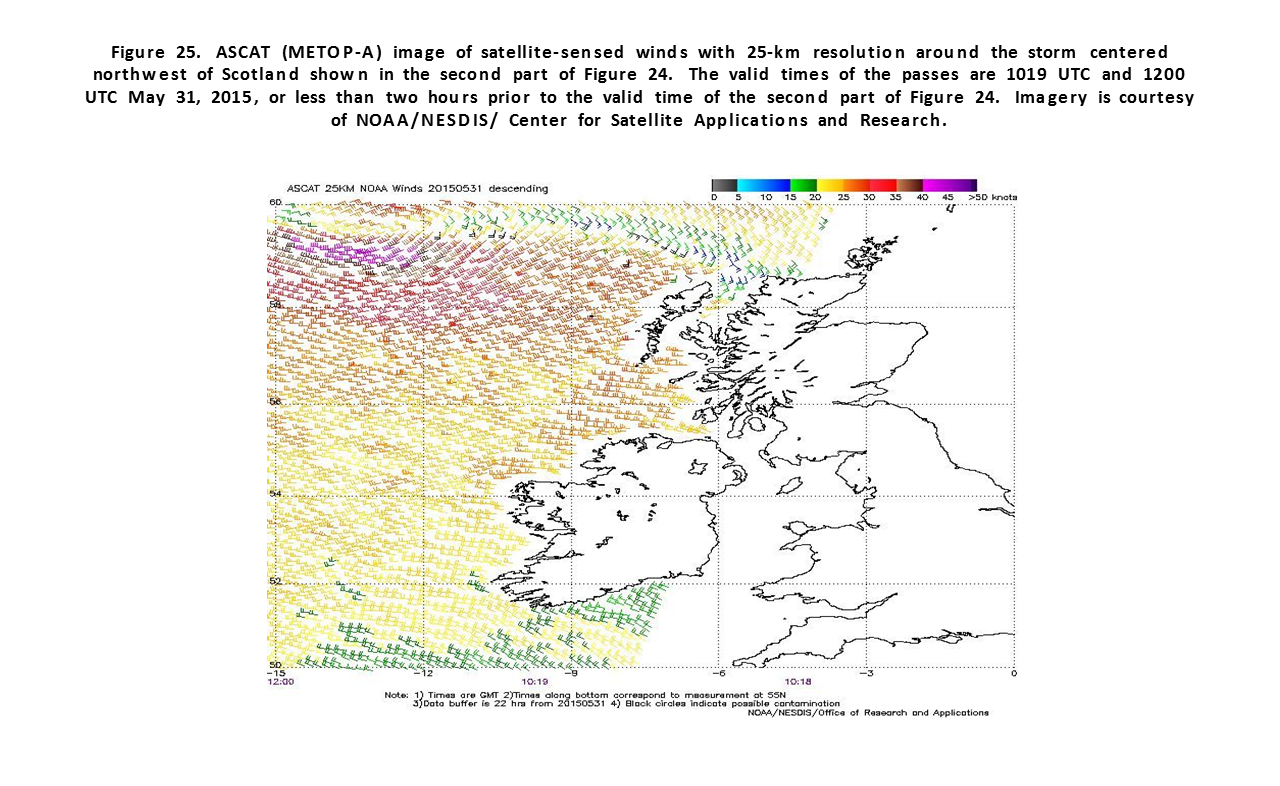
Northeast Atlantic Storms, December 13-15: Figure 24 depicts the development of the strongest low of the period in the North Atlantic with a 928 hPa (27.40 inches) over Iceland, from the dominant low center west of the British Isles over a 24 hour period. The central pressure dropped 42 hPa in the 24 hour period ending at 0000 UTC on the 30th. Actually both lows in the first part of Figure 24 developed hurricane force winds six hours later before the trailing low weakened as Figure 24 indicates. A British reference to the intense 928 hPa low is included in Reference 8. The ASCAT image in Figure 25 depicts winds around the dominant low west of the British Isles about six hours later than the valid time of the first part of Figure 24, and shows good support for hurricane force status. At 0600 UTC on the 29th the MSC Xian (A8KY2) near 50N 21W reported southeast winds of 65 kt. The Independent Voyager (A8XY2) encountered west winds of 60 kt three hours later. Buoy 64045 (59.1N 11.7W) reported highest seas of 12.5 meters (41 feet) at 2300 UTC on the 29th. The intense low then passed north of Iceland later that day.
References
1. Sanders, Frederick and Gyakum, John R., Synoptic-Dynamic Climatology of the "Bomb", Monthly Weather Review, October 1980.
2. Ocean Surface Winds, http://manati.star.nesdis.noaa.gov/products.php
3. VonAhn, Joan. and Sienkiewicz, Joe, "Hurricane Force Extratropical Cyclones Observed Using QuikSCAT Near Real Time Winds", Mariners Weather Log, Vol. 49, No. 1, April 2005.
4. Saffir-Simpson Scale of Hurricane Intensity: http://www.nhc.noaa.gov/aboutsshws.php
5. Tropical Cyclone Reports, 2015, National Hurricane Center, http://www.nhc.noaa.gov/data/tcr/index.php?season=2015&basin=atl
6. Bancroft, George, "Marine Weather Summary, North Pacific Area, September 2014 to February 2015", Mariners Weather Log, December 2015.
7. Sienkiewicz, Joe and Chesneau, Lee, “Mariner’s Guide to the 500-Millibar Chart”, Mariners Weather Log, December 2008.
8. http://www.mashable.com/2015/12/28/Freak-atlantic-storm-uk-Frank/#V5Ew