Mean Circulation Highlights and Climate Anomalies May through August 2015
Anthony Artusa, Meteorologist, Operations Branch, Climate Prediction Center NCEP/NWS/NOAA
All anomalies reflect departures from the 1981-2010 base period.

Material provided in the above map was compiled for NOAAs State of the Climate report. For more information visit: http://www.ndbc.noaa.gove/sotc (Reference 1)
May-June 2015
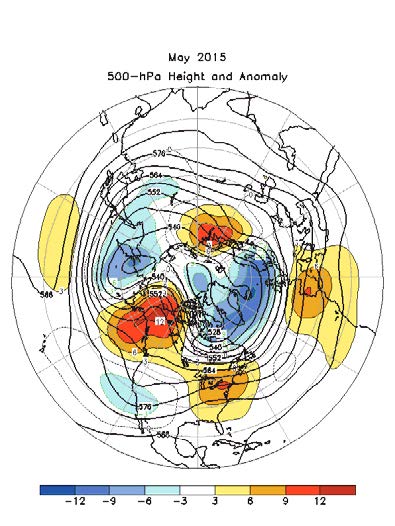
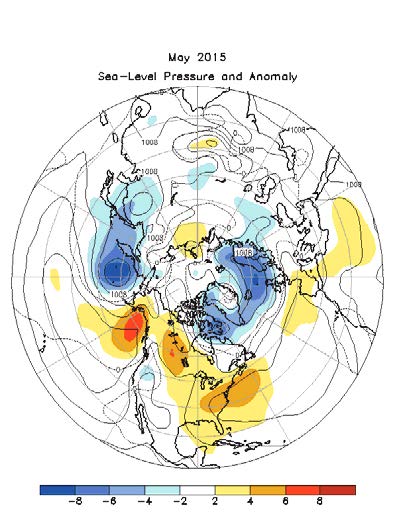
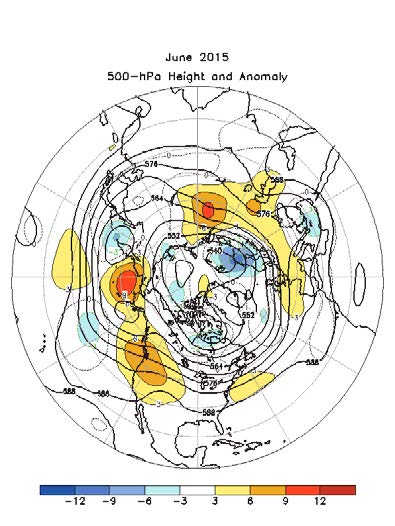
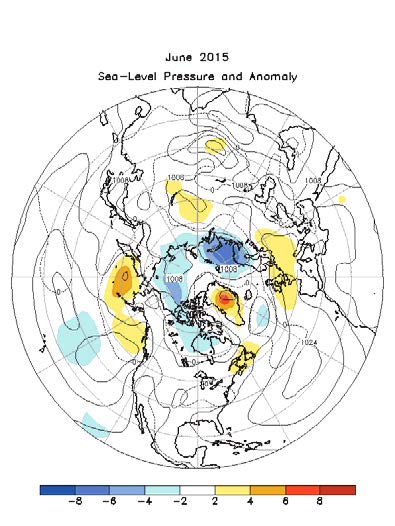
During May, the mid tropospheric height and anomaly pattern featured well above average heights across Alaska, the Gulf of Alaska, and western Canada, in association with an amplified ridge. Above average heights were also observed over the eastern contiguous US, the western Mediterranean region, and northwest Russia. Below average heights characterized the far northern reaches of the Atlantic from Baffin Island, Canada eastward across Greenland and Iceland to Scandinavia. Below average heights were also noted in eastern Siberia, near the North Pole, and the southwestern contiguous US, Figure 1. The Sea Level Pressure (SLP) and Anomaly map for May (Figure 2) roughly mirrored the 500 hPa circulation features. In June, the 500 hPa flow pattern featured above average heights from the Bering Sea southeastward to the US Rockies, and western Russia (Figure 3). The only area with significantly below average heights was Scandinavia. The Sea Level Pressure and Anomaly map for June (Figure 4) shows a very weak, nondescript pattern, with below average SLP for northern Scandinavia and the adjacent arctic coast of northwest Russia.
Arctic sea ice extent was 5.5 percent below the 1981-2010 average in May 2015. This is the third smallest May sea ice extent since satellite records began in 1979. In contrast, Antarctic sea ice extent was 12.1 percent above the 1981- 2010 average, making this the largest May sea ice extent on record (Reference 1).
The Tropics
During May and June, sea surface temperatures (SSTs) were above average across the equatorial Pacific. The monthly Nino 3.4 indices were +1.0C (May) and +1.3C (June). The depth of the oceanic thermocline (measured by the depth of the 20C isotherm) was above average in the eastern equatorial Pacific (May and June), and the east central Pacific (May). Corresponding sub surface temperatures ranged from 1-6C above average during the 2 month period. Low level (850 hPa) westerly wind anomalies and upper level (200 hPa) easterly wind anomalies continued across the equatorial Pacific in May, and the western and central Pacific in June. Convection was enhanced in the central and eastern Pacific during both months, suppressed across Indonesia in June.

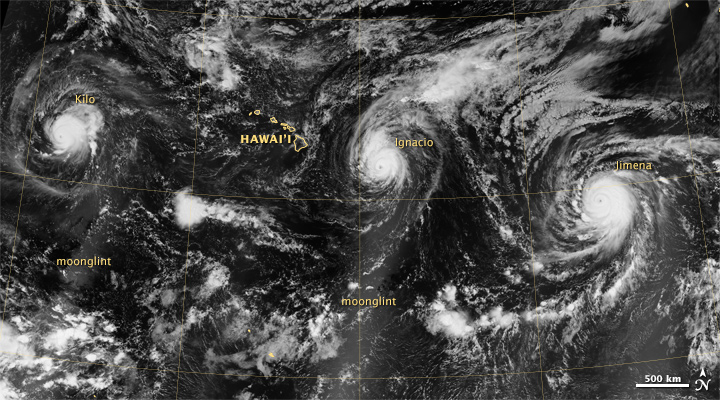
An unprecedented three Category 4 hurricanes occurred on the same date (August 29, 2015) in the central and eastern tropical Pacific - Kilo, Ignacio and Jimena (Image/NASA) (Reference 2)
July-August 2015
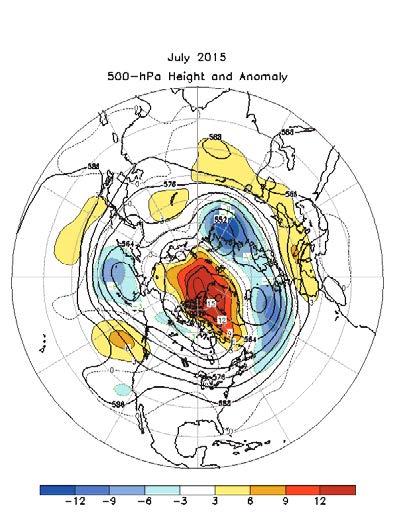
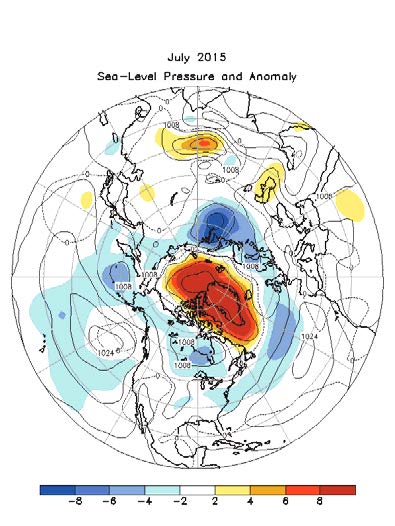
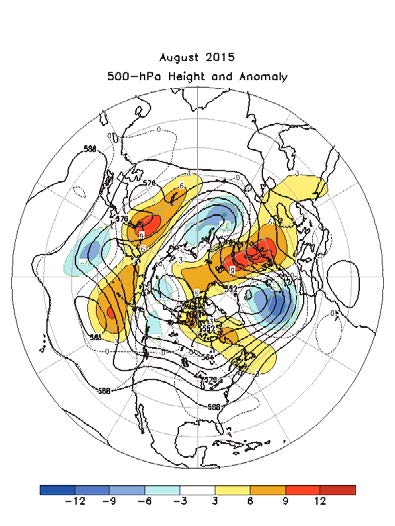
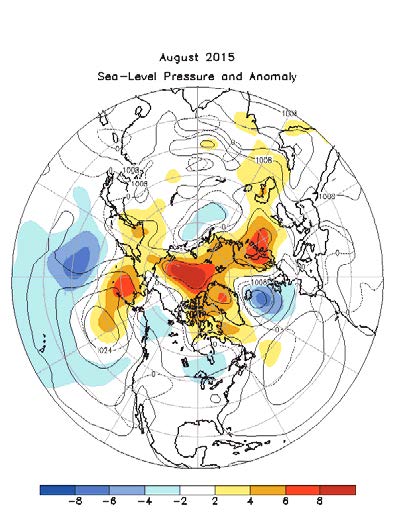
The July 2015 mid tropospheric circulation pattern was characterized by well above average 500 hPa heights across most of the Arctic Ocean and Greenland. Well below average heights were analyzed from the northeast North Atlantic across northern Europe to northwest Russia. Below average heights were also noted over the Bering Sea and adjacent far northern Pacific (Figure 5). The SLP and Anomaly pattern (Figure 6) for July generally shows anomalies of the same sign as those of the 500 hPa pattern. In August, the mean circulation was characterized by a wave number 5 pattern, though the ridge-trough couplet over the United States had very small anomalies. Above average 500 hPa heights extended from the North Pole southward across central and eastern Europe, east Asia, the Bering Sea and Gulf of Alaska, and over northern Canada. Below average heights were noted across the northeast Atlantic, north central Russia, the temperate western Pacific, and from the northern coast of Alaska southeastward into western Canada (Figure 7). The SLP and Anomaly map (Figure 8) roughly mirrors the 500 hPa pattern.
The Tropics
SSTs across the equatorial Pacific continued to be above average during July and August. The monthly Nino 3.4 indices were +1.6C and The depth of the oceanic thermocline was above average in the eastern equatorial Pacific during the two month period, and sub surface temperatures ranged from 1-6C above average. Low level westerlys (850 hPa) and upper level easterlies r (200 hPa) remained strong across the western and central Pacific during the period. Deep tropical cloudiness and related thunder storm activity remained enhanced over thecentral and eastern equatorial Pacific, and suppressed over Indonesia and the western Pacific. Collectively, these oceanic and atmospheric anomalies are consistent with El Nino conditions.
References
1. http://www.ncdc.noaa.gov/sotc/service/global/extremes/201505.gif
2. http://eoimages.gsfc.nasa.gov/images/imagerecords/86000/86512/three stormsnight_vir_2015242.jpg
Much of the information used in this article originates from the Climate Diagnostics Bulletin archive: (http://www.cpc.ncep.noaa.gov/products/CDB/CDB_Archive_html/CDB_archive.shtml)
Back to top