Mean Circulation Highlights and Climate Anomalies May through August 2014
Anthony Artusa, Meteorologist, Operations Branch, Climate Prediction Center NCEP/NWS/NOAA
All anomalies reflect departures from the 1981-2010 base period.
September-October 2014
The mid-tropospheric flow pattern during September featured above-average 500-hPa heights from the high latitudes of the North Atlantic to western Russia, and across eastern Siberia and southern Alaska. It also featured below-average heights over northern Canada and Greenland, central Russia, the east-central North Atlantic, and across the high latitudes of the western North Pacific Figure 1. The sea-level pressure (SLP) pattern mirrored the more pronounced features of the circulation pattern Figure 2.
The October 500-hPa circulation featured a zonal wave-4 pattern of height anomalies across the Northern Hemisphere Figure 3. This pattern included above-average heights over west-central North America, eastern Canada, northern and western Europe, the Bering Sea, and most of the polar basin. Below-average heights were noted over the eastern North Pacific, the eastern contiguous U.S., the eastern North Atlantic, and much of Russia. The SLP pattern for October mirrored the 500-hPa height anomaly pattern Figure 4.
One highlight during the two-month period included heavy rain (8.4 cm) falling at the Phoenix Sky Harbor Airport on September 8, making it the wettest calendar day on record for the city since records began in 1895 Reference 1. Some locations outside the city received over 15 cm of rain, due to a moisture plume associated with the remnants of Hurricane Norbert.
The Tropics
Sea surface temperatures (SST) were above-average across the equatorial Pacific during both September and October, and the monthly Nino 3.4 index was +0.5C for both months. The depth of the 20C isotherm (oceanic thermocline) remained above-average across much of the equatorial Pacific in September, with corresponding subsurface temperatures 1-3C above-average in the eastern equatorial Pacific. During October, the depth of the thermocline was close to the long-term average. The low-level easterly trade winds remained near-average across the equatorial Pacific (September and October). Deep tropical cumuliform clouds and thunderstorm activity was enhanced over the western equatorial Pacific in September, and suppressed over Indonesia in October. These oceanic and atmospheric anomalies collectively reflect a continuation of ENSO-neutral conditions.
November-December 2014
The 500-hPa circulation during November was very amplified and featured below-average heights from central and eastern North America eastward across the higher latitudes of the North Atlantic to western Europe, central Russia, and the central North Pacific Figure 5. Above-average heights were noted over western North America (in particular, Alaska), the central North Atlantic, central and eastern Europe, and over far east Asia. The sea-level pressure and anomaly map (Figure 6) generally mirrors the 500-hPa pattern.
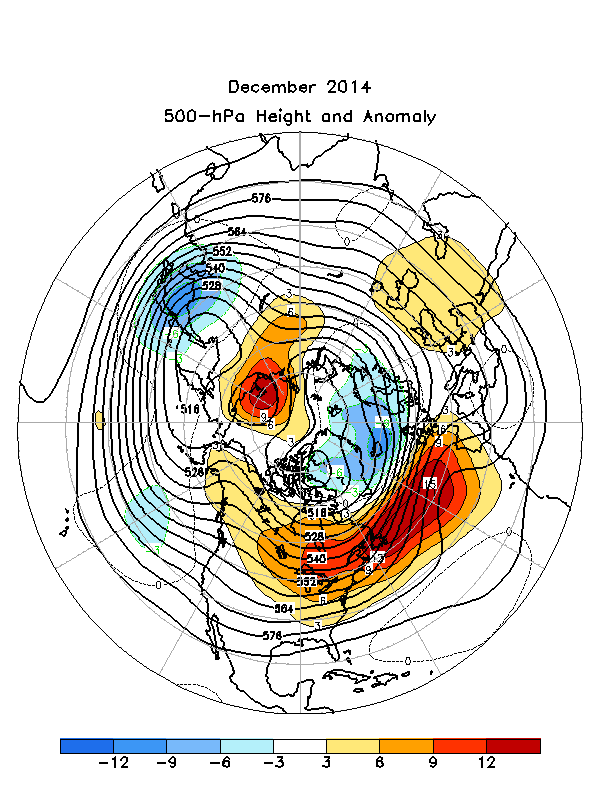
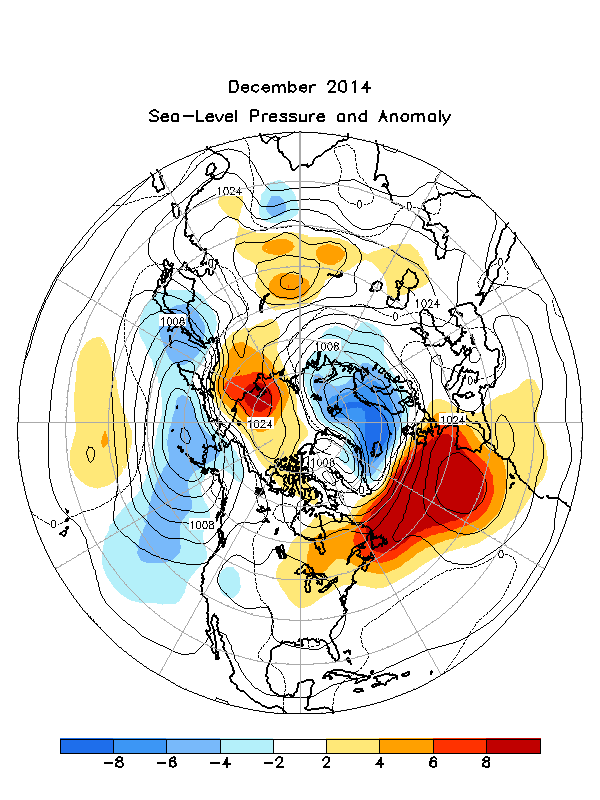
During December, the 500-hPa circulation pattern featured above-average heights across Alaska, Canada, the eastern contiguous U.S., and the central North Atlantic. Below-average heights were noted over the east-central North Pacific, the high latitudes of the North Atlantic, and east Asia Figure 7. Above-average SLP was observed from eastern Canada eastward across the central North Atlantic to western Europe, and portions of eastern Siberia. Below-average SLP was noted from far east Asia across the Bering Sea to the eastern North Pacific, and over the European half of the Arctic Ocean Figure 8.
A major lake-enhanced snowfall event occurred in, and south of, the Buffalo, NY, area from November 17-21, from back-to-back storm systems. Very cold arctic air swept over the still relatively warm waters of the Great Lakes, resulting in extreme convective overturning of the lower atmosphere. Up to 224 cm of snow fell just south of Buffalo, making it one of the area's largest snowfall events in history. Extreme snowfall rates of up to 13 cm/hr occurred. The National Weather Service Forecast Office in Buffalo, NY, provides in-depth write-ups of these historic back-to-back lake-effect events at References 2,3.
The Tropics
ENSO-neutral conditions continued during November and December 2014. Sea surface temperatures (SST) were above-average across the equatorial Pacific during both months, although the positive SST anomalies decreased over the central and eastern equatorial Pacific during December. The latest monthly Nino 3.4 indices were +0.9 (Nov) and +0.8 (Dec). The depth of the 20C isotherm (oceanic thermocline) was above-average over the eastern equatorial Pacific, and the corresponding subsurface temps ranged from 1-4C above-average in that region. Equatorial low-level easterly trade winds remained near-average across much of the Pacific during the two-month period. Suppressed tropical convection was observed over Indonesia and near the Date Line (Nov), and enhanced over Indonesia and suppressed near the Date Line (Dec).
References
1. http://www.ncdc.noaa.gov/sotc/national/2014/9
2. http://www.weather.gov/buf/lake1415_stormb.html
3. http://www.weather.gov/buf/lake1415_stormb.html
Much of the information used in this article originates from the Climate Diagnostics Bulletin archive: (http://www.cpc.ncep.noaa.gov/products/CDB/CDB_Archive_html/CDB_archive.shtml)
Back to top


