MARINE WEATHER REVIEW NORTH ATLANTIC AREA January to April 2014
George P. Bancroft Ocean Forecast Branch, Ocean Prediction Center, College Park, MD NOAA National Center for Environmental Prediction
Introduction
The winter months of January and February were a continuation of December 2013s active pattern as a series of deep cyclones developed while tracking northeast across the North Atlantic toward the British Isles and Iceland, with one very deep low turning north into the Davis Strait, early in January. During late February and especially in March and April, blocking high pressure became more frequent over the North Atlantic or at high latitudes, causing some of the cyclones to initially strengthen rapidly over the southwestern waters, off the U.S. East Coast, before moving out over the North Atlantic where some stalled or moved erratically. During the four month period twenty-three lows developed hurricane force winds detected by satellite, conventional surface observations, or model data. Seven of these occurred in January, followed by ten in February, five in March and one in April. According to a study based on QuikSCAT winds (VonAhn and Sienkiewicz, 2005), the peak frequency of such cyclones has been found to occur in January. Eight cyclones developed central pressures below 950 hPa, including three in January with central pressures in the 930s. There was no tropical activity to report during this period.
Significant Events of the Period
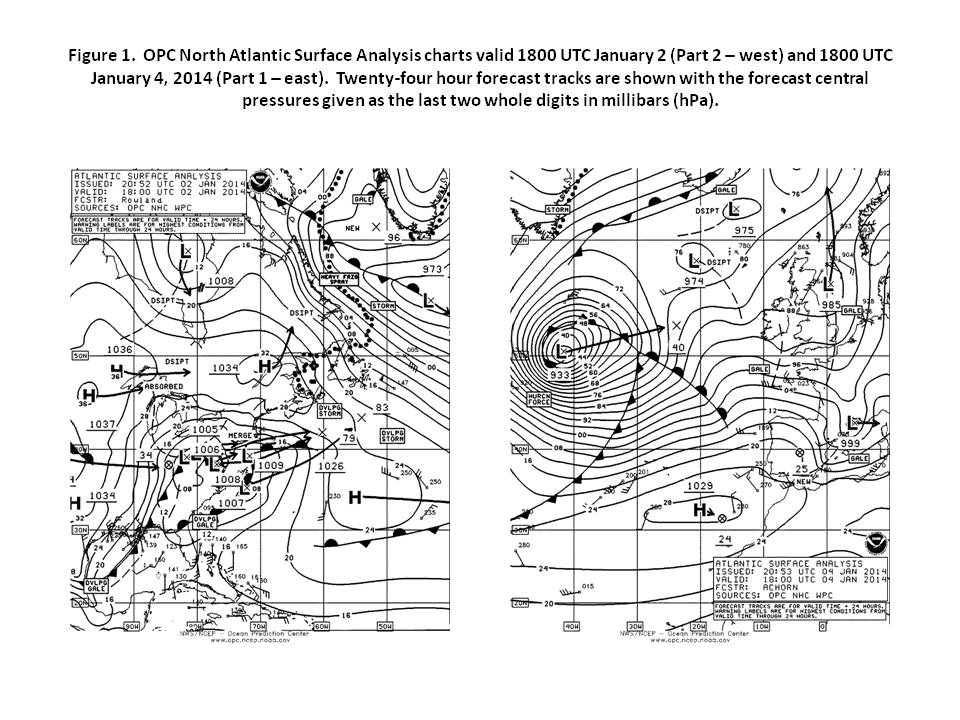
North Atlantic Storm, January 1-3: The first and weaker of two hurricane force cyclones that followed similar tracks during the first week of January originated near the U.S. mid-Atlantic coast on December 3st and intensified into a storm over the central North Atlantic waters on the afternoon of January 1st. The cyclone developed hurricane force winds the following night and then a lowest central pressure of 951 hPa west of Ireland near 54N 13W at 0000 UTC on the 3rd. Buoy 62023 (51.4N 7.9W) reported southwest winds of 58 kt with gusts to 71 kt and 8.5 m seas (28 feet) at 1500 UTC on the 3rd , and one hour later a gust of 76 kt and 10.0 m seas (33 feet). The ship BAREU12 (51N 30W) reported northwest winds of 50 kt and 5.2 m seas (17 feet) at 1800 UTC on the 2nd. The Maersk Ohio (KABP) encountered west winds of 45 kt and 7.6 m seas (25 feet) near 52N 43W one hour earlier. The cyclone then weakened to a gale while passing north of the British Isles late on the 3rd. The second part of Figure 1 shows the weakening low passing east of Iceland on the 4th.
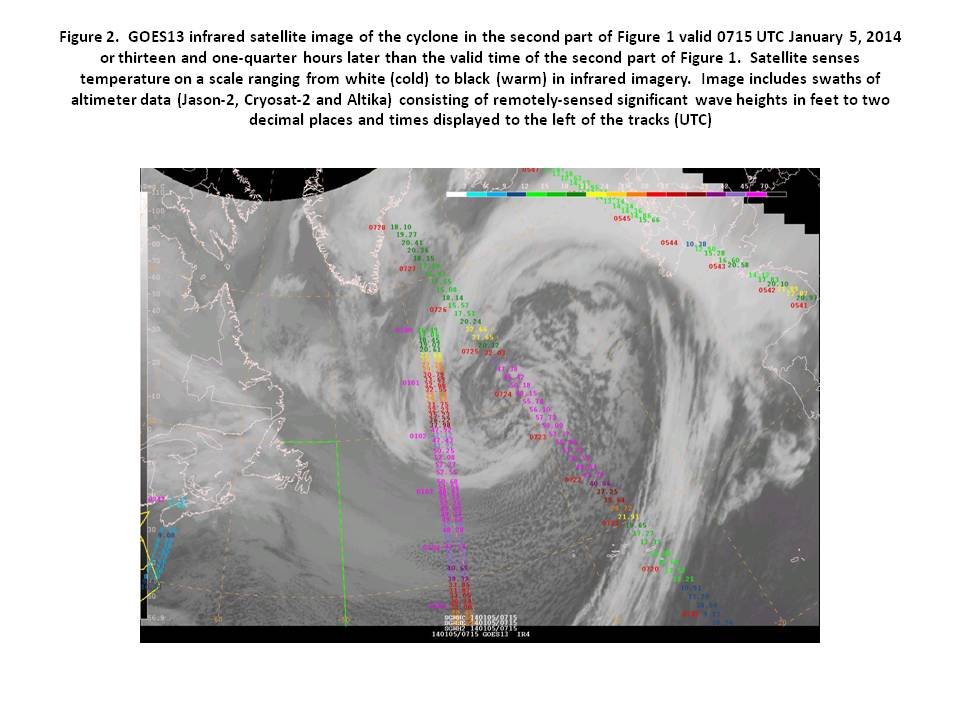
North Atlantic Storm, January 3-6: The development of the deepest cyclone of the period is depicted in Figure 1. The complex area of low pressure near the U.S. East Coast consolidated into a hurricane force low with a central pressure as low as 933 hPa over the central North Atlantic over a two day period. The period of most rapid intensification included a drop of 42 hPa in the 24 hour period ending at 1200 UTC January 4th. This is well above the 24 hPa needed for a bomb at 60N (Sanders and Gyakum, 1980). Figure 2 is an infrared satellite image of the storm taken 0715 UTC on the 5th revealing an expansive mature cloud pattern with broad cold topped frontal bands. The central pressure was only beginning to increase by this time. The image also includes two satellite altimeter passes cutting across the south side of the cyclone, revealing seas as high as 18 m (59 feet). The scatterometer image in Figure 3 shows a large swath of 50 kt to as high as 80 kt winds on the southwest side of the cyclone, which was centered near the northeast corner of the image at this time and was approaching maximum intensity. Some notable surface observations taken in this storm are listed in Table 1. Hurricane force winds with this system persisted into the night of the 5th. Winds weakened to gale force as the center passed northwest of the British Isles on the afternoon of the 8th and to below gale force as the center passed east of Iceland on the 8th.

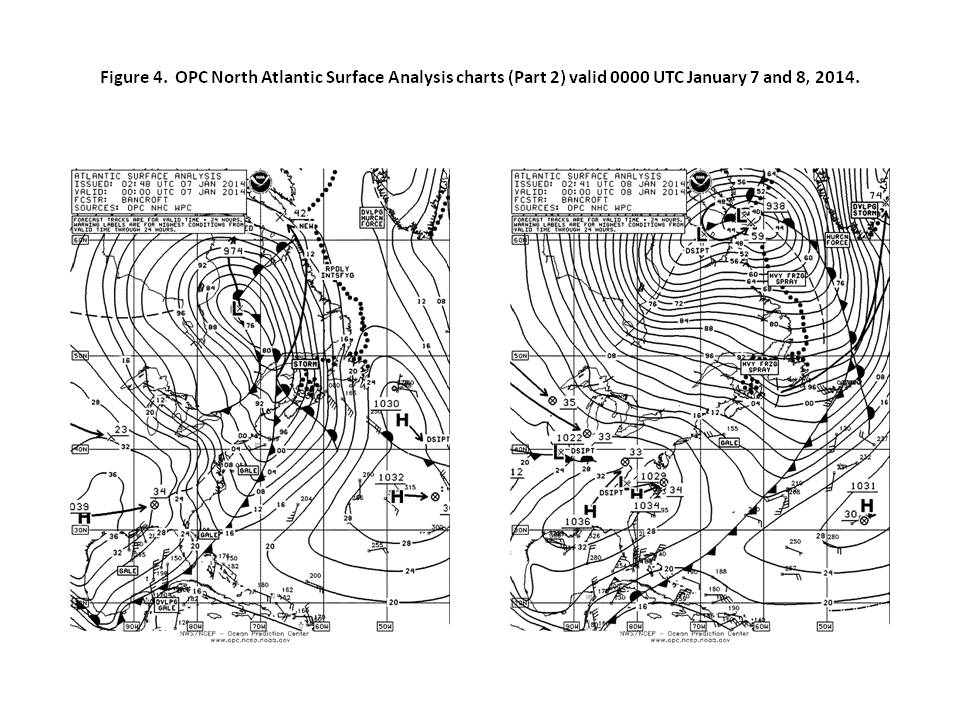
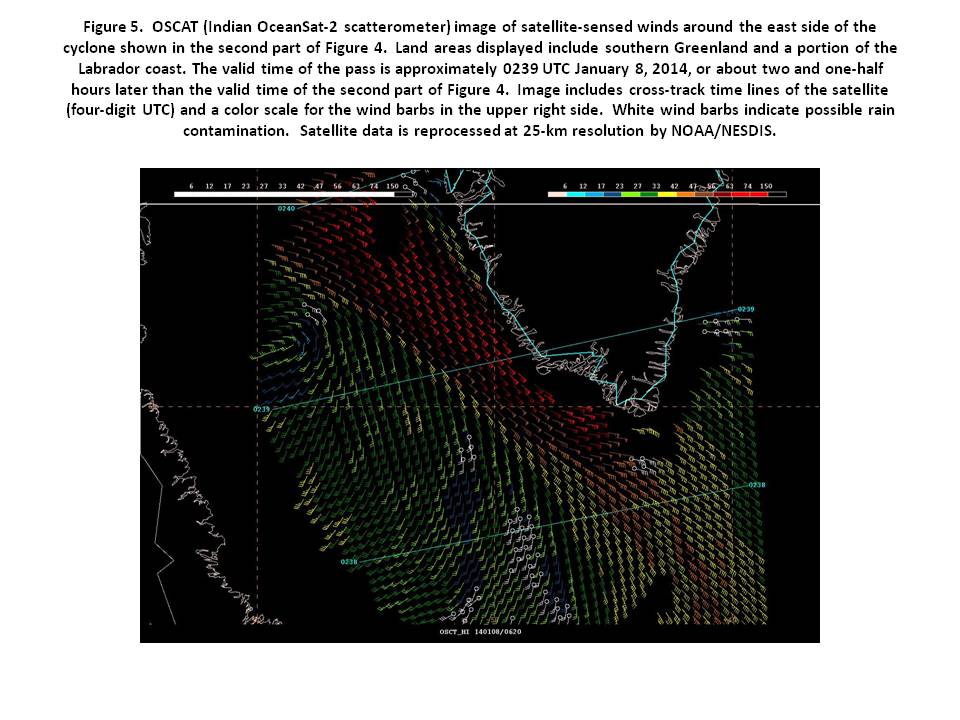
Northwestern Atlantic Storm, January 6-8: A primary strong low pressure system tracked northward inland over Quebec as a secondary low formed on the triple point where the occluded front, cold and warm fronts meet, as shown in Figure 4. The second part of Figure 4 shows the secondary low at maximum intensity as the primary low to the southwest dissipates. An OSCAT scatterometer pass (Figure 5) returned winds as high as 75 kt in the southeast flow between the occluded front and the southwest Greenland coast, in an area where there is little ship data. To the south, Hibernia Platform (VEP717, 46.7N 48.7W) reported south winds of 60 kt at 1500 UTC on the 7th (anemometer height 139 m). Buoy 44139 (44.2N 57.1W) at 0200 UTC on the 8th reported west winds of 37 kt with gusts to 47 kt and 6.0 m seas (20 feet), and seven hours later seas of 9.0 m (30 feet). The cyclone subsequently weakened to a gale by early on the 8th while making a cyclonic loop and then moved north through the Davis Strait on the 9th.
North Atlantic Storm, January 10-13: Low pressure formed about 300 nm southeast of Cape Race 0000 UTC January 10th and, after initially deepening by 32 hPa in the first 24 hour period, continued with more gradual strengthening over the central waters where it developed hurricane force winds on the 11th and early on the 12th. An ASCAT pass from 1227 UTC on the 12th revealed a swath of west winds 50 to 60 kt on the south side of the cyclone, which passed near 57N 24W with a lowest central pressure of 959 hPa near this time. The Atlantic Companion (SKPE) reported northwest winds of 55 kt near 56N 34W at 0600 UTC on the 12th. The cyclone weakened late on the 12th and the 13th before becoming absorbed by another low south of Iceland late on the 13th.
North Atlantic Storm, January 11-14: Another cyclone followed close behind the preceding event, tracking across southern Quebec and Labrador late on January 11th and the 12th with central pressure already in the upper 970 hPa and storm force winds. It passed offshore on the 13th and briefly developed hurricane force winds late on the 13th, when an ASCAT (METOP-B) pass from 2114 UTC on the 13th revealed northeast winds 50 to 60 kt on the north side as the center passed south of Greenland. The cyclone center passed near 57N 26W with a lowest central pressure of 963 hPa at 1800 UTC on the 14th before tracking east-southeast toward Great Britain, where it dissipated late on the 16th.
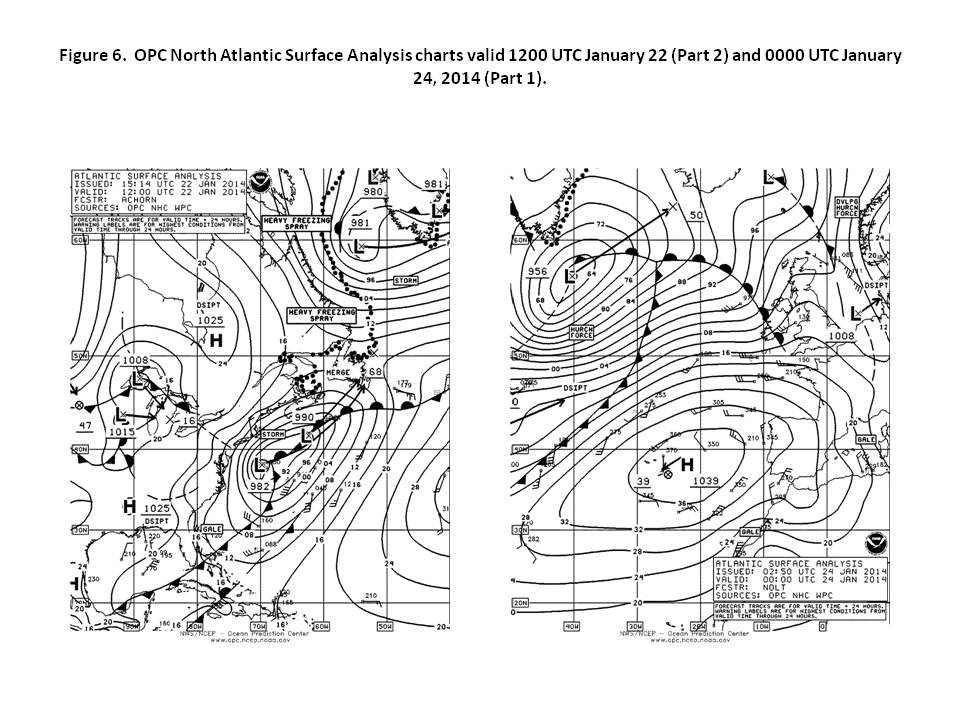
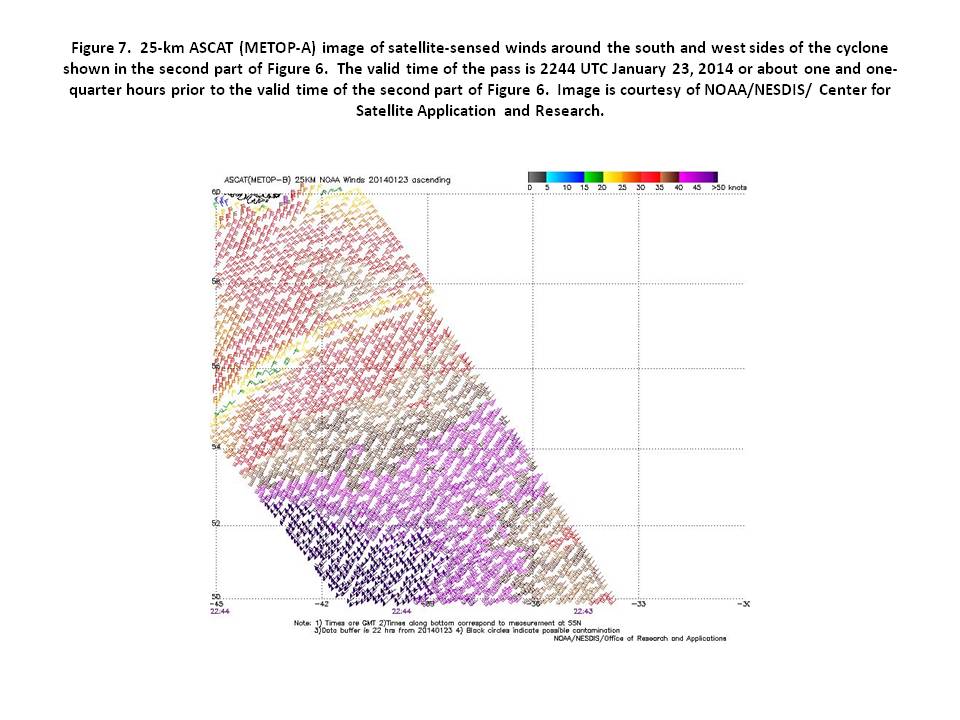
North Atlantic Storm, January 22-26: Low pressure originating near the North Carolina coast at 1800 UTC on January 21st initially rapidly developed over the southwest waters before developing into a hurricane force storm south of Greenland as depicted in Figure 6. The central pressure fell 29 hPa in the twenty four hour period ending at 0000 UTC on the 23rd. Buoy 44251 (46.4N 53.4W) reported west winds 45 kt with gusts to 56 kt and 10.0 m seas (33 feet) at 1300 UTC on the 23rd. Buoy 44139 (44.2N 57.1W) reported southwest winds of 49 kt with gusts to 66 kt and 7.0 m seas (23 feet) at 0500 UTC on the 23rd, and 10.0 m seas (33 feet) two hours later. The Henry Goodrich platform (YJQN7, 47.5N 48.0W, anemometer height 90 m) reported southwest winds of 94 kt while Hibernia (VEP717, 46.7N 48.7W) and Terra Nova FPSO (VCXF, 46.4N 48.4W) encountered southwest winds 84 kt and 56 kt, respectively, three hours later. Anemometer elevations account for differences in winds, with Hibernia highest at 139 m . The ASCAT-B image in Figure 7 shows a swath of southwest winds 50 to 60 kt on the south side of the cyclone near 57N 40W at that time. The cyclone developed a lowest central pressure of 948 hPa as it approached Iceland late on the 24th before turning toward the southwest and becoming absorbed on the 26th.
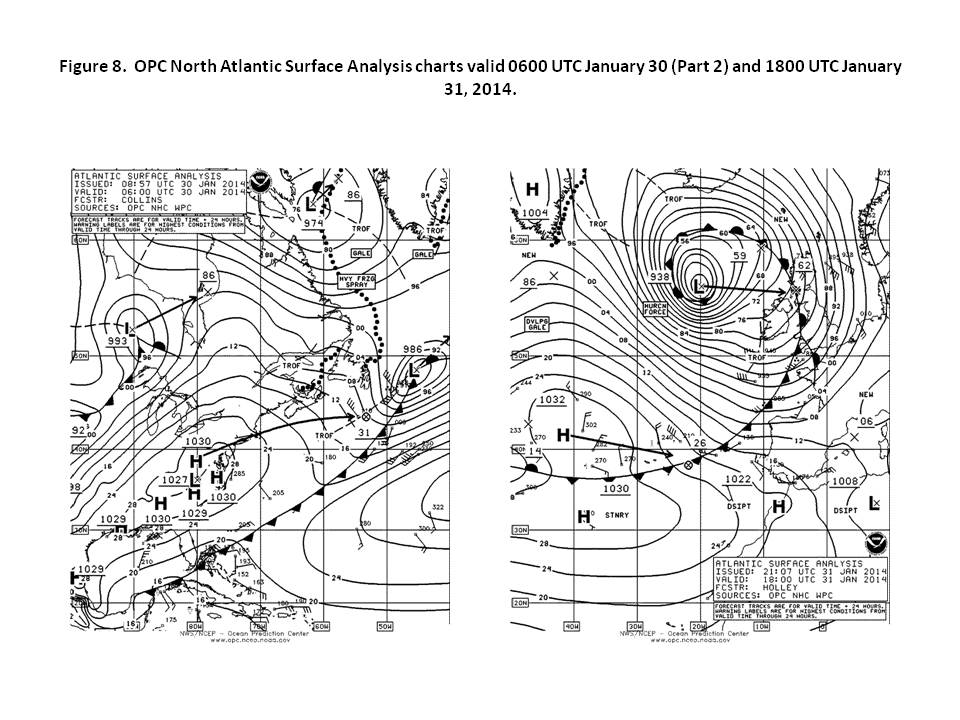
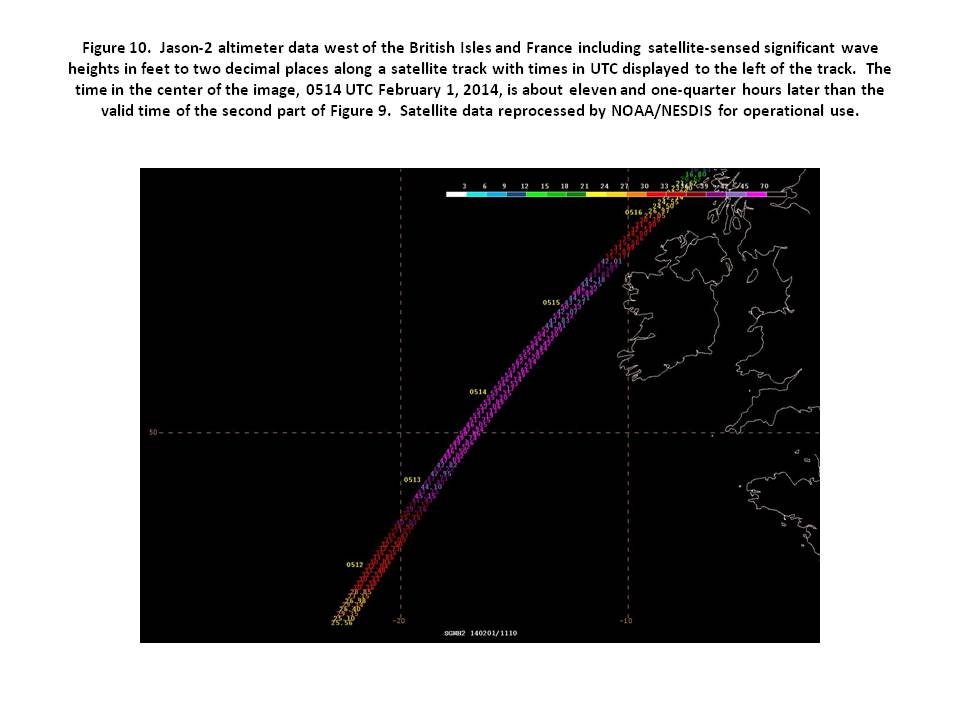
North Atlantic Storm, January 29-February 2: Low pressure moved off the southeast U.S. coast early on January 28, passed south of the Canadian Atlantic provinces as a gale late on the 28th and 29th and then rapidly intensified in the following thirty-six hour period as depicted in Figure 8. At 938 hPa, the cyclone became the second deepest of the period and the third low of the month with pressures in the 930 hPas. The central pressure fell 44 hPa in the 24 hour period ending at 0600 UTC on the 31st. The infrared satellite image in Figure 9 shows the cyclone at maximum intensity with an intense circulation involving well defined frontal features with great vertical extent (cold cloud tops). Hurricane force winds with this system lasted from late on the 30th through the night of the 31st with a high resolution ASCAT image from near 1200 UTC on the 31st returning winds of 50 to 70 kt around the south and west sides similar to Figure 17 for the February 12-15 event. A Jason-2 pass taken during the following night over the south side of the low (Figure 10) returned wave heights as high as 19 m (63 feet). Buoy 62023 (51.4N 7.9W) reported west winds of 60 kt and 7.6 m seas (25 feet) at 1000 UTC February 1st and four hours later seas of 8.8 m (29 feet). Buoy 62163 (47.5N 8W) reported seas as high as 11.9 m (39 feet) at 2000 UTC on the 1st. The cyclone then passed over the British Isles before turning north and moving through the Norwegian Sea as a gale on the 2nd.
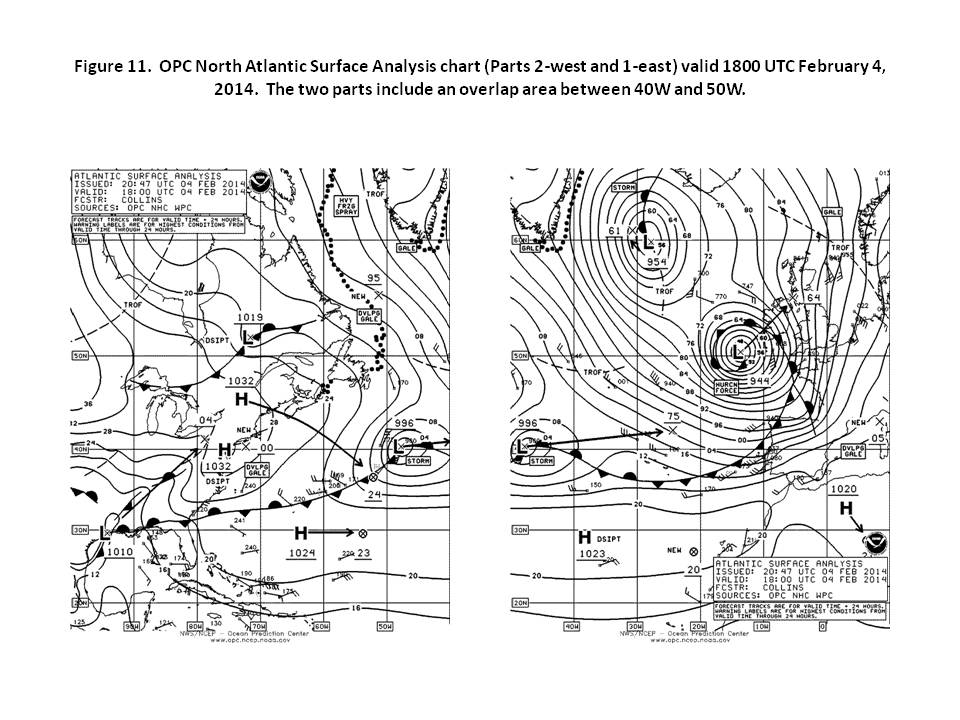
Eastern North Atlantic Storm, February 3-5: The next development followed a similar track and was almost as deep, taking three days to track from the North Carolina coast to the British Isles, with Figure 11 showing the low at maximum intensity approaching Ireland. Like its predecessor it deepened by 44 hPa in a 24 hour period prior to reaching maximum intensity. An ASCAT-B high-resolution pass from 1208 UTC on the 4th returned a swath of winds 50 to 70 kt around the south and southwest sides. The St. Louis Express (WDD3825) near 51N 13W reported northwest winds of 55 kt and 9.4 m seas (31 feet) at 0500 UTC on the 5th. Buoy 62163 (47.5N 8.4W) reported south winds of 44 kt and 7.5 m seas (25 feet) at 1400 UTC on the 4th, and highest seas 13.5 m (44 feet) at 0500 UTC on the 5th. Buoy 62023 (51.4N 7.9W) came in with southeast winds 58 kt with gusts to 71 kt and 5.5 m seas (18 feet) at 1700 UTC on the 4th, and ten hours later with 9.5 m seas (31 feet). The system then weakened while crossing the British Isles with its winds dropping to below gale force on the 6th east of Iceland.
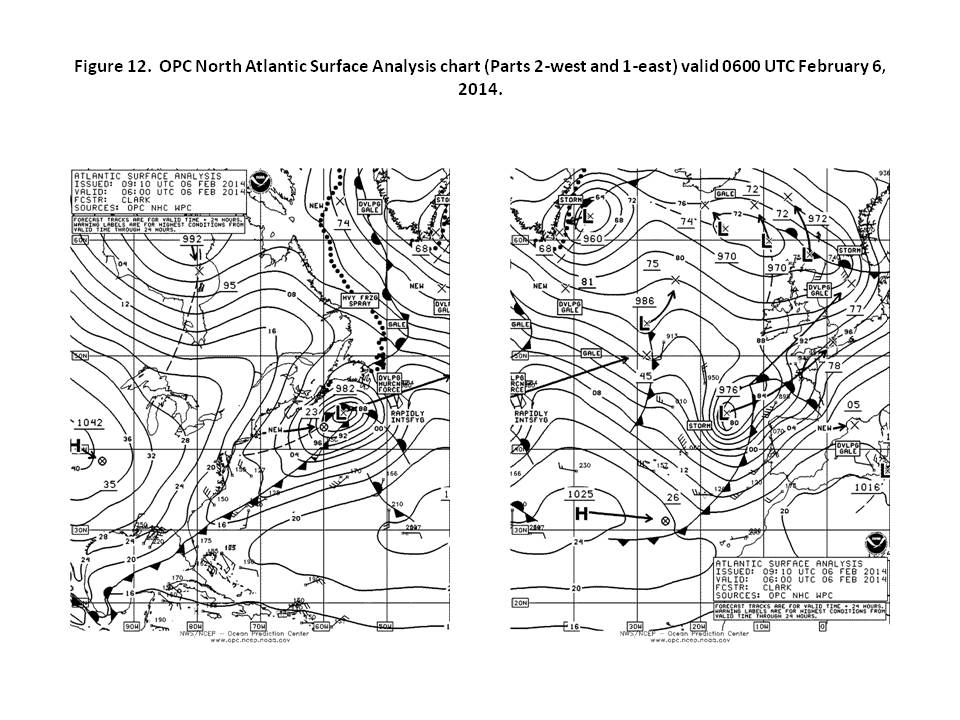
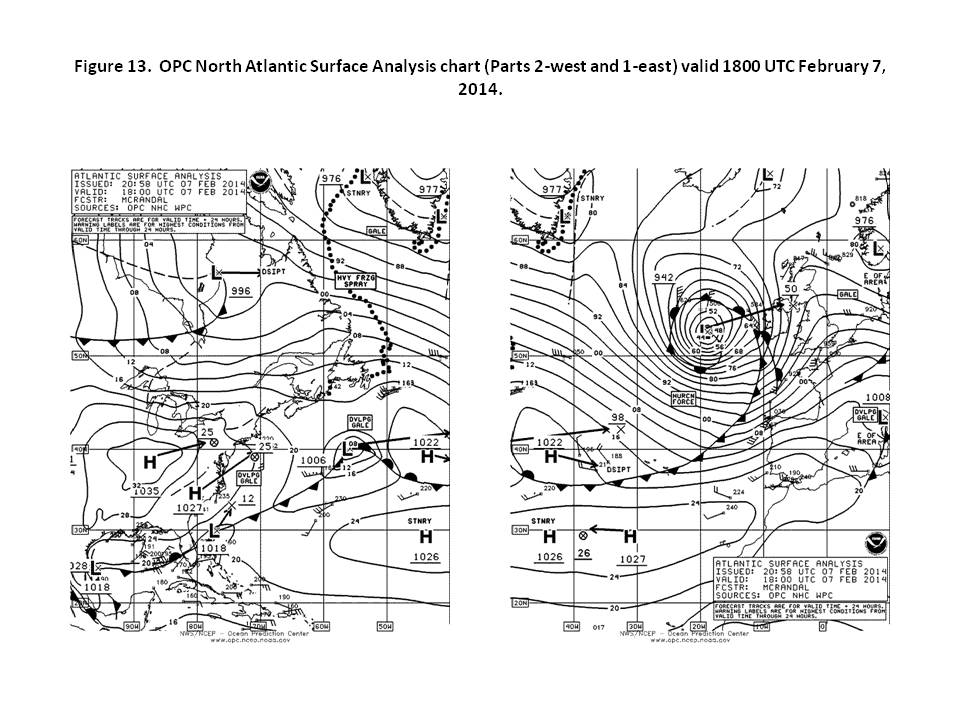
North Atlantic Storm, February 4-7: Low pressure formed near the U.S. mid-Atlantic coast on the afternoon of the 3rd and followed a more southern track as depicted in Figures Figure 11 and Figure 12. It briefly developed hurricane force winds with a 974 hPa central pressure late on the 5th just prior to the Figure 12 map time. ASCAT imagery from 1233 UTC on the 5th revealed a small area of 50 kt to as high as 65 kt around the west semicircle of the low. The Federal Tambo (V7YW3) reported northwest winds of 50 kt and 7.3 m seas (24 feet) near 40N 23W at 2300 UTC on the 5th. The St. Louis Express (WDD3825) encountered west winds of 45 kt and 9.4 m seas (31 feet) near 45N 23W 19 hours later. The cyclone then turned toward the northeast and weakened, with Figure 13 showing it inland over southern Norway.
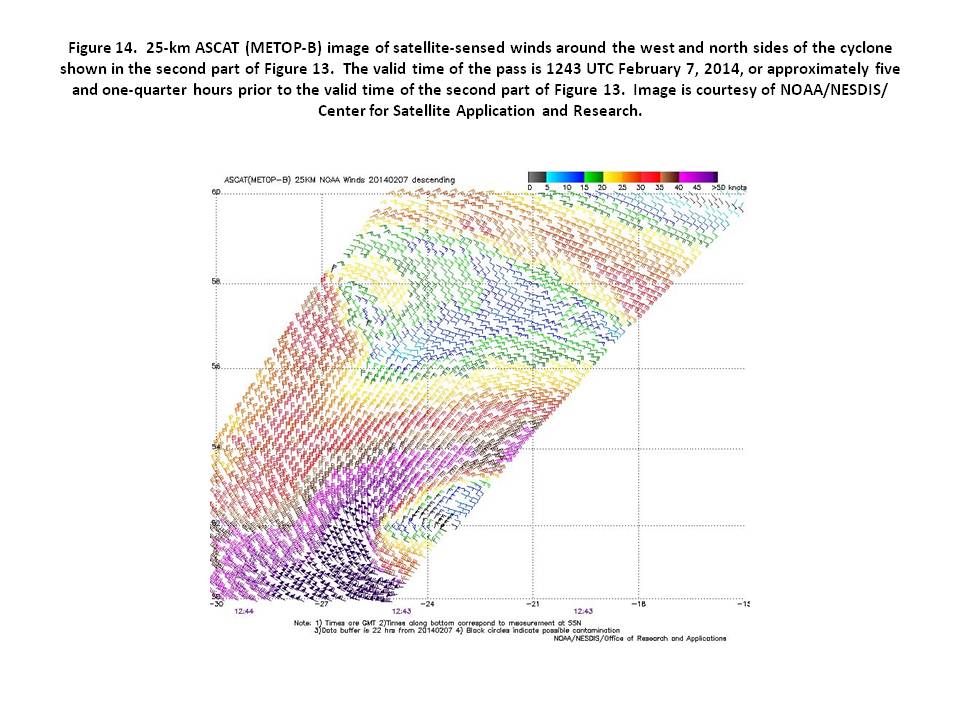
North Atlantic Storm, February 5-9: Figure 12 and Figure 13 show the next developing hurricane force low moving from south of Newfoundland to the eastern waters off Ireland over a 36 hour period. Six hours later it developed a lowest central pressure of 941 hPa. The central pressure fell 40 hPa in the 24 hour period ending at 0000 UTC on the 7th. The ASCAT-B image in Figure 14 reveals winds as high as 80 kt on the southwest side of the low center which is near the pass edge. The Atlantic Conveyor (SCKM) near 54N 26W reported northwest winds of 60 kt and 5.5 m seas (18 feet) at 0000 UTC on the 8th. The St. Louis Express (WDD3825) near 42N 27W encountered southwest winds of 50 kt and 10.7 m seas (35 feet) at 0700 UTC on the 7th, and four hours later the same ship reported seas of 13.4 m (44 feet) near 42N 27W. Buoy 62023 (51.4N 7.9W) reported west winds of 60 kt with gusts to 75 kt and 10.5 m (34 feet) at 1500 UTC on the 8th, followed by a peak gust 79 kt one hour later and highest seas of 12.0 m (39 feet) at 1900 UTC on the 8th. The cyclone weakened as it crossed the British Isles and passed north of the islands as a gale on the 9th.
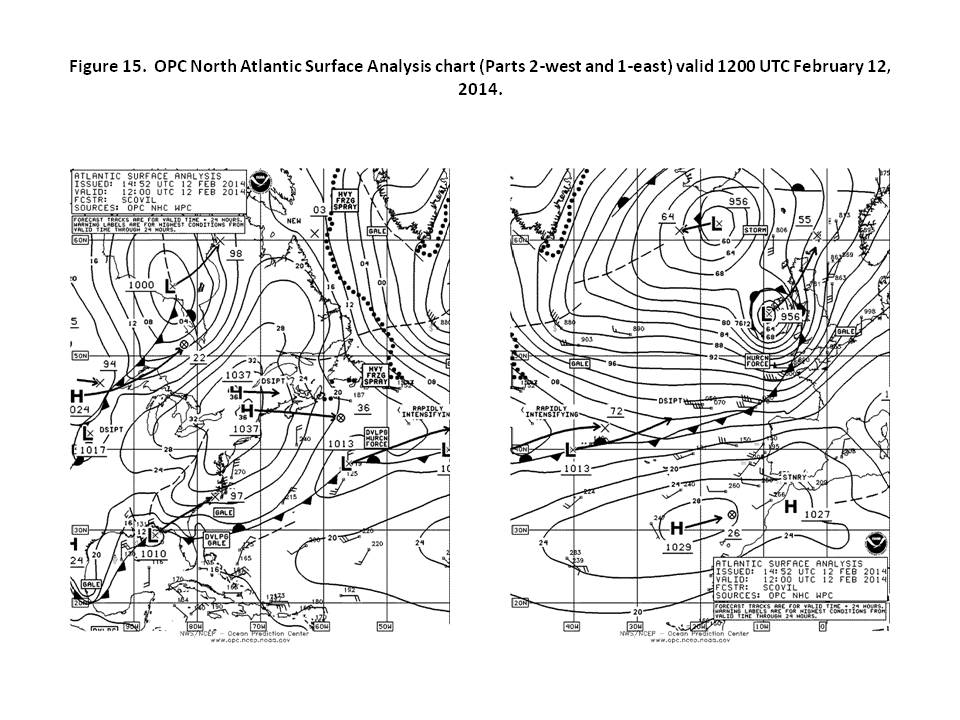
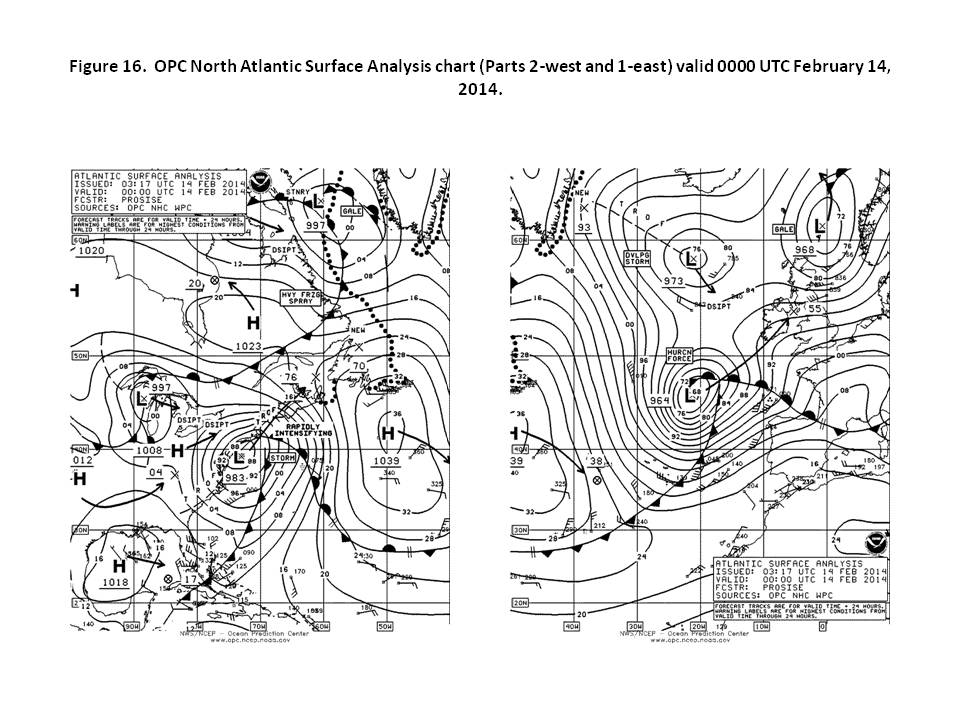
Northeastern Atlantic Storm, February 11-13: The next event consisted of low pressure tracking east-northeast from New England but not rapidly intensifying until it passed east of 35W, when it deepened by 41 hPa in the 24 hour period ending at 1200 UTC February 12th . Figure 15 shows the cyclone near maximum intensity on the coast of Ireland. The Norfolk Express (ZCEI6) near 47N 17W reported west winds of 55 kt and 8.5 m seas (28 feet) at 0400 UTC on the 12th, followed three hours later with a report of seas 10.7 m (35 feet) near 47N 19W. The buoy report from 62023 (51.4N 7.9W) stands out among the others in the area. It reported west winds of 68 kt with gusts to 96 kt and 10.0 m seas (33 feet) at 1300 UTC on the 12th, followed one hour later by a report of seas 11.5 m (38 feet). The cyclone weakened as it passed north of Scotland (Figure 16), with its winds diminishing to below gale force on the 14th.
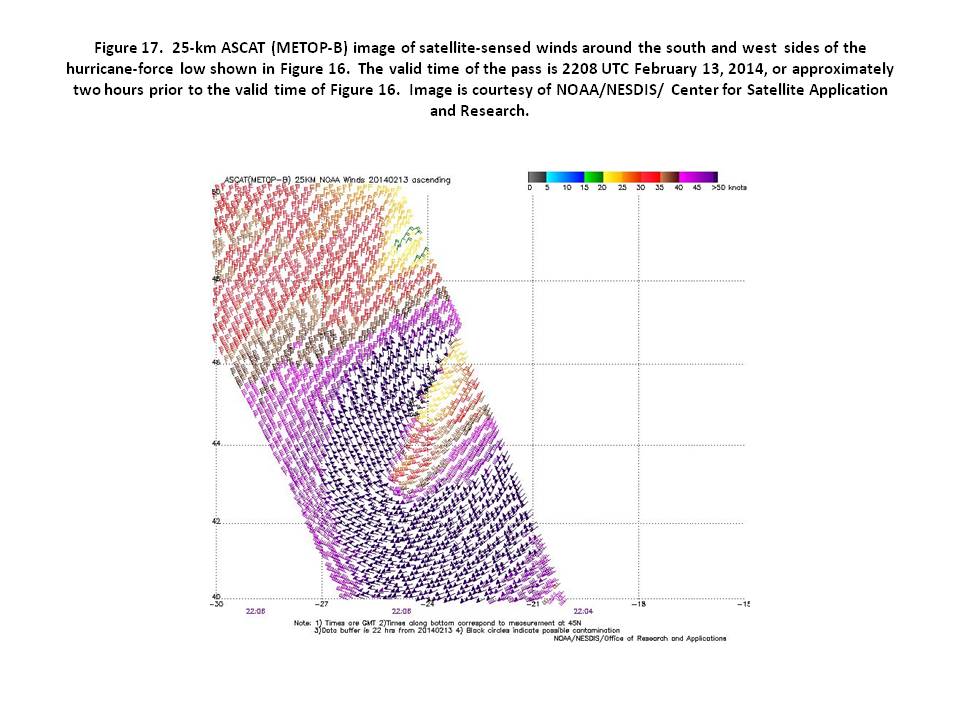
North Atlantic Storm, February 12-15: Figure 15 and Figure 16 show the next developing hurricane force low following close behind its predecessor. It originated off the southeast U.S. coast late on the 11th and was of similar intensity, reaching 955 hPa over the British Isles. The ASCAT-B image in Figure 17 shows strong support for hurricane force winds given the presence of widespread winds of 55 to 60 kt around the south and west sides of the cyclone and low bias of the winds at high wind speeds. The Southern Horizon (WDE9588) reported southwest winds of 45 kt and 8.5 m seas (28 feet) near 38N 19W at 0000 UTC on the 14th. Buoy 62023 (51.4N 7.9W) reported west winds of 50 kt with gusts to 61 kt and 8.0 m seas (26 feet) at 0100 UTC on the 15th and highest seas 9.0 m (30 feet) one hour later. Buoy 62163 (47.5N 8.4W) reported highest seas of 13.5 m (44 feet) at 1500 UTC on the 15th. The cyclone passed north of the British Isles on the 15th where its top winds weakened to gale force, and then moved inland over southern Norway by the 16th.
Western North Atlantic Storm, February 13-16: Strong high pressure moved out over the Atlantic by the middle of the month, leading to the next developing low to take a more northern track along the coast before moving out over the North Atlantic (Figure 15 and Figure 16). The cyclone developed hurricane force winds as it moved into the Atlantic provinces of Canada, detected by a NOAA P3 aircraft near 42N 62W (E-mail communication, Reference 6) and also by OceanSAT-2 (OSCAT) data from 0236 UTC on the 15th. The Amanda (9HA3164) near 37N 64W encounterd southwest winds of 50 kt and 10.7 m seas (35 feet) at 0000 UTC on the 15th. 12 hours later Hibernia Platform (VEP717, 46.7N 48.7W) reported southwest winds of 78 kt at an elevation of 139 m , while Terra Nova FPSO (VCXF, 46.4N 48.4W) encountered southwest winds of 62 kt. The cyclone developed a lowest central pressure of 963 hPa near 53N 50W at 1200 UTC on the 15th before beginning to weaken and turn east along 55N. The low dissipated over Great Britain on the 18th.
North Atlantic Storms, February 15-20: This developing cyclone initially followed a track similar to the preceding event, with the low pressure area developing storm force winds while passing near New England late on the 15th and briefly developing hurricane force winds while passing through the Gulf of St. Lawrence on the afternoon of the 16th with the central pressure down to 964 hPa. The ship H3VU (34N 77W) reported west winds of 55 kt and 6.4 m seas (21 feet) at 1800 UTC on the 15th. Hibernia Platform (VEP717) reported southwest winds of 78 kt at 1200 UTC on the 17th. Buoy 44141 (43.0N 58.0W) reported southwest winds of 49 kt with gusts to 62 kt and 7.5 m seas (25 feet) at 1600 UTC on the 16th, and highest seas 12.5 m (41 feet) three hours later. The system weakened to a gale in the Labrador Sea on the 18th and stalled, but as the cyclones occluded front approached Greenland it briefly developed hurricane force winds near the Greenland coast the following night. Meanwhile a new low center formed well to the south near 45N 43W at 0600 UTC on the 18th and moved northeast toward Iceland, developing a central pressure down to 960 hPa near 61N 28W at 1200 UTC on the 19th and absorbing the old cyclone. It briefly developed hurricane force winds in the easterly flow as its front approached Iceland on the 19th, as an ASCAT-B pass from 1238 UTC on the 19th showed east winds to 55 kt just south of Iceland. This low in turn became absorbed by another low developing and passing east of the island on the 21st.
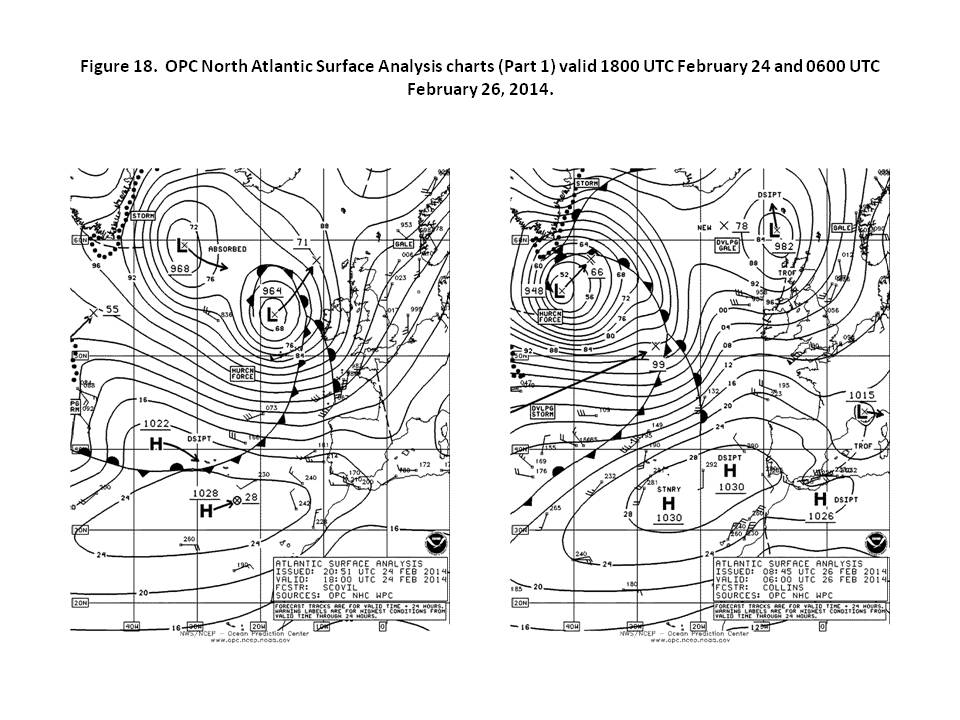
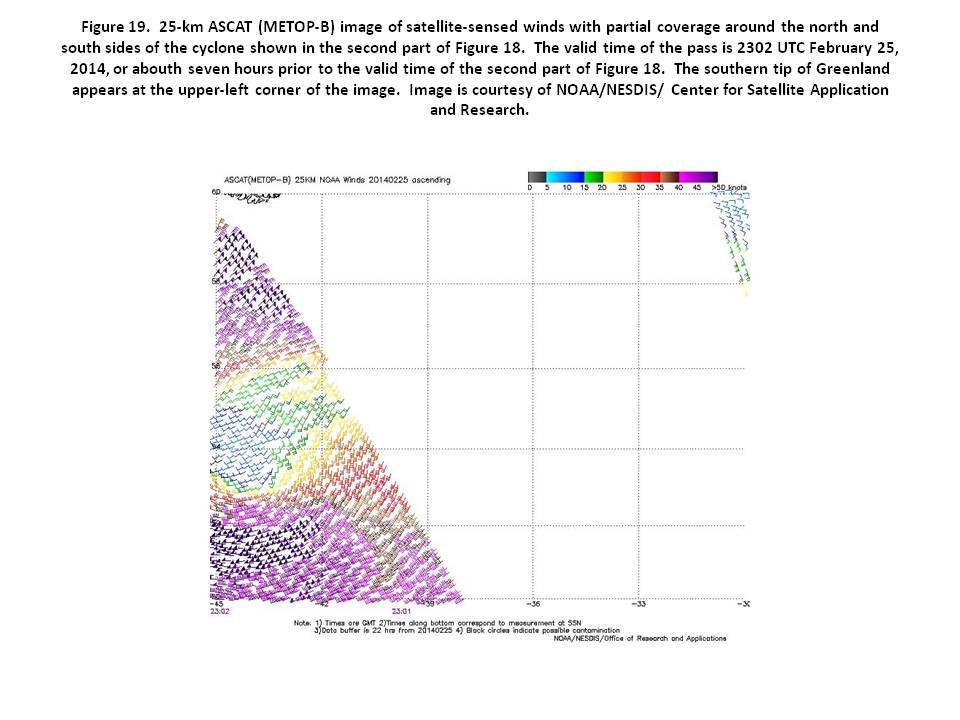
North Atlantic Storms, February 23-27: Low pressure originating near the New England coast late on the 21st moved across the Atlantic provinces of Canada the next day and then moved out over the North Atlantic on the 23rd. It briefly developed hurricane force winds on the 24th with a 964 hPa center (Figure 18) before weakening and passing north of Scotland early on the 26th (Figure 18). An ASCAT-A image for 1237 UTC on the 24th revealed west winds 50 to 60 kt on the south side of the center. At that time a new and stronger hurricane force cyclone appears south of Greenland with a lowest central pressure of 948 hPa (Figure 18). It originated near the southern New England coast late on the 23rd, and its central pressure dropped 40 hPa in the 24 hour period ending at 1800 UTC on the 25th. The ASCAT-B image in Figure 19 returned winds as high as 60 kt south of the center but with limited coverage which may miss the strongest winds especially on the north side. In the first storm, the Mekhanik Kovtun (UHSY) near 50N 16W reported southwest winds of 50 kt at 1800 UTC on the 24th. The Oriana (ZCDU9) reported west winds 30 kt but with 14.0 m seas (46 feet) near 45N 9W eighteen hours later. Buoy 62023 (51.4N 7.9W) reported south winds 43 kt with gusts to 53 kt and 5.0 m seas (16 feet) at 1800 UTC on the 24th and a peak gust of 63 kt one hour later, and highest seas 8.0 m (26 feet) at 0900 UTC on the 25th. The stronger cyclone subsequently drifted northeast into the east Greenland waters late on the 27th with winds weakening to gale force, and then dissipated by March 1st .
Far Eastern Atlantic Storm, February 27-28: A small but potent cyclone moved through the southern parts of Ireland and England on the 27th and 28th and affected adjacent waters. It originated near the island of Newfoundland early on the 26th and reached the British Isles in less than two days. The center developed a lowest central pressure of 984 hPa near 52N 7W at 0000 UTC on the 28th. The Hong Kong Express (DJAZ2) near 49N 5W encountered west winds of 50 kt at 0000 UTC on the 28th. Buoy 62107 (50.1N 6.1W) reported northwest winds of 50 kt with gusts to 72 kt and 9.0 m seas (30 feet) five hours later. Buoy 62023 (51.4N 7.9W) reported northwest winds of 55 kt with gusts to 68 kt and 6.4 m seas (21 feet) at 0300 UTC on the 28th. The cyclone then weakened in the southern North Sea late on the 28th.
North Atlantic Storm, February 28-March 3: This cyclone originating south of Nova Scotia late on February 27th and developed hurricane force winds over the north central waters on March 1st and 2nd with a central pressure as low as 964 hPa before turning toward the southeast and weakening over the southern British Isles late on the 3rd. An ASCAT-B pass from 1329 UTC March 1st showed a swath of west to southwest winds 50 to 65 kt south of the center. The ship BATEU06 (49N 11W) reported southwest winds of 50 kt at 2200 UTC on the 2nd. The Maersk Semarang (LXSR) near 45N 9W encountered west winds of 45 kt and 10.7 m seas (35 feet) at 0600 UTC on the 3rd. Seven hours later the Sigas Silvia (S6ES6) reported northwest winds 35 kt and 14.0 m seas (46 feet).
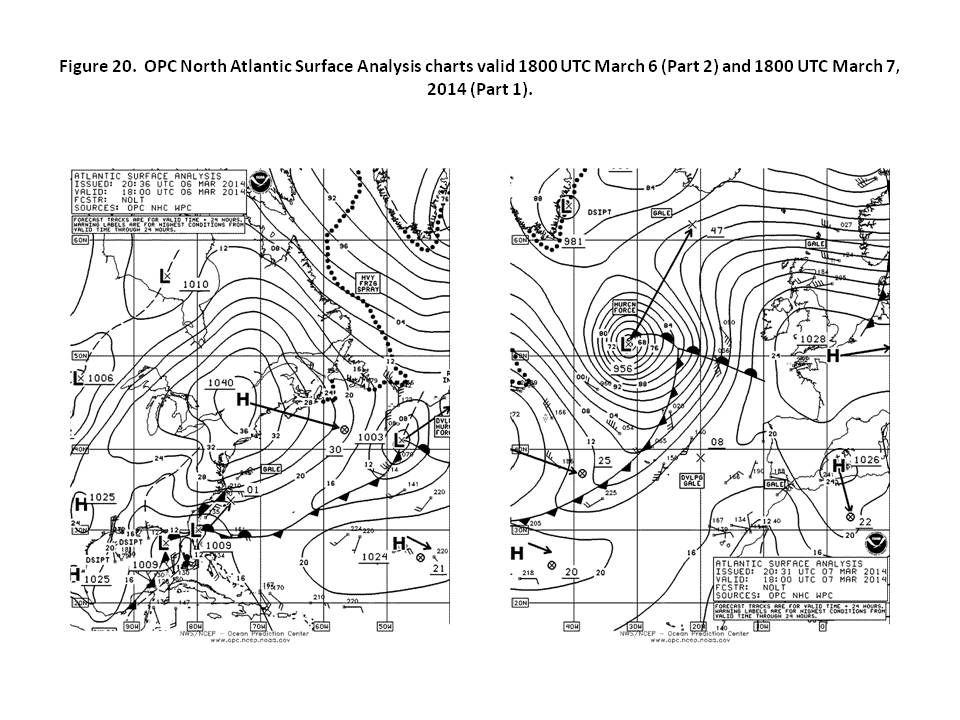
North Atlantic Storm, March 6-9: This rapidly developing cyclone moved from off the southeast U.S. coast on the 4th northeast to Iceland and developed storm force or higher winds over the central and northeast Atlantic waters. Figure 20 shows the period of most rapid intensification of this system, when the central pressure dropped 47 hPa in 24 hours. The central pressure reached 946 hPa as the center passed near 59N 23W 1200 UTC on the 8th. An ASCAT-A pass at 2158 UTC on the 7th returned numerous wind barbs in the 50 to 75 kt range and isolated 80 kt in the south semicircle of the cyclone. Some notable ship and buoy observations taken in this event are listed in Table 2. The cyclone began to weaken and passed northeast of Iceland early on the 9th.

North Atlantic Storm, March 8-10: This event originated as an area of low pressure in the northeast Gulf of Mexico on March 6th (Figure 20). The cyclone developed storm force winds south of the Canadian Atlantic provinces on the 8th and hurricane force winds when passing between Greenland and Iceland on the 10th, when the central pressure reached 953 hPa. An ASCAT image from 2100 UTC on the 10th revealed 50 to 60 kt winds in the southwest flow as the low passes to the north. The cyclone passed north of Iceland shortly thereafter.
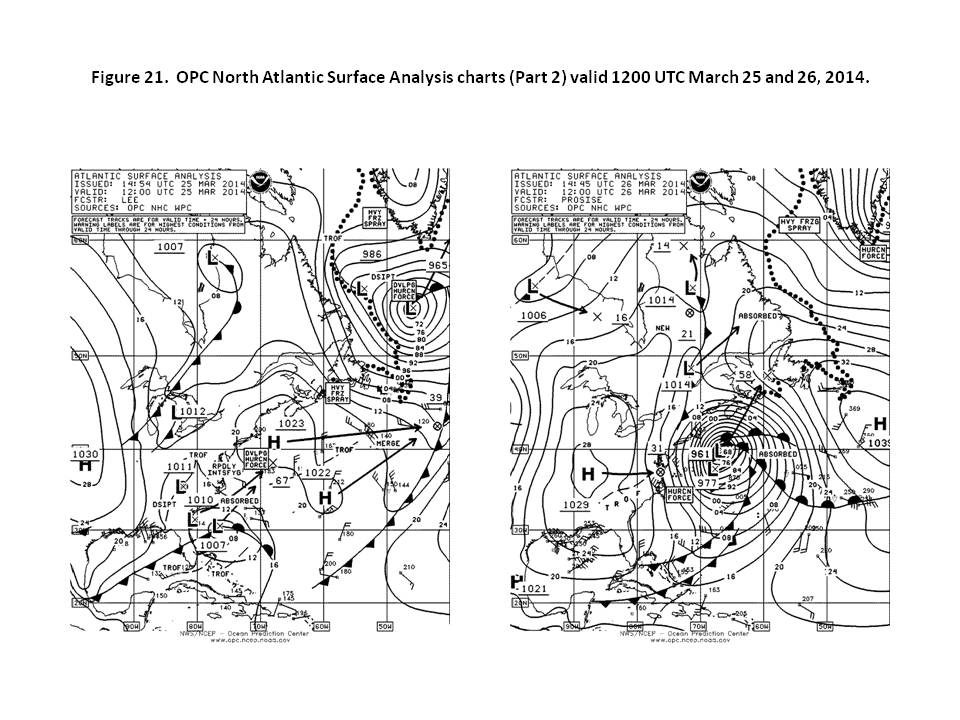
North Atlantic Storm, Greenland area, March 24-27: Figure 21 depicts low pressure approaching Greenland in the first part of Figure 21 and passing east of Greenland in the second part with hurricane force winds. This is an effect of Greenland tending to induce low pressure trough on its east or lee side after a cyclone passes to the east and enhancing the pressure gradient near the southern tip of Greenland. The low originated south of Nova Scotia near 40N on the afternoon of the 23rd. This cyclone then passed between Greenland and Iceland on the 27th.
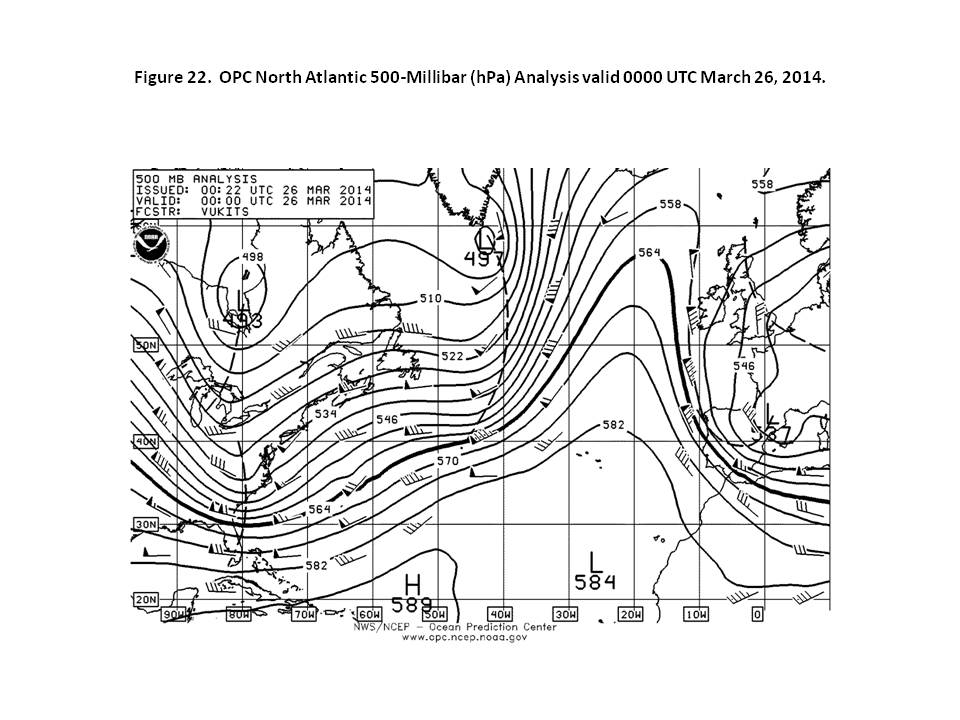
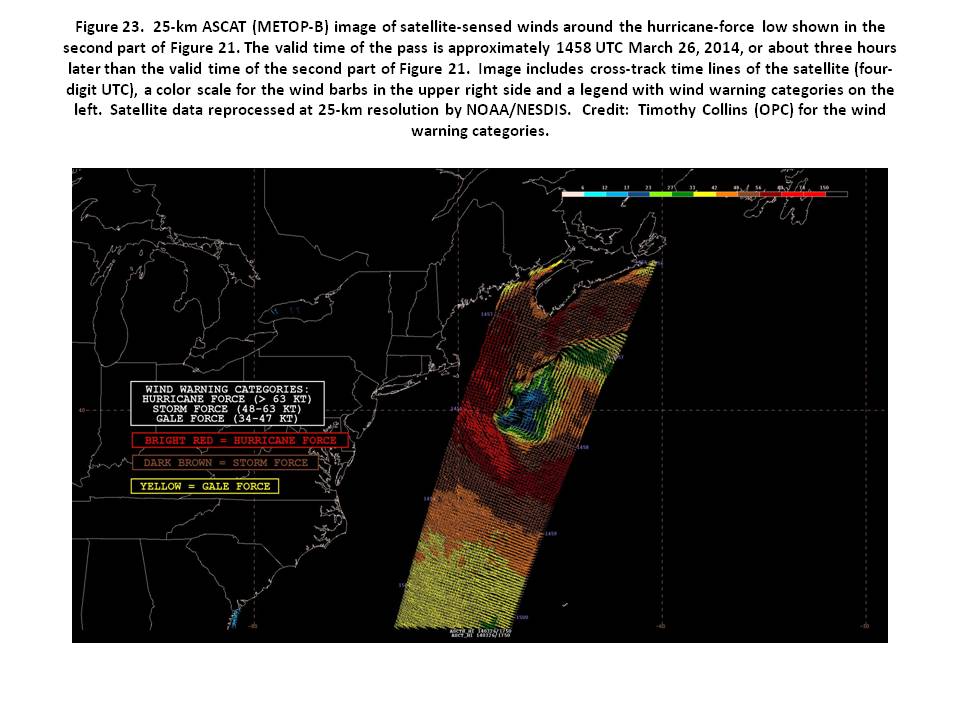
Southwestern Atlantic Storm, March 25-28: This event was the most significant of the period in the southwestern waters, an area of high traffic off the U.S. East Coast. It originated as a wave of low pressure in the Gulf of Mexico on the 24th and Figure 21 depicts the rapid initial intensification over 24 hours, when the pressure dropped 46 hPa. The 500 mb analysis (Figure 22) taken in the middle of this rapid deepening shows a high amplitude short wave trough developing negative tilt, associated with the surface low, and supported by a 500 hPa wind maximum. This is a favorable setup for intensification (Reference 5). The central pressure reached as low as 955 hPa six hours later. The ASCAT-B image in Figure 23 shows extensive coverage of storm force or greater wind barbs with the highest winds showing up as red on the southwest and west sides with winds to 75 kt appearing in a zoomed in version of the imagery. There was a report from Canada of peak wave heights at the buoy 44141 (43.0N 58.0W) of 29.3 m (96 feet) (E-mail communication, Reference 7). The cyclone subsequently moved north into the Labrador Sea and slowed down while weakening to a gale early on the 29th. Selected observations taken in this storm are listed in Table 3.
Northwestern Atlantic Storm, April 9-10: This short lived event originated as low pressure inland over southern Quebec on the afternoon of April 8th . The low emerged over the northern Labrador Sea and became quite intense with a central pressure down to 964 hPa at 0600 UTC on the 10th. ASCAT data was not available on the west side with sea ice coverage over the area but ASCAT winds were 30 to 45 kt on the east and southeast sides of the low. The Antwerpen Express (DGAF) near 42N 52W and the Integrity (WDC6925) near 41N 57W both reported southwest winds of 50 kt at 0600 UTC on the 10th with the latter vessel also reporting seas of 8.2 m (27 feet). The cyclone then weakened and moved north through the Davis Strait on the 11th.
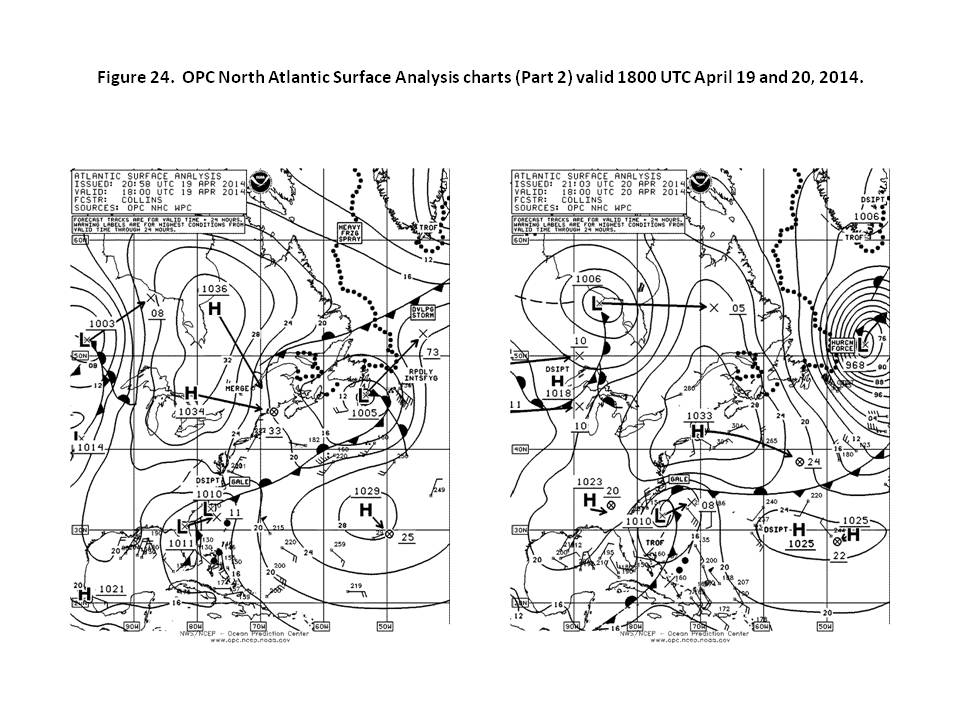
North Atlantic Storm, April 20-22: Developing low pressure moved off the southeast U.S. coast early on April 17th and rapidly intensified after passing the island of Newfoundland (Figure 24). The central pressure fell 37 hPa in the 24 hour period ending at 1800 UTC on the 20th. The cyclone attained a lowest central pressure of 966 hPa 12 hours later. ASCAT-A data for 1930 UTC on the 18th showed west to northwest winds of 50 kt at the edge of the data free swath at the center of the pass, with the pass likely missing the highest winds. The cyclone then turned east and slowed while drifting along 55N and weakening, and became absorbed by another cyclone passing to the south on the 25th.

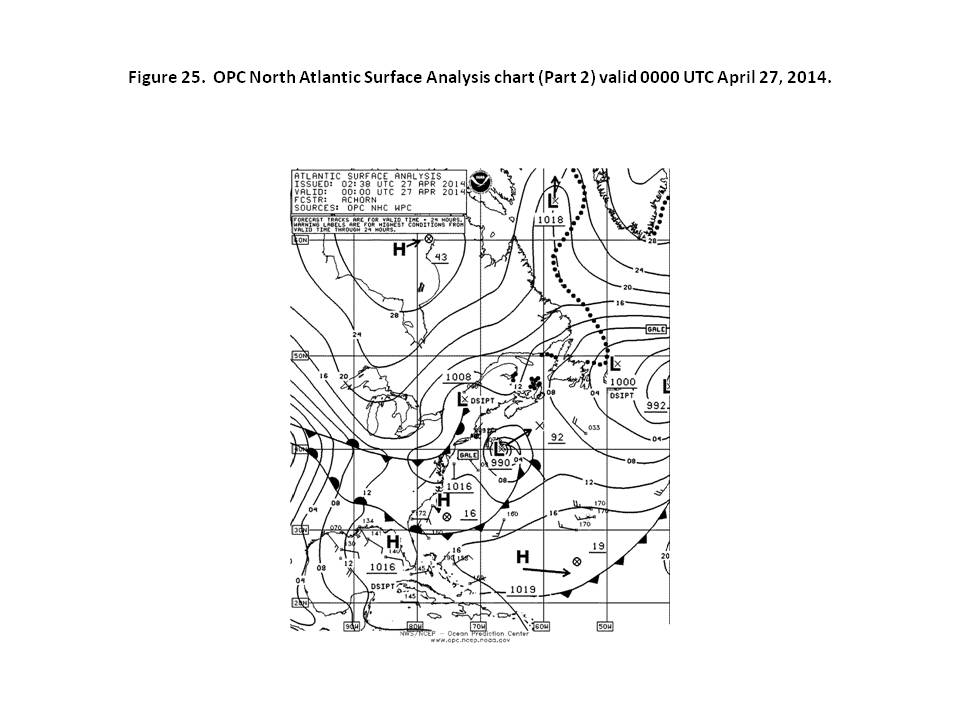
Gale off the U.S. East Coast, April 26-29: Figure 25 depicts a small and compact gale force low southeast of Nantucket. It formed on a front over the mid-Atlantic states 24 hours prior and rapidly developed offshore. Figure 25 shows it with its lowest central pressure. A NOAA Fisheries vessel, the Gordon Gunter (WTEO), sent an account of fast changing conditions experienced while working 80 nm from Nantucket. Conditions went from 30 kt and 3 m seas (10 ft) to 60-65 kt sustained winds with gusts to 110 and seas building to 7-9 m seas (25-30 ft) with waves as high as 12 m (40 ft) and near zero visibility within an hour. The heavy weather lasted two hours. The 25-km ASCAT-A image in Figure 26 shows just 50 kt near the center with directions appearing to be off. ASCAT is challenged by the scale and such smaller lows are a mystery prediction wise (E-mail communication, Reference 8). The cyclone subsequently drifted northeast with a slow weakening trend and made a cyclonic loop near 42N 60W late on the 27th and on the 28th before moving southeast and becoming absorbed by a new low forming to the northeast late on the 29th.
References:
- Sanders, Frederick and Gyakum, John R., Synoptic-Dynamic Climatology of the Bomb, Monthly Weather Review, October 1980.
- Ocean Surface Winds, http://manati.star.nesdis.noaa.gov/products.php
- Von Ahn, Joan. and Sienkiewicz, Joe, Hurricane Force Extratropical Cyclones Observed Using QuikSCAT Near Real Time Winds, Mariners Weather Log, Vol. 49, No. 1, April 2005.
- Saffir-Simpson Scale of Hurricane Intensity: http://www.nhc.noaa.gov/aboutsshws.php
- Sienkiewicz, Joe and Chesneau, Lee, Mariners Guide to the 500-Millibar Chart, Mariners Weather Log, Vol. 52, No. 3, December 2008.
- E-mail communication, Flights-update, Feb 15, 2014, Joseph Sienkiewicz confirmation from OSCAT of hurricane force winds in WSW flow (Feb 14) over warm Gulf Stream eddy.
- E-mail communication, Peak Wave at 44141 from March 27, Joseph Sienkiewicz from Chris Fogerty, Ph.D, Program Supervisor, Canadian hurricane Centre, Environment Canada, April 3, 2014.
- E-mail communication, LT Christine Schultz, NOAA Commissioned Corps Technical Operations Coordination Meteorologist, National Weather Service-Ocean Prediction Center, and Joseph Sienkiewicz, Chief Ocean Applications Branch, Ocean Prediction Center , April 30, 2014: Fast-changing conditions; Account from NOAA ship this weekend, NOAA Fisheries ship Gordon Gunter.