Atlantic Hurricane Season of 2002
John L. Beven II, Richard J. Pasch and Miles B. Lawrence, Hurricane SpecialistsTropical Prediction Center, National Hurricane Center, Miami, Florida
Introduction
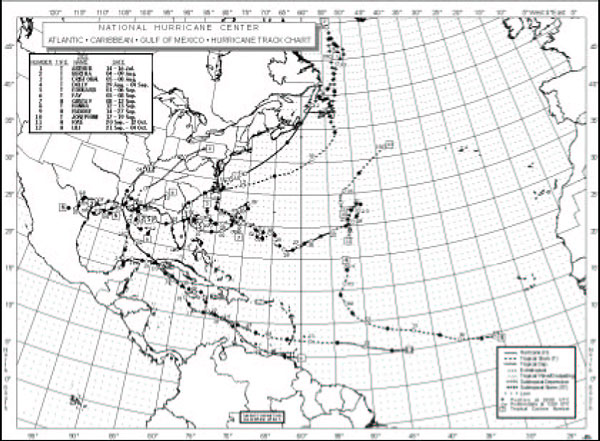 |
Figure 1. Atlantic tropical storms and hurricanes of 2002. |
There were 12 named tropical cyclones in the Atlantic basin in 2002, of which 4 became hurricanes (Table 1 and Figure 1). Two of these became major hurricanes - Category Three or higher on the Saffir-Simpson Hurricane Scale (96 kt or higher). Although the number of named storms in 2002 was above the long-term average of 10, the number of hurricanes was below the long-term average of 6. Another measure of seasonal activity, the "accumulated cyclone energy," which is the sum of the squares of the maximum wind speeds every six hours, also indicates below normal activity because there were many weak and short-lived tropical cyclones in 2002. There were also two tropical depressions that did not become storms.
Eight named tropical cyclones formed in September, making it the most active calendar month on record in the Atlantic. It is interesting that the first 2002 Atlantic hurricane did not occur until 11 September, the latest date for such an occurrence since the beginning of the reconnaissance aircraft era, 1944.
Eight tropical cyclones made direct hits in the United States. This included Lili, which was the first hurricane to make landfall in the United States since Irene in 1999. Overall, tropical cyclones caused 18 deaths. Total damage in the United States was about 1.2 billion dollars, mostly from Lili and Isidore. Isidore and Lili also caused extensive damage in western Cuba. Isidore produced extensive damage on the Yucatan Peninsula of Mexico, while Lili also caused extensive flood damage in Jamaica.
Table 1. Atlantic Tropical Storms and Hurricanes of 2002.
| Name | Class* | Dates** | Max.
winds (kt) |
Min.
Pressure (hPa) |
Direct
deaths |
U.S.
damage ($ millions) |
| Arthur | Tropical Storm | July 14-16 | 50 | 997 | ||
| Bertha | Tropical Storm | Aug. 4-9 | 35 | 1007 | 1 | |
| Cristobal | Tropical Storm | Aug. 5-8 | 45 | 999 | ||
| Dolly | Tropical Storm | Aug. 29-Sep. 4 | 50 | 997 | ||
| Edouard | Tropical Storm | Sep. 1-6 | 55 | 1002 | ||
| Fay | Tropical Storm | Sep. 5-8 | 50 | 998 | ||
| Gustav | Hurricane | Sep. 8-12 | 85 | 960 | 1 | 0.1 |
| Hanna | Tropical Storm | Sep. 12-15 | 50 | 1001 | 3 | 20 |
| Isidore | Hurricane | Sep. 14-27 | 110 | 934 | 4 | 330 |
| Josephine | Tropical Storm | Sep. 17-19 | 35 | 1009 | ||
| Kyle | Hurricane | Sep. 20-Oct. 12 | 75 | 980 | 5.0 | |
| Lili | Hurricane | Sep. 21-Oct 4 | 125 | 938 | 9 | 860 |
Table 1. Atlantic Tropical Storms and Hurricanes of 2002.
* Tropical Storm: wind speed of 34-63 kt. Hurricane: wind speed of
64 kt or higher.
**Dates begin at 0000 UTC and include tropical depression stage (wind
speed less than 34 kt).
Named Storms
Tropical Storm Arthur originated along a frontal trough in the eastern Gulf of Mexico, with the disturbance first noted on 9 July (Figure 1). The developing system moved northeastward and spread heavy rain across portions of north Florida, Georgia, and South Carolina. It became a tropical depression near the North Carolina coast on 14 July. Arthur accelerated northeastward and reached a peak intensity of 50 kt on 16 July while centered about 350 nmi south of Nova Scotia. Arthur moved over eastern Newfoundland on the next day as it became extratropical, producing gale force winds and about one inch of rain there. Several ships reported tropical storm winds in Arthur (Table 2), with the strongest being a 44-kt observation from the Weston (LAQF5) at 0000 UTC 16 July. Additionally, Canadian buoy 44141 reported 39-kt winds with a gust to 52 kt and a 997.5 hPa pressure at 1500 UTC that day.
Table 2. Selected ship and buoy reports with winds of at least 34 knots for Tropical Storm Arthur, 14-16 July 2002.
| Date/Time (UTC) | SHIP NAME
or call sign |
Latitude
(N) |
Longitude
(W) |
Wind
dir/speed (kt) |
Pressure
(hPa) |
| 16 / 0000 | Weston | 35.7 | 64.1 | 200 / 44 | 1011.5 |
| 16 / 0000 | Maesk Santes | 36.2 | 67.3 | 270 / 36 | 1011.0 |
| 16 / 1500 | Buoy 44141 | 42.1 | 56.2 | 060 / 39G52 | 997.5 |
| 16 / 1800 | Betsy | 39.8 | 53.2 | 220 / 37 | 1011.1 |
| 17 / 0600 | P6038 | 46.4 | 48.4 | 100 / 35 | 1017.0 |
| 17 / 1800 | Algofax | 45.7 | 59.9 | xxx / 41 | 1011.0 |
Table 2. Selected ship and buoy reports with winds of at least 34 knots for Tropical Storm Arthur, 14-16 July 2002.
Tropical Storm Bertha also formed along a frontal trough in the Gulf of Mexico. It first became a tropical depression just east of the mouth of the Mississippi River on 4 August ( Figure 1). The cyclone quickly became a tropical storm and moved west-northwestward over southeastern Louisiana by early the next day with 35-kt sustained winds. After weakening to a depression, Bertha's center moved southwestward, back over the Gulf of Mexico on 7 August and then moved inland over south Texas on 9 August. It dissipated over land later that day. NOAA buoy 42007 reported a 33-kt sustained wind at 2240 UTC 4 August and 0310 UTC 5 August, along with a gust to 43 kt at 0441 UTC 5 August. Waveland, Mississippi reported a gust to 36 kt. Bertha caused rainfalls of 5 to 10 inches over portions of Louisiana and Mississippi. The storm caused one death, a drowning in high surf in the Florida panhandle near Perdido Key State Park.
Tropical Storm Cristobal formed about 150 nmi off the coast of South Carolina on 5 August (Figure 1) within the same trough that produced Bertha. Winds reached a maximum of 45 kt while the tropical storm meandered southward and eastward for a few days. Cristobal was absorbed into another frontal zone and dissipated on 9 September. Two ships reported tropical storm winds in Cristobal that were considered reliable. The Overseas Joyce (WUQL) reported 41-kt winds at 1200 UTC 7 August and a pressure of 1006.4 hPa three hours earlier. The Judy Litrico (KCKB) reported 34-kt winds at 0000 UTC 7 August.
Tropical Storm Dolly was the first storm of the season to originate from a tropical wave, becoming a tropical cyclone on 29 August at a low latitude in the far eastern Atlantic Ocean ( Figure 1). Initially moving west-northwestward, Dolly gradually turned northward over the next five days as it moved into a weakness in the Atlantic subtropical high pressure ridge. Winds reached 50 kt on 30 August. However, strong vertical wind shear subsequently weakened the system to a remnant low on 4 September several hundred nautical miles northeast of the Leeward Islands.
Tropical Storm Edouard formed on 1 September from a non-tropical disturbance about 120 nmi east of Daytona Beach, Florida (Figure 1). The system made a clockwise loop off the northeast Florida coast, then headed toward Florida. Edouard unsteadily strengthened to a short-lived peak intensity of 55 kt on 3 September, but strong upper-level winds quickly caused weakening. The cyclone was barely of tropical storm intensity when it made landfall near Ormond Beach, Florida on the evening of 4 September. It crossed north-central Florida as a weak depression and then dissipated over the northeastern Gulf of Mexico on 6 September, when its remnants were entrained into the large circulation of Tropical Storm Fay centered off the Texas coast. A few ships encountered Edouard. The Kent Sprint (VGDX) reported 38-kt winds at 0900 UTC 3 September, while the Zim Pacific (4XFC) and the Zim Jamaica (4XFE) reported 36-kt and 35-kt winds at 1800 and 1200 UTC 2 September respectively. Patrick Air Force Base, Florida reported a gust to 34 kt. Edouard caused some flooding due to locally heavy rains over north-central Florida. There were no reported casualties, and damage was minor.
Tropical Storm Fay had its origins in a broad low pressure system over the western Gulf of Mexico. Reports from an Air Force Hurricane Hunter aircraft investigating the area on 5 September suggested that a tropical depression had developed about 95 nmi southeast of Galveston, Texas (Figure 1). The depression quickly strengthened into a tropical storm, and Fay reached its peak intensity of 50-kt the next day. After moving slowly and erratically, Fay headed toward the Texas coast. The storm made landfall on the morning of 7 September near Port O'Connor with 50 kt winds. After landfall, Fay weakened to a remnant low that meandered across southern Texas and northeastern Mexico until finally dissipating late on 10 September near Monterrey, Mexico. The only marine observations of tropical storm winds were from NOAA data buoys 42019 and 42035. The former reported 36-kt winds with a gust to 45 kt at 2000 UTC 6 September, along with a pressure of 999.6 hPa at 0100 UTC 7 September. The latter buoy reported a gust to 41 kt at 0300 UTC 7 September. There were numerous reports of tropical storm winds along the upper Texas coast, and there were two gusts to 80 kt near Freeport. Fay produced widespread copious rains and several tornadoes over portions of southern Texas and northeastern Mexico. However, there were no reports of casualties, and damage was apparently minor.
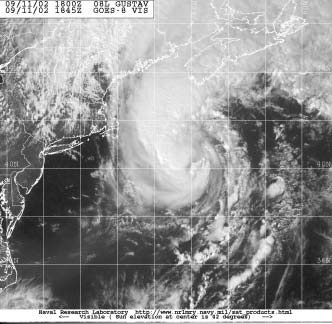 |
| Figure 2. GOES-8 visible images of Hurricane Gustav at 1845 UTC 11 September 2002. |
Hurricane Gustav initially formed as a subtropical depression on 8 September about 440 nmi south-southeast of Cape Hatteras, North Carolina (Figure 1). The cyclone moved northwestward and soon became a subtropical storm. Gustav turned northward and made the transition to a tropical storm before the center passed just east of Cape Hatteras on 10 September. It then turned northeastward into the Atlantic and strengthened into the first hurricane of the season the next day. Maximum winds reached 85 kt (Figure 2) before Gustav made landfall in eastern Nova Scotia as a hurricane with 80 kt winds early on 12 September. The system became extratropical later that day near western Newfoundland. Gustav affected many ships and buoys, with selected observations given in Table 3 The most notable observations were from the ship Tellus (WRYG), which reported 88-kt and 90-kt winds at 1500 and 1600 UTC 11 September. While these winds are reasonably consistent with the strength of Gustav at the time, the ship was far enough from the center that the speeds appear somewhat suspect. The oil rig WCY533 near Sable Island, Nova Scotia reported 74-kt winds and a 965.0 hPa pressure at 0300 UTC 12 September. Other noteworthy ship and buoy reports include a 55-kt wind reported by the Columbus Canterbury (ELUB8) near the North Carolina coast at 1900 UTC 10 September and a 964.3 hPa pressure from Canadian buoy 44142 at 2300 UTC 11 September. On land, the Cape Hatteras Coast Guard station reported a wind gust of 68 kt at 2130 UTC 10 September, and a wind gust of 66 kt occurred at Sable Island at 0414 UTC 12 September. There was one death directly attributed to Gustav: a swimmer at Myrtle Beach, South Carolina suffered injuries from high surf and died two days later. Damage in North Carolina was estimated at about $100,000. In Nova Scotia, some docks were damaged and trees were blown down.
Table 3. Selected ship and buoy reports with winds of at least 34 kt for Hurricane Gustav, 8-12 September 2002.
| Date/Time
(UTC) |
SHIP NAME
or call sign |
Latitude
(N) |
Longitude
(W) |
Wind
dir/speed (kt) |
Pressure
(hPa) |
| 09 / 1500 | P&O Nedlloyd Sydney | 34.0 | 76.2 | 010 / 45 | 1010.5 |
| 09 / 1800 | P&O Nedlloyd Sydney | 34.6 | 75.2 | 030 / 37 | 1007.5 |
| 10 / 1800 | Star Inventana | 32.6 | 72.3 | 250 / 35 | 1012.4 |
| 10 / 1800 | Charles Island | 33.9 | 72.8 | 140 / 35 | 1003.0 |
| 10 / 1900 | Columbus Canterbury | 35.5 | 75.0 | 090 / 55 | N/A |
| 11 / 0000 | Charles Island | 33.0 | 74.1 | 250 / 40 | 1001.5 |
| 11 / 0310 | Buoy 44001 | 34.7 | 72.7 | 185 / 36G46 | 999.0 |
| 11 / 0500 | Buoy 44014 | 36.6 | 74.8 | 330 / 35G44 | 991.6 |
| 11 / 0600 | WAAH | 35.8 | 72.5 | 220 / 52 | 988.5 |
| 11 / 1420 | Buoy 44004 | 38.5 | 70.5 | 340 / 44G62 | 979.0 |
| 11 / 1500 | Nedlloyd Holland | 37.8 | 66.9 | 210 / 54 | 990.5 |
| 11 / 1500 | Tellus | 38.0 | 68.1 | 150 / 88 | 978.0 |
| 11 / 1600 | Tellus | 38.0 | 68.2 | 240 / 90 | 982.3 |
| 11 / 1800 | Swan | 35.0 | 71.5 | 240 / 39 | 1003.7 |
| 11 / 2000 | Buoy 44011 | 41.1 | 66.6 | 315 / 44G61 | 973.1 |
| 12 / 0000 | Buoy 44142 | 42.5 | 64.0 | 300 / 44G60 | 971.5 |
| 12 / 0000 | P&O Nedlloyd Jakarta | 37.2 | 59.8 | 220 / 47 | 1005.0 |
| 12 / 0000 | Majestic Maersk | 40.7 | 61.6 | 220 / 40 | 988.0 |
| 12 / 0100 | Buoy 44137 | 41.8 | 60.9 | 220 / 47 | 985.0 |
| 12 / 0300 | WCY533 | 44.0 | 60.3 | 190 / 74 | 965.0 |
| 12 / 0600 | Buoy 44139 | 44.3 | 57.4 | 210 / 41 | 983.3 |
| 12 / 0600 | Choyang Zenith | 37.0 | 59.9 | 230 / 41 | 1004.5 |
| 12 / 0600 | YJRX2 | 44.2 | 59.6 | 240 / 55 | 978.7 |
| 12 / 1200 | Albatros | 44.1 | 63.8 | 320 / 48 | 993.2 |
| 12 / 1200 | Algofax | 46.6 | 59.5 | 290 / 43 | 976.0 |
| 12 / 1200 | 3FPK7 | 46.6 | 48.0 | 210 / 38 | 995.6 |
| 12 / 1500 | HP6038 | 46.4 | 48.4 | 190 / 40 | 994.7 |
| 12 / 1800 | Kometik | 43.4 | 53.9 | 230 / 55 | 992.0 |
| 12 / 1800 | Atlantic Concert | 46.3 | 50.2 | 160 / 36 | 990.9 |
| 13 / 0300 | HP6038 | 46.4 | 48.4 | 230 / 45 | 999.5 |
| 13 / 0600 | Atlantic Concert | 45.6 | 53.4 | 260 / 50 | 1004.2 |
| 13 / 0900 | 3FPK7 | 46.6 | 48.0 | 250 / 39 | 1005.7 |
| 13 / 1200 | Canmar Success | 49.7 | 45.7 | 200 / 42 | 1002.5 |
| 13 / 1800 | Canmar Success | 50.0 | 47.4 | 210 / 45 | 1005.8 |
Table 3. Selected ship and buoy reports with winds of at least 34 kt for Hurricane Gustav, 8-12 September 2002.
Tropical Storm Hanna formed in the Gulf of Mexico from the interaction of a tropical wave, an upper-level low, and a surface trough. Air Force reconnaissance aircraft observations indicate that a tropical depression developed early on 12 September about 250 nmi south of Pensacola, Florida (Figure 1). The system became a tropical storm early the next day. After moving slowly and erratically for a couple of days, Hanna turned northward toward the northern Gulf coast, ahead of an approaching midlevel trough. With maximum winds near 50 kt, the storm center passed over the southeastern tip of Louisiana early on 14 September and made a second landfall near the Mississippi-Alabama border later that morning. Hanna dissipated near the Alabama-Georgia border on 15 September, but its remnants continued northeastward across Georgia and the Carolinas. The only ship to report tropical storm winds in Hanna was the Nobel Star (KRPP), which reported 37-kt winds and a pressure of 1006.0 hPa at 0300 UTC 13 September. NOAA buoy 42003 reported 37-kt winds at 0750 UTC 13 September, while buoy 42007 reported 35-kt winds with a gust to 43 kt at 1010 UTC 14 September. On the coast, sustained winds of 47 kt were recorded at Pensacola, and a gust to 59 kt was measured at Pensacola Beach. Further inland, heavy rains occurred across the southeastern states with many accumulations of between 5 and 10 inches. The highest reported storm total, 15.56 inches, was from Donalsonville, Georgia. Three deaths in the Florida panhandle are attributed to rip currents generated by Hanna. The total damage, mainly agricultural losses, is estimated at $20 million.
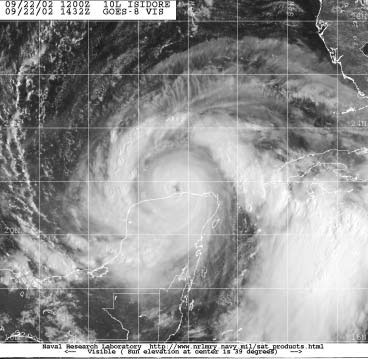 |
| Figure 3. GOES-8 visible images of Hurricane Isidore at 1432 UTC 22 September 2002. Image courtesy of the Naval Research Laboratory, Monterey, CA). |
Hurricane Isidore developed from a tropical wave into a tropical depression just east of Trinidad on 14 September (Figure 1), but degenerated back to a wave over the eastern Caribbean Sea the next day. The system again became a depression south of Jamaica on 17 September and strengthened into a tropical storm early the next day. The center of Isidore just missed Jamaica, then moved west-northwestward across the Cayman Islands and strengthened into a hurricane. Maximum winds reached 90 kt while it passed near the Isle of Youth, Cuba, and Isidore hit the western tip of mainland Cuba with 75-kt winds on 20 September. After striking Cuba, the hurricane moved over the Gulf of Mexico and strengthened to 110 kt while heading toward the Yucatan Peninsula (Figure 3). The hurricane turned southwestward and made landfall near Puerto Telchac on the northern coast of Yucatan on 22 September. For 24 to 36 hours, Isidore meandered over the northern Yucatan Peninsula while it weakened to a 35-kt tropical storm. It then moved northward over the Gulf of Mexico and made landfall early on 26 September just west of Grand Isle, Louisiana, with maximum winds near 55 kt. Weakening over land, Isidore produced torrential rains as it moved across the southeastern states. It became an extratropical cyclone over Pennsylvania on 27 September and was then absorbed into a frontal zone.
Isidore affected many ships and buoys, especially over the Gulf of Mexico where the cyclone's circulation became very large. A selection of the numerous observations is given in Table 4 The strongest winds were observed by the Deepwater Pathfinder, which reported 55-kt winds and a gust to 71 kt at 1743 UTC 25 September. NOAA buoy 42007 reported 46-kt winds with a gust to 60 kt at 0310 UTC 26 September. In Cuba, Isabel Rubio reported 54-kt sustained winds with a gust to 74 kt. Along the U. S. coast, the Coastal Marine Automated Network (C-MAN) Station near Burrwood, Louisiana reported 46 kt winds with a gust to 59 kt at 2300 UTC 25 September, along with a pressure of 984.7 hPa at 0900 UTC 26 September. The C-MAN station at Grand Isle reported a gust to 62 kt at 0440 UTC 26 September. Tropical storm winds were reported elsewhere along the coast from central Louisiana to the western Florida Panhandle. Isidore caused four deaths: a rip current drowning in Louisiana, a storm surge drowning in Mississippi, a third from a tree falling on a car in eastern Mississippi, and a fourth from a car being driven into 10 ft of water in Clarksville, Tennessee. Very heavy rains caused damage in Jamaica. Isidore caused major damage to the Yucatan Peninsula and western Cuba. In the United States, the total damage due to Isidore is estimated to be $330 million, mainly in Louisiana.
Table 4. Selected ship and buoy reports with winds of at least 34 kt for Isidore, 14-27 September, 2002.
| Date/Time
(UTC) |
SHIP NAME
or call sign |
Latitude
(N) |
Longitude
(W) |
Wind
dir/speed (kt) |
Pressure
(hPa) |
| 19 / 0600 | Maasdam | 18.6 | 78.8 | 150 / 46 | 1004.0 |
| 20 / 0200 | Explorer of the Seas | 25.0 | 80.0 | 140 / 33 | 1012.8 |
| 20 / 0600 | C6FM7 | 22.7 | 87.4 | 100 / 35 | 1006.0 |
| 20 / 2100 | P&O Nedlloyd Jakarta | 24.5 | 83.4 | 080 / 37 | 1005.0 |
| 20 / 2100 | Courtney L | 20.2 | 81.1 | 230 / 35 | 1005.1 |
| 21 / 0600 | C6MF5 | 23.1 | 80.6 | 100 / 40 | 1010.2 |
| 21 / 1200 | Happy River | 20.8 | 83.8 | 150 / 39 | 1002.0 |
| 21 / 1200 | Rhapsody of the Seas | 24.1 | 87.7 | 050 / 38 | 1002.0 |
| 22 / 0000 | Levantgracht | 21.5 | 84.7 | 180 / 39 | 1000.0 |
| 22 / 0900 | Frances L | 23.4 | 85.7 | 100 / 44 | 999.4 |
| 22 / 1200 | C6FM6 | 25.0 | 89.7 | 050 / 42 | 1003.0 |
| 23 / 1200 | Advantage | 26.6 | 89.5 | 090 / 40 | 1005.5 |
| 23 / 1500 | VSCX4 | 26.7 | 90.1 | 070 / 37 | 1010.4 |
| 23 / 1500 | P&O Nedlloyd Vera Cruz | 20.0 | 95.5 | 320 / 45 | 1006.9 |
| 23 / 1800 | P&O Nedlloyd Vera Cruz | 19.9 | 95.6 | 310 / 41 | 1005.0 |
| 24 / 1100 | Bonn Express | 25.0 | 84.9 | 130 / 35 | 1007.3 |
| 24 / 1200 | C6FM6 | 26.9 | 88.5 | 050 / 53 | 1006.0 |
| 24 / 1200 | Celebration | 27.2 | 90.5 | 040 / 44 | N/A |
| 24 / 1800 | Lykes Navigator | 27.7 | 89.0 | 090 / 44 | 1005.5 |
| 24 / 1800 | Discoverer Enterprise | 28.2 | 88.4 | 040 / 34 | 1006.0 |
| 24 / 2100 | P&O Nedlloyd Vera Cruz | 19.7 | 94.4 | 280 / 47 | 1002.7 |
| 25 / 0300 | SeaLand Pride | 27.9 | 92.4 | 040 / 37 | 1005.0 |
| 25 / 0350 | Buoy 42001 | 25.9 | 89.7 | 115 / 39G52 | 998.5 |
| 25 / 0700 | Bonn Express | 27.3 | 91.4 | 050 / 37 | 1001.2 |
| 25 / 0900 | P&O Nedlloyd Vera Cruz | 20.0 | 93.9 | 290 / 44 | 1004.1 |
| 25 / 0940 | Buoy 42002 | 25.2 | 94.4 | 335 / 36G44 | 1001.2 |
| 25 / 0940 | Buoy 42003 | 25.9 | 86.0 | 180 / 41G55 | 1004.5 |
| 25 / 1500 | Bonn Express | 27.6 | 93.1 | 320 / 43 | 1002.7 |
| 25 / 1500 | VSCX4 | 27.5 | 94.4 | 030 / 35 | 1006.5 |
| 25 / 1743 | Deepwater Pathfinder | 26.5 | 87.7 | 130 / 56G71 | 1005.0 |
| 25 / 1800 | Overseas Harriet | 27.6 | 85.1 | 130 / 37 | 1008.3 |
| 25 / 1800 | Celebration | 22.8 | 85.1 | 160 / 40 | 1005.0 |
| 25 / 2100 | C6FM7 | 27.8 | 94.1 | 080 / 35 | 999.0 |
| 25 / 2100 | R. Hal Dean | 28.9 | 87.2 | 120 / 39 | 1000.0 |
| 25 / 2100 | LANR5 | 27.0 | 94.2 | 010 / 37 | 1001.9 |
| 25 / 2300 | Discoverer Enterprise | 26.9 | 86.4 | 160 / 45 | 992.0 |
| 26 / 0000 | Jo Spruce | 27.5 | 87.5 | 130 / 37 | 995.6 |
| 26 / 0000 | Frances L | 25.3 | 87.0 | 180 / 45 | 1008.5 |
| 26 / 0000 | Overseas Harriet | 27.7 | 85.8 | 130 / 38 | 1002.7 |
| 26 / 0030 | Buoy 42040 | 29.2 | 88.2 | 100 / 38G40 | 995.1 |
| 26 / 0200 | Bonn Express | 27.5 | 94.9 | 340 / 35 | 1004.9 |
| 26 / 0300 | R. Hal Dean | 28.8 | 87.1 | 120 / 50 | 995.4 |
| 26 / 0310 | Buoy 42007 | 30.1 | 88.8 | 090 / 46G60 | 995.3 |
| 26 / 0600 | Fairload | 26.6 | 84.4 | 140 / 41 | 1006.8 |
| 26 / 0600 | Overseas Harriet | 28.0 | 85.4 | 130 / 42 | 1003.5 |
| 26 / 0600 | Melbourne Star | 25.8 | 86.6 | 180 / 34 | 1000.8 |
| 26 / 0600 | R. Hal Dean | 28.8 | 87.0 | 140 / 49 | 995.0 |
| 26 / 0710 | Buoy 42041 | 27.5 | 90.5 | 275 / 34G43 | 989.3 |
| 26 / 0800 | Buoy 42039 | 28.8 | 86.1 | 140 / 36G45 | 998.0 |
| 26 / 1200 | Frances L | 29.2 | 87.6 | 150 / 36 | 994.0 |
Table 4. Selected ship and buoy reports with winds of at least 34 kt for Isidore, 14-27 September, 2002.
Tropical Storm Josephine formed along a decaying frontal zone about 750 nmi east of Bermuda on September 17 (Figure 1). The tropical cyclone moved slowly north-northwestward to northward for about a day and strengthened to a minimal tropical storm very early on 18 September. Soon thereafter, Josephine accelerated northeastward in the flow ahead of a deep-layer mid-latitude trough. The system lost its tropical characteristics and merged with a larger extratropical low and frontal system on 19 September.
The Cool Express (PDKK) reported 37 kt winds at 0300 UTC 18 September. As Josephine became extratropical, the Albatros (C6LV3) reported 50-kt winds at 1200 UTC 19 September.
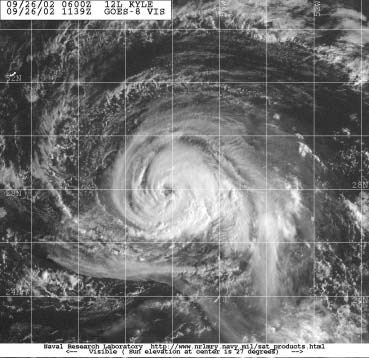 |
Figure 4. GOES-8 visible images of Hurricane Kyle and 1139 UTC 26 September 2002. |
Hurricane Kyle had a life span of 22 days, the third longest on record for an Atlantic tropical cyclone, exceeded only by Ginger of 1971 and Inga of 1969. It developed from a non-tropical low about 715 nmi east-southeast of Bermuda on 20 September (Figure 1). During its long track, Kyle strengthened (or re-strengthened) to a tropical storm on four different occasions, and it became a hurricane over open water, from 25-28 September, with winds reaching 75 kt (Figure 4). Kyle moved erratically, but generally westward until 11 October, when the storm turned northward and northeastward and made landfall on the South Carolina and North Carolina coasts with winds to 40 kt. Associated tornadoes caused over $2 million dollars damage in North Carolina. Kyle merged with a cold front the next day.
While Kyle was very long-lived for the most part it stayed away from the primary shipping lanes. The most significant ship report was from a ship with the call sign ELZA8 (name unknown), which reported 42 kt winds at 1500 UTC 30 September. Other selected observations are included in Table 5 Near the coast, the C-MAN station at Diamond Shoals, North Carolina reported 41 kt sustained winds with a gust to 48 kt at 0640 UTC 12 October. Wind gusts of 35-45 kt were reported along other portions of the North and South Carolina coasts.
Table 5. Selected ship reports with winds of at least 34 kt for Hurricane Kyle, 20 September - 12 October 2002.
| Date/Time (UTC) | SHIP NAME
or call sign |
Latitude
(N) |
Longitude
(W) |
Wind
dir/speed (kt) |
Pressure
(hPa) |
| 25 / 0900 | LATU5 | 33.5 | 55.6 | 030 / 40 | 1019.6 |
| 26 / 0600 | Prince of Waves | 25.1 | 58.2 | 230 / 36 | 1008.0 |
| 29 / 0000 | EWL Venezuela | 23.5 | 65.4 | 270 / 37 | 1011.0 |
| 30 / 1500 | ELZA8 | 33.5 | 65.0 | 050 / 42 | 1017.2 |
| 02 / 0000 | Cleveland | 26.9 | 66.5 | xxx / 35 | 1010.0 |
| 12 / 1200 | Titus | 37.1 | 74.1 | 090 / 35 | 1012.5 |
| 12 / 1200 | Texas | 39.9 | 68.7 | 090 / 41 | 1020.4 |
Table 5. Selected ship reports with winds of at least 34 kt for Hurricane Kyle, 20 September - 12 October 2002.
Hurricane Lili's track began on 21 September, when a depression formed in the central tropical Atlantic (Figure 1). Lili swept across the Windward Islands on 23 September as a developing tropical storm and left four dead in St. Vincent from mud slides. After weakening back to an open wave in the central Caribbean Sea, Lili again became a tropical storm on 27 September. The storm's center took a slow jog around the north coast of Jamai a from 28-30 September and dumped heavy rains there, and to a lesser extent, over southern Haiti and eastern Cuba. Lili hit western Cuba on 1 October with winds to 90 kt.
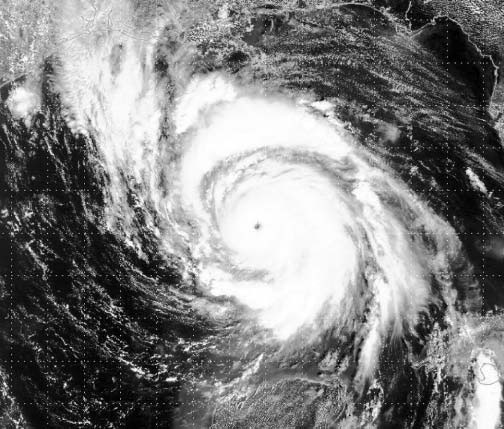 |
Figure 5. TERRA/MODIS visible images of Hurricane Lili at 1638 UTC 2 October 2002 Image courtesy of NASA and the LSA Earth Scan Laboratory. |
Lili moved to the central Gulf of Mexico where winds quickly strengthened to 125 kt, Category Four intensity on the Saffir-Simpson Hurricane Scale (Figure 5). But the wind speed decreased even faster than it had increased. Lili made landfall with sustained winds of 80 kt on the coast of Louisiana to the south of Intracoastal City on 3 October. Weakening over land, Lili merged with an extratropical low over the east-central United States the next day.
Lili affected several ships and buoys, with selected observations included in Table 6. The most significant observation was from NOAA buoy 42001, which was just outside of the eye of Lili near the time of peak intensity. The buoy reported sustained winds of 98 kt and a gust to 130 kt at 2010 UTC 2 October, which are the strongest winds ever reported by a National Buoy Data Center buoy. The lowest reported pressure was 956.1 hPa ten minutes before the maximum winds occurred. In Cuba, Francia reported 87-kt sustained winds with a gust to 98 kt. Along the U. S. coast, an automated station run by Louisiana State University reported 63-kt sustained winds, while Intracoastal City reported a gust to 104 kt .In addition to the four deaths in the Windward Islands, four also died in Jamaica, where flood waters swept them away. Flood damage in Jamaica was compounded by earlier heavy rain from Hurricane Isidore. There were news reports of wind damage at Cayman Brac in the northeastern Cayman Islands. Lili cut a swath of destruction across extreme western Cuba. There was a death in the province of Pinar del Rio. In Louisiana, there was a trail of wide- spread wind and flood damage. The total U.S. property damage estimate is 860 million dollars.
Table 6. Selected ship and buoy reports with winds of at least 34 kt for Hurricane Lili, 21 September - 4 October 2002.
| Date/Time
(UTC) |
SHIP NAME
or call sign |
Latitude
(N) |
Longitude
(W) |
Wind
dir/speed (kt) |
Pressure
(hPa) |
| 24 / 1200 | Paradise | 17.0 | 68.5 | 100 / 45 | 1015.0 |
| 28 / 1200 | Kota Pertama | 19.4 | 74.3 | 110 / 73 | 1008.7 |
| 01 / 1800 | Chemical Pioneer | 24.4 | 82.2 | 120 / 39 | 1012.1 |
| 02 / 0300 | SeaLand Quality | 24.7 | 84.1 | 100 / 38 | 1010.0 |
| 02 / 0720 | Buoy 42003 | 25.9 | 86.0 | 115 / 36G49 | 1009/6 |
| 02 / 1200 | Strong Virginian | 23.8 | 86.8 | 180 / 36 | 1005.2 |
| 02 / 1500 | ELYN2 | 21.0 | 85.6 | xxx / 82 | 1014.5 |
| 02 / 1800 | Strong Virginian | 24.7 | 87.8 | 170 / 40 | 1007.1 |
| 02 / 2010 | Buoy 42001 | 25.9 | 89.7 | xxx / 98G130 | 956.1 |
| 03 / 0220 | Buoy 42041 | 27.5 | 90.5 | 095 / 56G73 | 986.5 |
| 03 / 0300 | Lykes Discoverer | 29.0 | 88.5 | 100 / 41 | 1009.2 |
| 03 / 0900 | Strong Virginian | 26.1 | 90.2 | 190 / 35 | 1006.0 |
| 03 / 0900 | Lykes Discoverer | 28.6 | 87.4 | 120 / 36 | 1009.1 |
| 03 / 1140 | Buoy 42007 | 30.1 | 88.8 | 115 / 36G47 | 1008.6 |
| 03 / 1500 | Mayaguez | 28.3 | 93.0 | 300 / 37 | 1003.0 |
Table 6. Selected ship and buoy reports with winds of at least 34 kt for Hurricane Lili, 21 September - 4 October 2002.
III. Tropical Depressions
Two other tropical depressions occurred over the Atlantic during the 2002 season (Figure. 6). Tropical Depression Seven briefly appeared over the central Atlantic on 7-8 September. Tropical Depression Fourteen moved slowly northeastward across the northwestern Caribbean Sea from 14-16 October, spreading locally heavy rains across portions of Jamaica, Cuba, and the Cayman Islands.
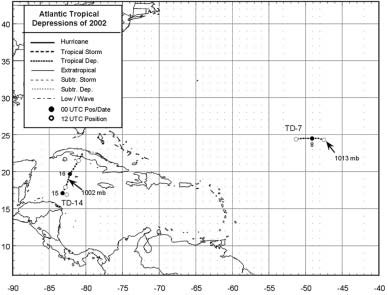 |
Figure 6. - Atlantic tropical depressions of 2002. |
Page last modified: