The Impact of QuikSCAT Winds on the Issuance of Marine Wind Warnings
Joan Ulrich Von Ahn,STG/DSTI, Ocean Prediction Center,
National Centers for Environmental Prediction
Introduction
The primary responsibility of The Ocean Prediction Center (OPC) at the National Centers for Environmental Prediction (NCEP) is the issuance of marine warnings and forecasts for maritime users in order to foster the protection of life and property, safety at sea, and the enhancement of economic opportunity. The issuance of these warnings (Gale, Storm, Hurricane Force) is dependant on a good network of surface wind observations. Until recently, the primary sources of surface wind observations over the oceans have been ship reports through the Volunteer Observing Ship (VOS) program and data buoys. Since ships tend to avoid areas of inclement weather and the current network of data buoys is nowhere near optimal density there is quite a substantial data void over the open ocean. To fill this void, many attempts have been made to measure surface wind speed and direction using remote sensing instruments flown onboard satellites. The most recent has been the SeaWinds Scatterometer on the National Aeronautics and Space Administration (NASA) Quick Scatterometer Spacecraft (QuikSCAT) which was launched in June 1999. The instruments on QuikSCAT can acquire hundreds of times more observations of surface wind speed and direction each day than can ships and buoys combined. By providing continuous, high resolution measurements of both wind speed and direction, regardless of weather conditions, QuikSCAT has been able to fill in much of the data void over the oceans. The data was incorporated into the National Oceanic and Atmospheric Administrations (NOAA) operational global weather analysis and forecast systems model (GFS) in July 2001. Since October 2001 the forecasters at the OPC have had near real time access to this data right at their operational computer workstations, enabling them to use QuikSCAT winds in the forecast process. This inclusion has proven to be invaluable and has resulted in an increase in the number of wind warnings issued by the OPC. During the fall of 2002, a month long study was conducted to quantify this impact. After a brief description of the history and background of scatterometers, this article will describe the results of this study.
History of Scatterometers
During World War II it was noted that radar measurements over the oceans contained noise or Asea clutter. It wasnt until the 1960's that this noise was related to wind velocity.
Scatterometers are microwave radar sensors that were developed to measure this type of backscattering from an aircraft or a satellite. Scatterometers were first flown in space on board the Skylab missions in 1973 and 1974. In 1978, the Seasat-A Satellite Scatterometer (SASS) was flown on the Seasat-A satellite. However, due to a malfunction the mission only lasted four months. The European Space Agency flew a Scatterometer (SCAT) onboard its European Remote Sensing Satellite-1 (ERS-1) in 1991. Data was gathered for an 8-year period but coverage was limited due to the design of the scatterometer. In 1998, The NASA Scatterometer (NSCAT) was launched onboard the Advanced Earth Observing Satellite (ADEOS-I) and provided 90% coverage of the ocean areas within a 2-day period until the satellite lost power in 1997. The Quick Scatterometer Satellite (QuikSCAT) carrying the SeaWinds Scatterometer was launched in 1998 to fill the gap created when NSCAT data was no longer available. QuikSCAT provides complete coverage of the world's ocean surface every two days. Due to the success of NSCAT and QuikSCAT another SeaWinds Scatterometer was launched on the ADEOS-II Satellite in December 2002.
How QuikSCAT Works
Scatterometers work on the basic principle that the roughness of the ocean surface is related to the speed and direction of the wind above that surface. The Scatterometer transmits radar pulses to the ocean surface. These pulses are then reflected (backscattered) from the ocean surface back to the satellite and converted to wind speed and direction by computer algorithms. QuikSCAT orbits the earth in a near polar (sun synchronous) orbit every 101 minutes at an altitude of 500 miles. The antenna rotates 18 times per minute measuring an 1800 km wide swath and alternates between transmitting and receiving pulses about 200 times per second. An automated analysis scheme calculates the speed and direction of the surface wind from the backscattered pulses. The accuracy of the measurements is 2 meters per second for wind speeds from 3 to 20 meters per second, while the wind direction is accurate to 20 degrees. Despite the vast coverage provided by QuikSCAT there are some limitations. Since QuikSCAT is in a near polar orbit data is not always available where and when it is needed. Furthermore due to contamination of the data from rain, the wind speed and direction may not always be accurate in areas of rainfall.
| Date of Mission | Satellite | Instrument | Facts |
| 1973-74 | Skylab |
|
|
| 1978 | Seasat-A |
|
|
| 1991 | European Space Agency Remote Sensing Satellite-1 (ERS-1) |
|
|
| 1996 | Advanced Earth Observing Satellite (ADEOS-I) |
|
|
| 1999 | QuikScatterometer Satellite (QuikSCAT) |
|
|
| 2002 | ADEOS-II |
|
|
QuikSCAT winds in the Ocean Prediction Center
Description of OPC
The OPC is a part of the NCEP located at the NOAA Science Center in Camp Springs, MD. The OPC is operational 24 hours per day, 7 days per week. The staff consists of 20 meteorologists along with small technical development and administrative branches. The primary responsibility of the OPCis the issuance of marine warnings, forecasts, and guidance in text and graphical format for maritime users for the protection of life and property, safety at sea, and the enhancement of economic opportunity. These products cover the North Pacific and North Atlantic Oceans on three scales: high seas, regional and offshore and are prepared and disseminated on a fixed, recurring schedule. The OPC also quality controls marine observations globally from ship, buoy, and automated marine observations for gross errors prior to being assimilated into computer model guidance.
|
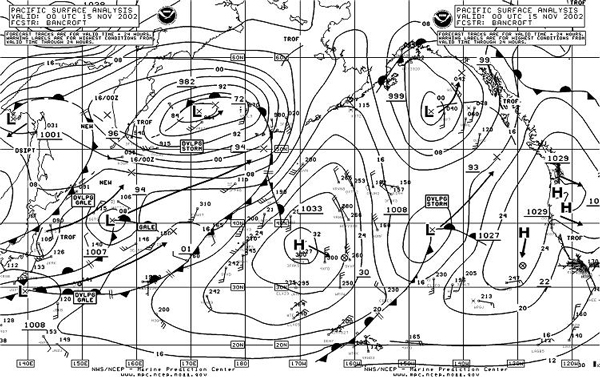
Figure 1 - Gale (34-47 knots), Storm (48-63 knots), Hurricane (64 knots or greater) |
The Ocean Prediction Center Forecast Process
OPC produces the surface analyses for the North Pacific and North Atlantic Oceans four times each day at 00UTC, 06UTC, 12UTC, and 18UTC (see figure 1). These manually produced charts are prepared from a blend of objective and subjective methods. They depict surface features including isobars, the current and 24hr forecast positions of High and Low pressure centers, fronts and troughs and areas of gale, storm or hurricane force winds. To prepare the surface analysis, the OPC forecasters look at observational data from satellites, ships, buoys and other NCEP surface analyses using The National Centers - Advanced Weather Interactive Processing Systems (N-AWIPS) workstations. When QuikSCAT data was made available on the workstations in 2001 they were able to access the near real-time surface winds over much of their forecast areas. Based on the wind fields from the GFS model, data buoys, ship observations and QuikSCAT wind data, the OPC forecaster determines where the areas of Gale, Storm and Hurricane Force winds are occurring and places the appropriate warning label on the surface analysis.
The Impact of QuikSCAT on the forecast process
During the late fall of 2002 a month long study was conducted to quantify the effects of QuikSCAT wind data on the issuance of marine warning labels on the surface analyses produced by OPB. Forecasters were provided shift logs and were asked to note when QuikSCAT winds were the deciding factor in the issuance or change of a warning label.
The data was collected for the Atlantic High Seas and the Pacific High Seas from 15 NOV 2002 thru 15 DEC 2002 for four forecast periods daily (00UTC, 06UTC, 12UTC, 18UTC) Forecasters were asked to document how many times they used QuikSCAT winds during their shift according to the following categories:
Did they use QuikSCAT to: Upgrade to Gale, Upgrade to Storm, Upgrade to Hurricane Force, Downgrade from Gale, Downgrade from Storm, Downgrade from Hurricane Force, or Maintain current warning?
At the end of the test month the data was collected and entered into a spreadsheet for analysis. The total number of warning labels issued for each forecast area was tabulated. Then the total number of warning labels was further broken down by warning type (Gale, Storm, Hurricane Force.) This dataset was labeled The Number of Warning labels Issued With QuikSCAT Winds. Using the forecasters shift logs and the corresponding surface maps any warning labels that were issued using QuikSCAT Data were identified.
The warning label was then adjusted to simulate the warning decision that would have been made by the forecaster if he/she did not have access to the QuikSCAT. This second dataset was labeled The Number of Warnings Issued Without QuikSCAT Winds.
Example: ship observations indicate gale force winds while the QuikSCAT pass showed an area of storm force winds. The forecaster issued a storm force warning label. So for the dataset of warnings issued with QuikSCAT winds the warning label was counted as a storm force category. In this case if the forecaster did not have QuikSCAT winds available he would have issued a gale force warning label. So for the dataset of warnings issued without QuikSCAT winds the warning label was changed from storm force to gale and was counted as a gale label.
Results
When QuikSCAT winds were used the number of warning labels issued increased by 30% in the Atlantic and 22% in the Pacific (see figure 2).
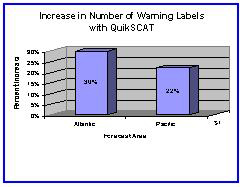 |
Figure 2 |
In the Atlantic 397 warnings were issued using QuikSCAT winds while only 279 warnings would have been issued if QuikSCAT were not available. In the Pacific 519 warnings were issued with QuikSCAT while only 406 would have been issued without QuikSCAT (see figure 3).
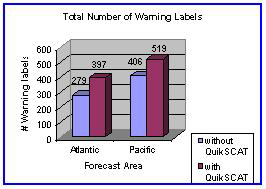 |
Figure 3 |
The greater impact in the Atlantic was attributed to the difference in the distribution of the shipping routes in the Atlantic and Pacific (see figure 4).
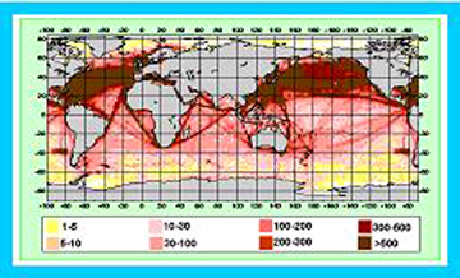 |
Figure 4 |
In the North Pacific the shipping routes are more uniformly distributed throughout the area, while in the North Atlantic there is a definite void north of 55N.
When the data was analyzed according to warning type it was apparent that QuikSCAT had a greater impact with the more significant warning types (see figures 5a, 5b). The greatest impact was noted in the Pacific with a 42% increase in the issuance of Hurricane Force Warnings.
|
|
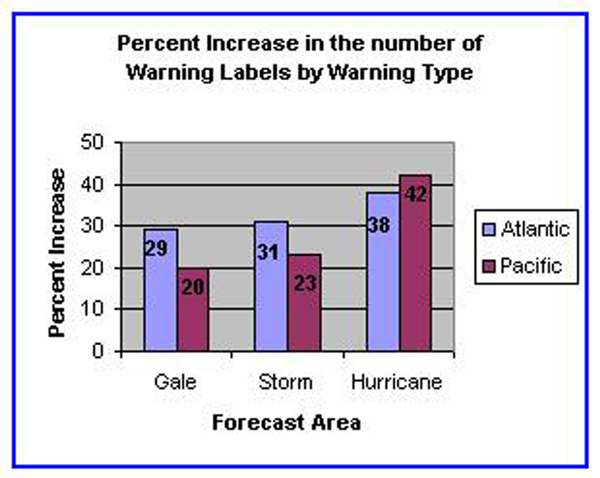
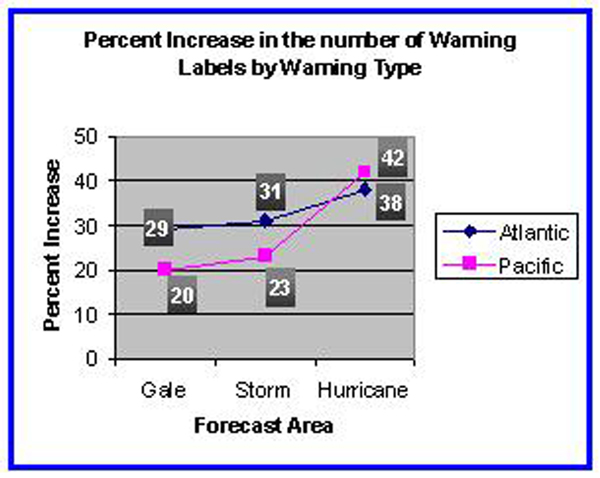
This information infers that prior to the availability of QuikSCAT winds many storm and hurricane force winds may have been missed since ship observations in those areas were lacking.
Case Studies
Several examples were chosen to demonstrate the types of impact QuikSCAT had on the forecaster's warning decision.
The first 3 examples demonstrate how QuikSCAT was used to upgrade storm intensity.
In the first example, the forecaster analyzed a low-pressure center of 984hPa at 46N 52W on the surface analysis for 04 Dec 2002 12UTC (see Figures 6a & 6b).
|
|
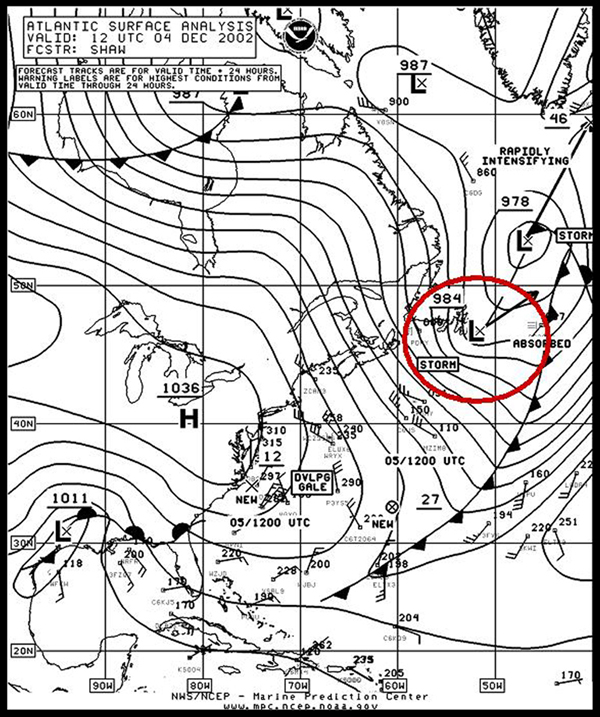
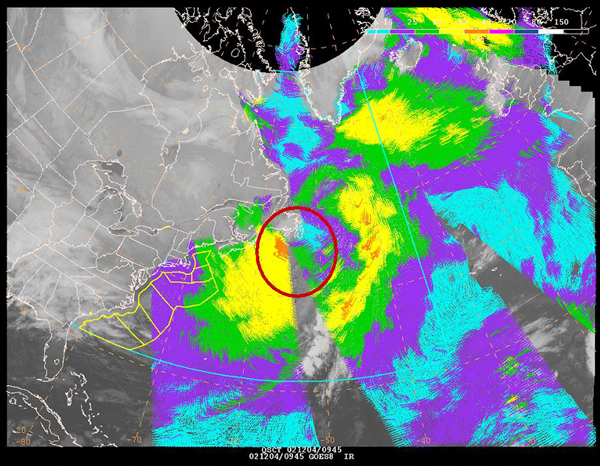
Ships in the vicinity of the low all reported observations of 35KT. or less indicating a Gale label. The QuikSCAT pass from 0945UTC clearly shows an area of storm force winds around the Low south of Newfoundland. The data was not rain-flagged so the forecaster upgraded his warning label one category to Storm Force.
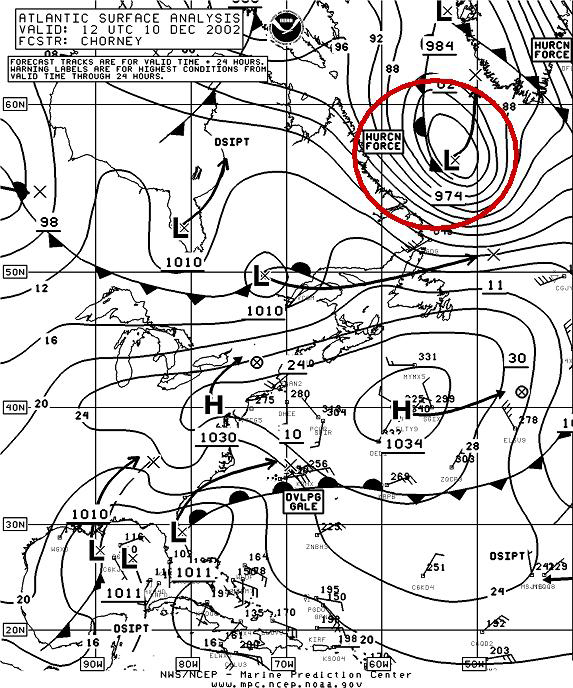
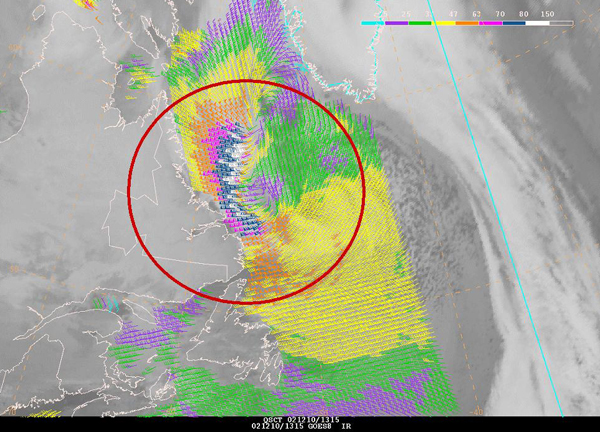
In example 2, (Figures 7a & 7b) 974hPa Low was centered at 56N 52W 10Dec 2002 at12UTC. Very few ship reports were available and they all had observations of 40KT. or less, indicating Gale conditions. Based on this information alone, the forecaster would have put a gale label on the surface analysis. The QuikSCAT pass from 10Dec 2002 1045UTC depicted an area of Hurricane force winds. Although the winds were rain-flagged the data did not appear to be contaminated so the forecaster upgraded his warning label two categories to Hurricane Force.
|
|
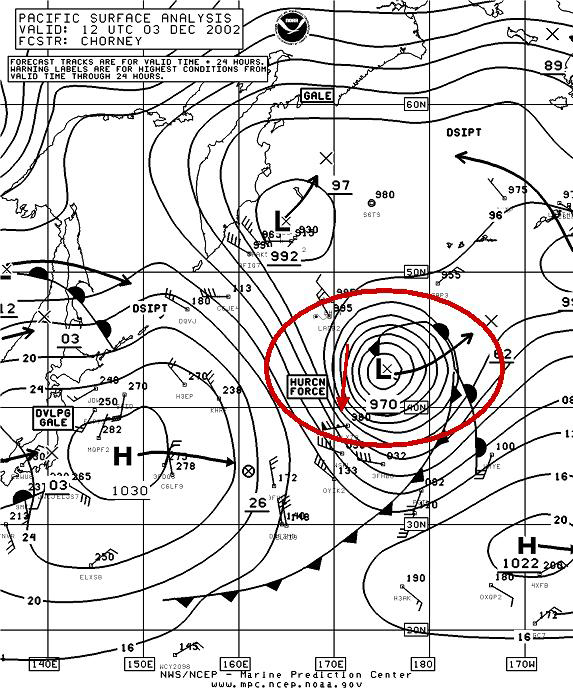
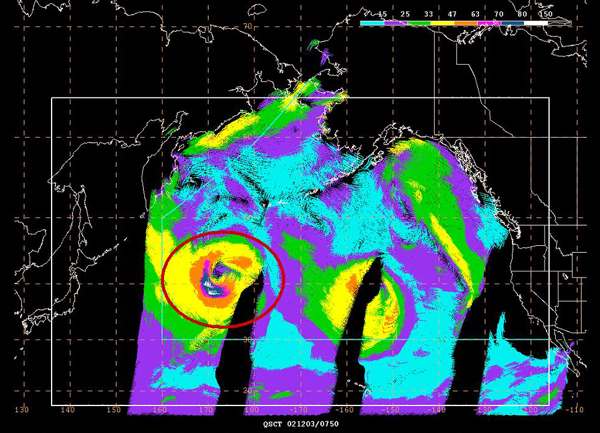
The third (Figures 8a & 8b) example was another of upgrading from Gale to Hurricane Force. Low pressure in the Pacific Ocean 12UTC Dec 3 2002 was located at 43N 175E with a central pressure of 970hPA. Ship observations were all 40kt. or less except for one 60KT report. The forecaster would not have placed a Hurricane Force warning with this low based on only one report- a Gale label would have been placed. The QuikSCAT pass from 0750UTC indicated an area of Hurricane force winds in the vicinity of this ship report. Based on this the forecaster upgraded 2 categories to Hurricane Force.
|
|
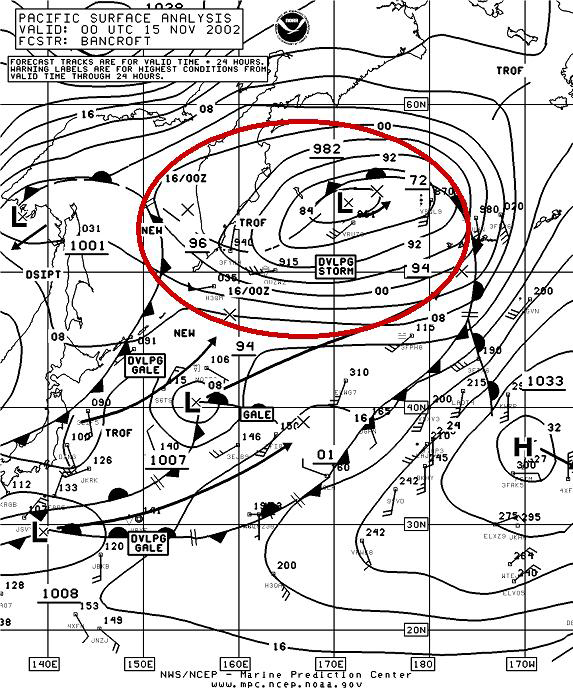
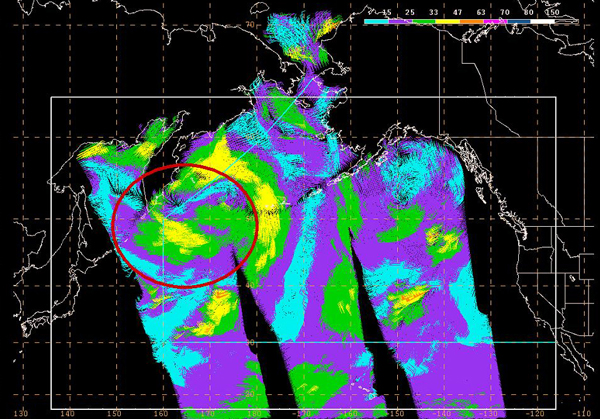
The last example (Figure 9a & 9b) illustrates how QuikSCAT was used to downgrade a storm's intensity. At 00UTC 15NOV 2002 a 982hPa low was analyzed at 54N 172E. Ship reports were all 35KT. or less except for one report indicating 50kt. Based on this observation the forecaster would have issued a storm force label. The QuikSCAT pass from 14NOV 2002 1930UTC showed a large area of gale force winds, with no evidence of any 50kt winds. The forecaster downgraded the label from storm force to Developing Storm/Gale.
|
|
Conclusion
The results from this study are very encouraging. The safety and economic implications of these findings are extremely important. For the first time we can quantify the positive and significant impact that QuikSCAT winds have on the analysis and forecast process. Not only were more warnings issued, but the most significant impact occurred with the Storm and Hurricane Force Warnings. In two of the above case studies the forecaster was able to accurately raise his warning label 2 categories from Gale to Hurricane Force. Prior to the availability of QuikSCAT winds forecasters were not able to identify Hurricane Force Extratropical cyclones. With QuikSCAT surface wind observations they can now identity the location and the magnitude of these powerful storms. The resulting surface analyses produced by OPC have never been more accurate.
A second study has just been completed for the period 15 May - 15 June 2003. Preliminary results show once again that the number of warnings issued by the OPC increased when QuikSCAT winds were used, with the greatest increase noted in the North Atlantic. In both the first and second study, the forecasters noted two limitations to the use of QuikSCAT winds. The first involved data coverage. Because the satellite flies in a sun-synchronous polar orbit, data is only available 2 times daily for each location on the surface of the Ocean.
Therefore data is not always available in the vicinity of a particular storm system; many times a critical area falls within a data gap. The second limitation involves the rain-flagged data. Not all rain-flagged data is contaminated and it should be evaluated before it is ignored. In order to accomplish this it is necessary to be familiar with the signatures of contaminated data and not all forecasters have received adequate training. Despite these limitations QuikSCAT winds are a valuable tool for the Marine forecaster. These issues will be partially addressed when the study is repeated for the period 15OCT 2003 - 15NOV 2003. The wind data from the SeaWinds Scatterometer on ADEOSII will be included, thus increasing the frequency and the area of coverage. Prior to the study, the forecasters will be given a tutorial in the use of rain-flagged data so that they will be able to decipher which data is indeed contaminated. It is expected that an even greater impact will be seen.
About the Author:
Joan Ulrich Von Ahn holds a BS and MS degree in both meteorology and oceanography. She was employed as a meteorologist in the National Weather Service for 18 years. Von Ahn worked in the Aviation Weather Branch and in the Office of Meteorology- most notably as an on-air meteorologist on the public television program AM Weather. After a brief stint as a back up TV meteorologist at WRC-TV in Washington, DC, Von Ahn returned to the National Weather Service as a contractor in the Ocean Prediction Center, to work on verifying the impact of QuikSCAT winds on the forecast and analysis process.
Page last modified: