Storm Force winds, heavy seas batter the Western Cape Coast
Ian Hunter -South Afican Weather Service
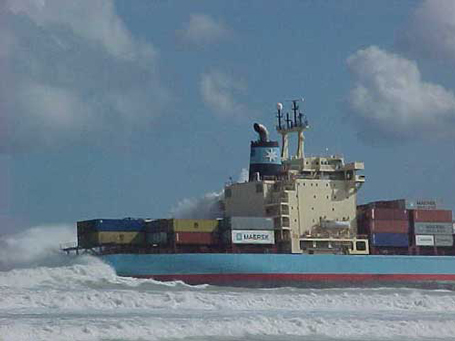 |
Photo above comes courtesy of the Anton de Lange of Cape Town Radio. It shows the 'Sealand Express' aground off Sunset Beach, Milnerton. Surf conditions would have been considerably worse on the more exposed beaches south of Greenpoint. |
A series of intense frontal vortices affected the South-Western Cape on 18 & 19 August. The passage of the initial cold front at approximately 2 p.m. on Monday was associated with average winds of over 50 KT in Table Bay, gusting to over 70 KT at times. On the Beaufort wind scale this translates to Force 10 - i.e. 'Storm Force' winds. These winds resulted in considerable damage in parts of the Greater Cape Town area.
Air pressure dropped to just under a 1000 hPa rising sharply to the rear of the front (this was a long way off any new record - the May 1984 storm produced a barometric pressure of 984 hPa.)
Regular wave data is supplied to the South African Weather Service courtesy of CSIR, NPA and NAMDEB : the significant wave height at CSIR's directional Waverider buoy off Slangkop rose to 8.23m at 2p.mm on 19 August (individual waves of over 12m were recorded).
The casualty with the highest profile was without doubt the container vessel 'Sealand Express' which ran aground at 6.30 a.m. on 19 August. In actual fact the winds had dropped considerably by this time but unusually strong currents may well have been present in Table Bay as a result of the heavy swell. Fortunately the swell direction had swung to the south-west which meant that although the long-period swell was still refracted into the eastern parts of the Bay, its energy was considerably reduced. (This in contrast to the exposed position of the 'Ikan Tanda' which ran aground off Scarborough in September 2001).
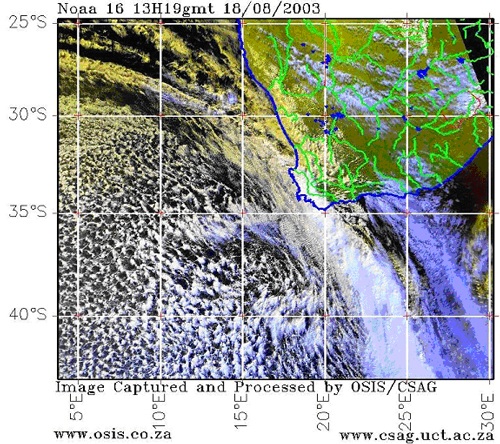 |
Photo above is courtesy of OSIS in Cape Town, a visible image from the NOAA 16 satellite taken soon after the front passed over Cape Town. The thickening in the frontal band west of Cape Agulhas identifies a frontal wave or secondary vortex. This was one of the main reasons for the extreme wind speeds. |
Page last modified: