Tropical Atlantic and Tropical East Pacific Areas
May through August 2010
Deepwater Horizon Support
Deepwater Horizon oil platform in the Gulf of Mexico off the southeast Louisiana coast near 28.7ºN 88.4ºW resulted in the loss of eleven lives and the expulsion of oil into the Gulf of Mexico through 15 July 2010 (Spruill 2010). The National Oceanic and Atmospheric Administration (NOAA) was tasked to provide operational support to the first responders involved in the containment and clean up of the oil. The National Hurricane Centers (NHC) Tropical Analysis and Forecast Branch (TAFB) supplied their operational graphical and text forecasts to the Deepwater Horizon briefing website hosted by the National Weather Service (NWS) Weather Forecast Office (WFO) in New Orleans/ Baton Rouge, Louisiana. http://www.srh.noaa.gov/ lix/?n=embriefing
Prior to this event, TAFB had been experimenting with the generation of gridded marine forecast products for their Area of Responsibility (AOR). TAFB was asked to provide these experimental gridded forecasts for the region impacted by the spill to NOAA in support of the relief efforts. These experimental products provide 12.5 km resolution gridded mean sea level pressure, 10 meter wind speed and direction, dominant wave period, significant wave height, and primary swell forecasts through five days. These forecasts are currently available to view and download in netCDF format on the National Hurricane Center website: http://www.nhc.noaa.gov/tafb/ gridded_marine/index.php
When these gridded products become operational, they will provide value added marine forecasts updated every twelve hours that have been coordinated with the Ocean Prediction Center (OPC) in Camp Springs, Maryland, and the NWS coastal WFOs bordering the TAFB AOR. Figure 1 shows examples of the graphical products that are available on the NHC website. These new products expand the available forecast information from TAFB in their tropical Atlantic High Seas Forecast AOR and eastern Pacific High Seas Forecast AOR from two days to five days. While these graphics will not replace the text products and black and white graphics designed to be easily accessible to mariners at sea, they will supplement those routine products by giving forecast information at intermediate and extended time periods at high resolution. Once operational, the current suite of text and graphical products will be generated directly from these gridded forecasts. This will ensure continuity in the TAFB product suite.

Figure 1. Examples of the experimental graphical forecast products from TAFB available on the NHC website. Beginning on the top right and moving clockwise are mean sea level pressure (in hecta-Pascals), significant wave height (in feet), wave period (in seconds), and wind direction and speed (in knots).(Click to enlarge)
North Atlantic Ocean to 31N and Eastward to 35W, including the Caribbean Sea and the Gulf of Mexico
Table 1 describes the two non-tropical warning events that occurred within the TAFB AOR during the period from May through August 2010. The first event was driven by a complex area of low pressure over the southwest North Atlantic. Figure 2 shows the NWS Unified Surface Analysis from 0000 UTC on 23 May when the system was at its most intense. The pressure gradient between this system and high pressure behind a cold front over the Central Atlantic was strong enough to produce gale force winds primarily in the northeast semicircle of the low pressure system. Winds just below gale force were observed by the European Space Agencys Advanced SCATerometer (ASCAT) around 0200 UTC on 23 May and gale force winds of 38 kts were reported by the Horizon Navigator (WPGK) near 28.7ºN 69.4ºW at 1800 UTC that day. There were few ships reporting in the gale area during the event, but National Data Buoy Center (NDBC) Buoy 41048 just north of the forecast area near 32.0ºN 69.6ºW reported winds of 35-37 kts from 1450- 2350 UTC on 24 May. Gale warnings were lowered over the TAFB AOR at 0600 UTC on 25 May.
| Onset | Region | Peak Wind Speed | Duration | Forcing |
|---|---|---|---|---|
| 1200 UTC 23 May | SW N Atlc | 40 kts | 42 hours | Low pressure system |
| 1800 UTC 03 Aug | Tropical N Atlc | 45 kts | 42 hours | TS Colin Remnant Low |
Figure 2. NWS Unified Surface Analysis from 23 May 2010 at 0000 UTC. Note
the 1006 hPa complex low pressure system east of the Bahamas.(Click to enlarge)
The second event occurred after Tropical Storm Colin degenerated into a remnant surface low within the TAFB AOR on 03 August. The convection associated with Colin became disorganized as it passed through a region of strong westerly wind shear induced by a complex upper-level trough over the western North Atlantic. Colin was also moving northwest at a forward speed of 25-30 kts at the time it was downgraded. The remnants of Colin further diminished to an open trough of low pressure on 04 August. During the time that TAFB issued non-tropical gale warnings on the remnants of Colin, an area of gale force winds of up to 40 kts remained in close proximity to the east side of the remnant surface trough axis while the area of winds between 20 kts and gale force spanned an area as large as 400 nmi west of the system and 500 nmi east of the system. Examples of the expansive wind field with the system are seen in the ASCAT passes from around 1500 UTC 04 August and 0000 UTC 05 August shown in Figure 3. At 1500 UTC, NDBC Buoy 41044 reported sustained south-southeast winds of 31 kts and 10 ft seas just east of the system center while ship Agulhas Stream (PJKV) reported south-southeast winds of 23 kts and 9 ft seas approximately 300 nmi southeast of the system center.
Notice that the wind field north of the system shrinks between 1500 UTC 04 August and 0000 UTC 05 August as Colin begins to reorganize and winds at Caribbean Integrated Coastal Ocean Observing System Buoy 41053 on the southwest side of the system near the north coast of Puerto Rico shift from northeasterly to northwesterly. The Geostationary Operational Environmental Satellite East (GOES-E) infrared imagery seen in Figure 3 also shows consolidation of the convection associated with the remnants of Colin over time. The next ASCAT pass on 05 August at 1342 UTC showed that Colin had once again regained a coherent low-level center. An Air Force Reserve Hurricane Hunter reconnaissance flight later that day sampled 50-52 kts 500 ft flight level winds in the east semicircle and the Stepped Frequency Microwave Radiometer measured winds near 40 kts at the ocean surface. Based on the sum of this information, tropical cyclone advisories were reinitiated by the NHC Hurricane Specialist Unit for Tropical Storm Colin at 2100 UTC on 05 August.
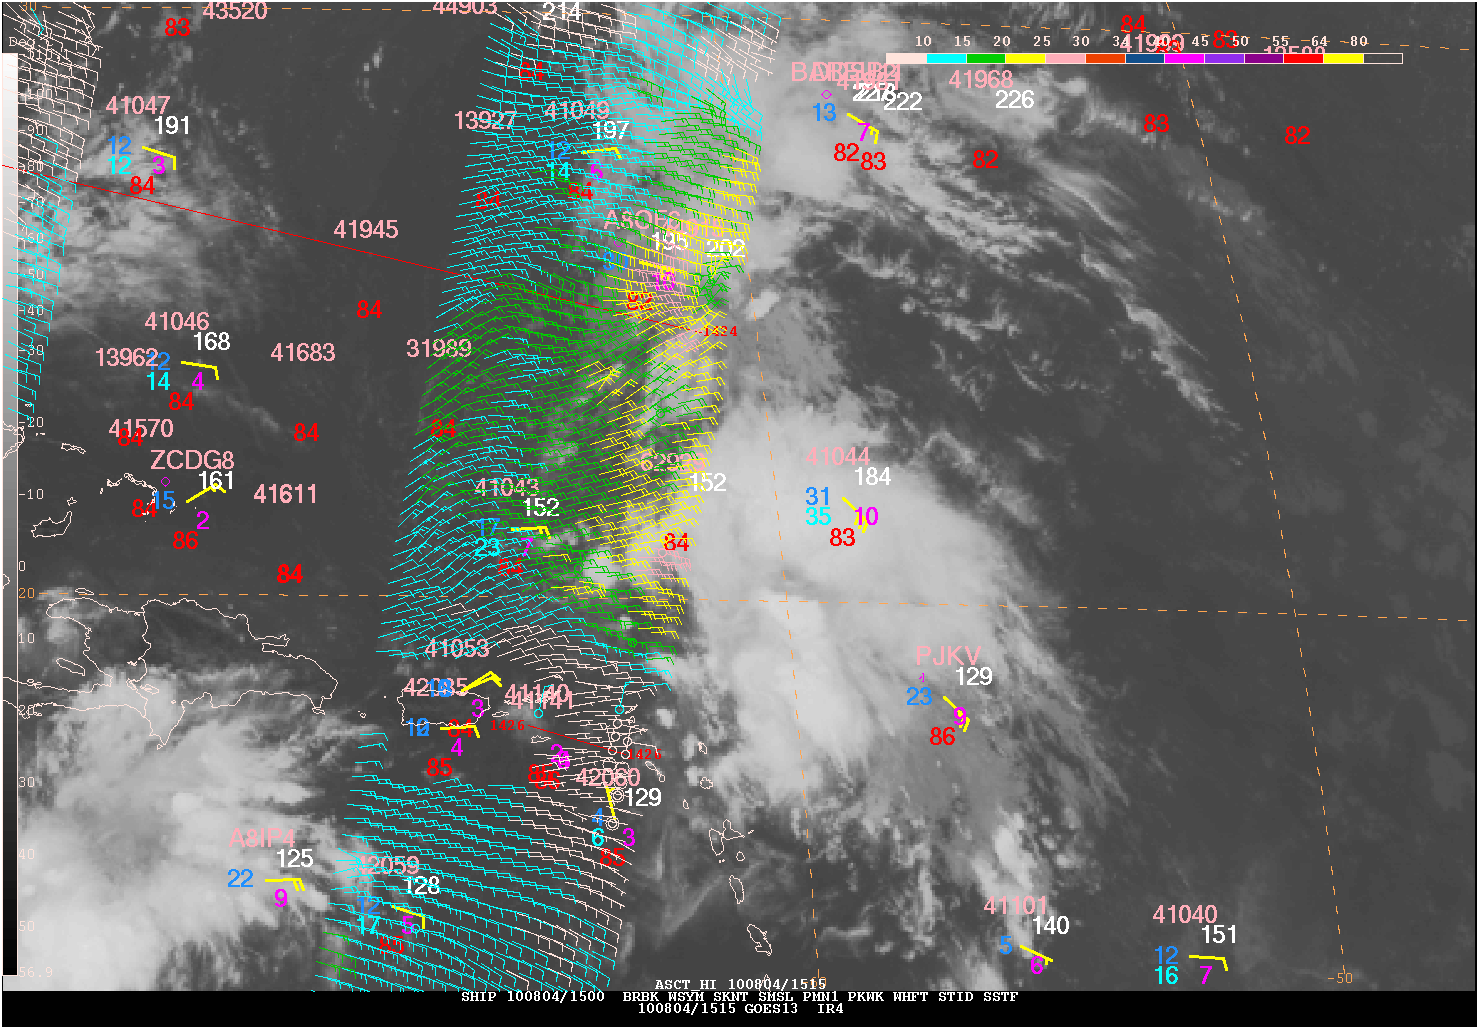
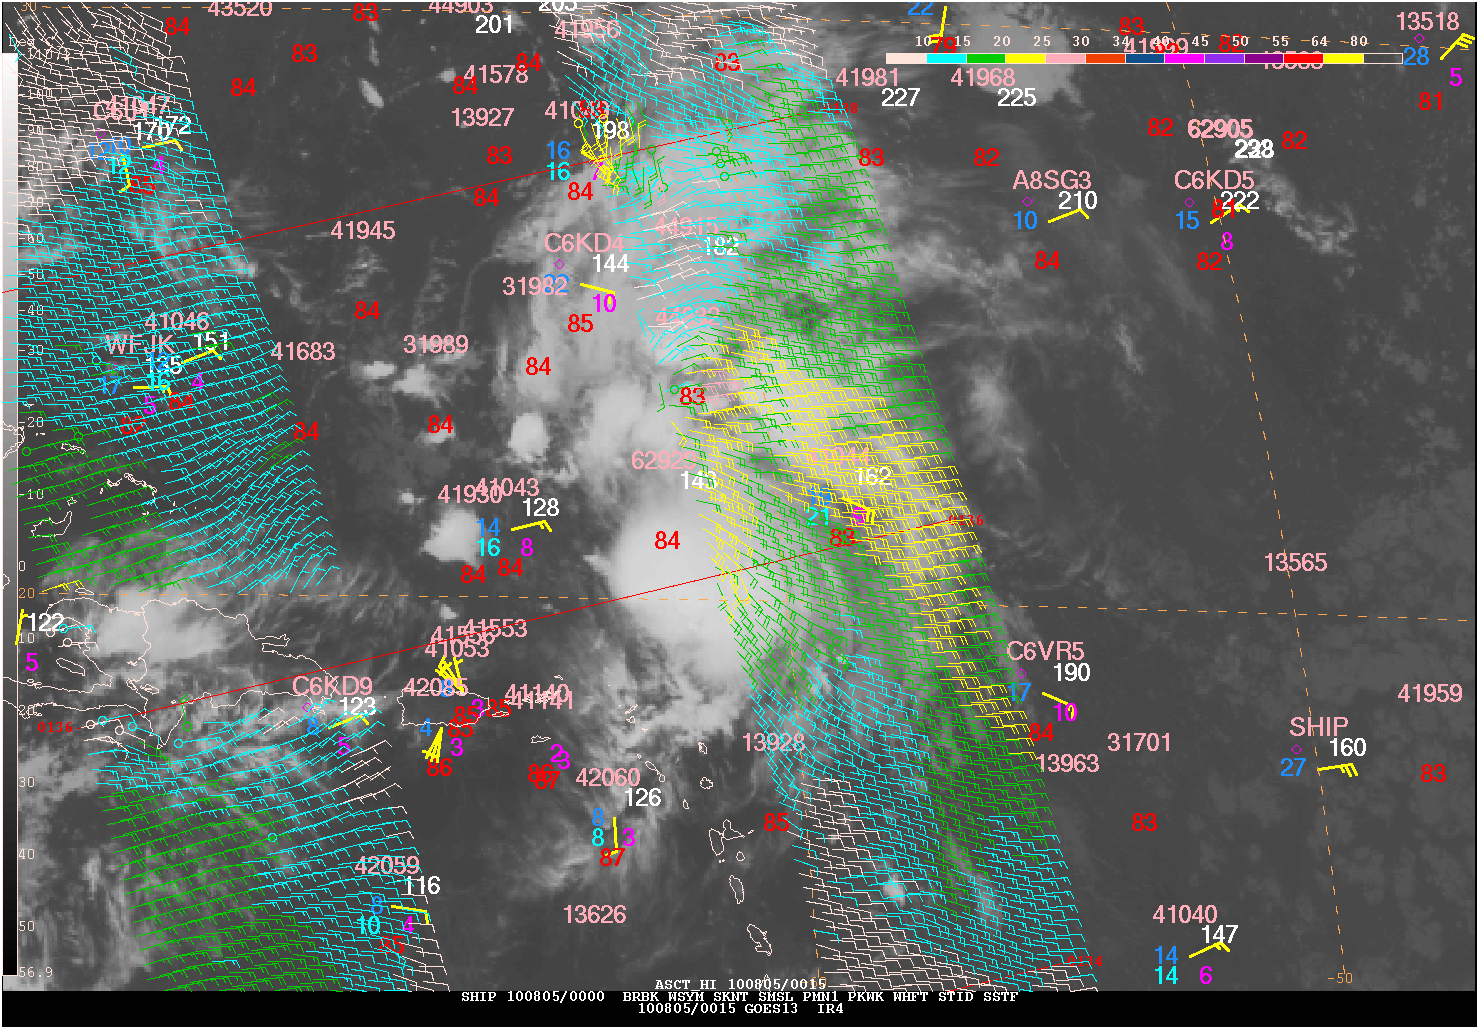
Figure 3. ASCAT pass, infrared satellite imagery from GOES-E, and ship and buoy observations from the non-tropical gale phase of the remnant low of Colin around 1500 UTC 04 August (left) and around 0000 UTC 05 August (right). Note in the increase in organization of the convection associated with the system with time. (Click to enlarge)
Eastern North Pacific Ocean to 30N and East of 140W
There were no gale warnings issued for the TAFB AOR in the eastern North Pacific between 1 May and 31 August 2010. However, there were several long period cross-equatorial swell events stemming from powerful fall and winter southern hemisphere storms. Table 2 documents the significant crossequatorial swell events with periods over 18 seconds. Swell generally moves northeastward from these storms before entering the southwestern or southcentral portion of the TAFB AOR. Swell from such systems typically propagates around the Galapagos Islands toward the coast of Central America and Mexico and can impact the entire TAFB AOR. Figure 4 shows the frequency of the dominant swell direction during the month of August at San Nicolas Island, California, just north of the TAFB AOR near 33.1N 119.5W. Note that the dominant swell direction was from the south and southsouthwest and had a period generally between 15-20 seconds.
| Onset of 18s period swell | Peak Period | Maximum Wave Height | Duration of 18s period swell |
|---|---|---|---|
| 1200 UTC 11 May | 20s | 12 ft | 72 hours |
| 1200 UTC 24 May | 19s | 11 ft | 60 hours |
| 1200 UTC 10 June | 20s | 11 ft | 84 hours |
| 1200 UTC 30 June | 22s | 12 ft | 144 hours |
| 0000 UTC 11 July | 22s | 9 ft | 252 hours |
| 0000 UTC 18 August | 19s | 12 ft | 168 hours |
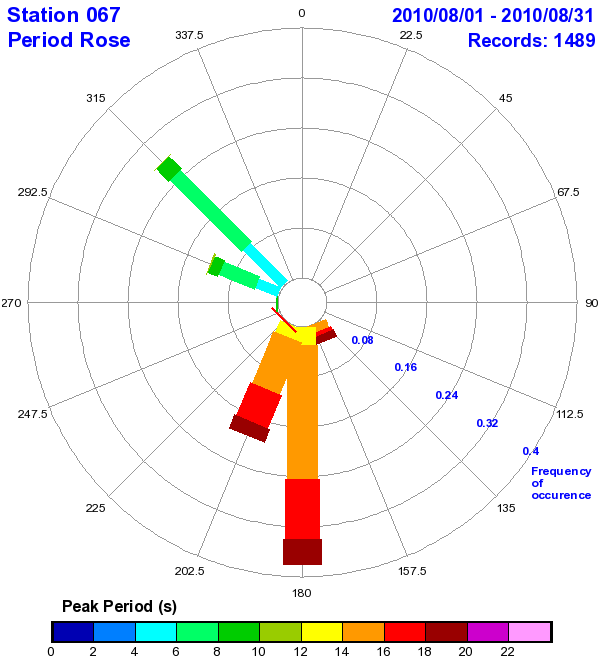
Figure 4.
Wave period rose for San Nicolas
Island, California (Station 067; NDBC
Identifier 46219) for the month of
August 2010. The wave period rose
shows the primary swell direction on
the compass rose, the peak period
of that swell based on the color
legend below, and the frequency
of occurrence of a particular swell
direction and period based on the
length of the colored area from the
center of the compass rose. (Credit:
Scripps Institution of Oceanography,
Integrative Oceanography Division,
Coastal Data Information Program)(Click to enlarge)
The longest event during the period lasted from 11-21 July. It stemmed from a series of storm force wind events in the South Pacific. The ASCAT depiction of the wind field over the Pacific on 11 July is shown in Figure 5. Note the large area of gale and near gale force winds found south of 20°S, a common occurrence during the months of May- August of 2010.
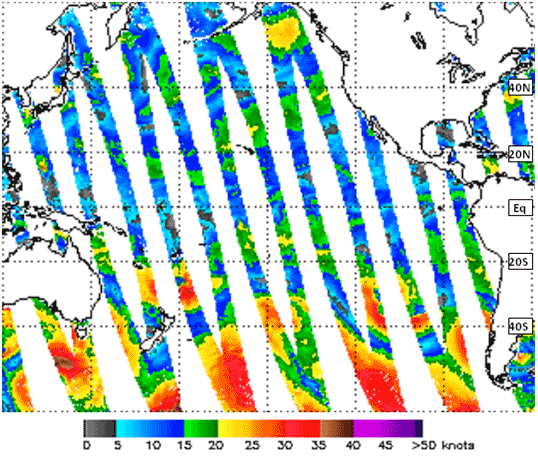
Figure 5. ASCAT ascending passes over the Pacific Ocean on 11 July 2010 (Credit: National Environmental Satellite, Data, and Information Services Center for Satellite Application and Research)
The first long period swell event moved into the TAFB AOR on 11 May. 18-20 second period southwesterly swell was forecast to hit the coast of Central America by Mexico by 0000 UTC May 14 as seen in Figure 6.
On 23 June 2010, TAFB modified the look of their wave period charts to be more consistent with their sister office, OPC. An example of the black and white fax version of this new format is shown in Figure 7. This figure highlights conditions during last occurrence of 18s period swell observed during August 2010. A comparison of Figures 6 and 7 shows that the new format provides more evenly spaced wave period and swell information across the AOR. This is particularly useful when the fax chart is only partially received. TAFB hopes that this change is an improvement in services to our users at sea.
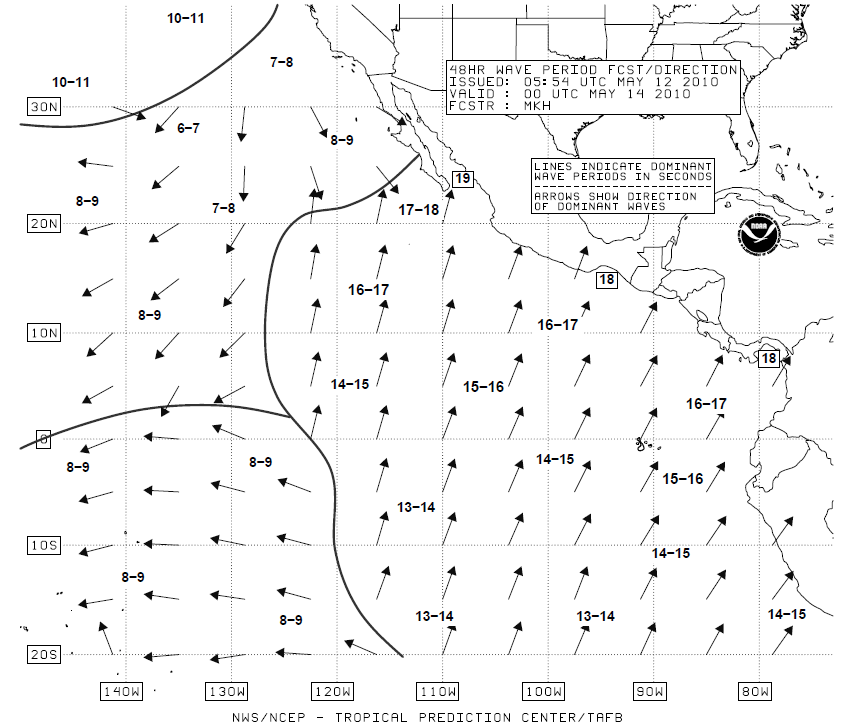
Figure 6. TAFB 48 hour Wave Period forecast chart valid 0000 UTC 14 May 2010.(Click to enlarge)
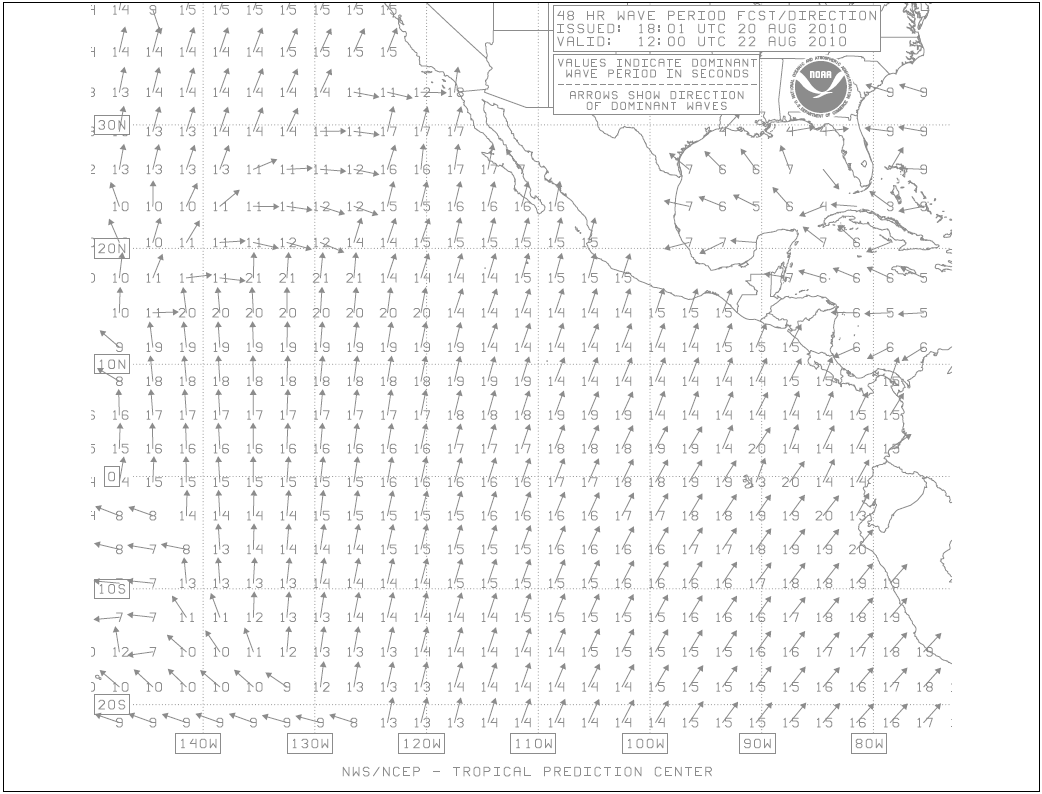
Figure 7. TAFB 48 hour Wave Period forecast chart valid 1200 UTC 22 Aug 2010.(Click to enlarge)
Spruill, Fiona ed. Gulf of Mexico Deepwater Horizon Oil Spill (2010). New York Times: Times Topics. 2010. [http://topics. nytimes.com/top/reference/ timestopics/subjects/o/oil_spills/ gulf_of_mexico_2010/index.html]. Updated September 20, 2010.