Methodology for the Determination of 12 Ft Sea Radii for Tropical Cyclones
Hugh Cobb, John Cangialosi, and Jessica Schauer Clark, Tropical Analysis and Forecast Branch, National Hurricane Center/Tropical Prediction Center, Miami, Florida
Introduction
The advent of satellite altimetry and ocean surface vector wind observations has significantly increased the amount of observational data available to marine meteorologists. The Tropical Analysis and Forecast Branch (TAFB) at the National Hurricane Center (NHC) actively incorporates these cutting edge data sets into their ocean analyses, providing the most accurate assessment of the current sea state in their tropical North Atlantic and Northeast Pacific areas of responsibility
This article will detail the use of the recently enhanced observational dataset available to TAFB for the determination of the 12 ft sea radii associated with a tropical cyclone. We will highlight how satellite data are used to help determine the 12 ft sea radii of tropical cyclones in two scenarios: first, in conjunction with numerical wave model fields in regions with little or no in situ data, and secondly as a supplement to in situ observations in cases where they exist.
Previous Methods for Determining 12 ft Sea Radii
Previously, the determination of the 12 ft sea region relied heavily on simple idealized mathematical models. These models were often not robust enough to incorporate the environmental conditions specific to a real life tropical cyclone.
In one early method, the 12 ft sea radii were initially estimated to be the same as the 34 kts wind radii when no in situ observations were present. According to Senior Hurricane Specialist Stacy Stewart, the radii were then expanded by a factor of 1.1 every 12 hours thereafter with modifications made using any available in situ observations. An obvious shortcoming of this method is geography. If a tropical cyclone is located over the central Caribbean where waves refract around islands and wind speed is impacted by topography, the wave field can be significantly different than this simple method implies.
Until recently, TAFB relied on a parametric wave program developed by Dr. Steve Lyons (former TAFB Branch Chief now affiliated with the Weather Channel). The wave program was introduced into TAFB operations in 1998. This program utilized the initial 34, 50, and 64 kts wind radii for a tropical cyclone as well as the storm intensity and motion to determine its 12 ft sea radii. In addition, the duration of the current intensity of the storm was taken as input. The program produced 12 ft sea radii in the right front and left rear quadrants of the tropical cyclone as well as the maximum sea heights in the right front and left rear quadrants. Because the program required eight input variables, it was time-consuming to use for marine forecasts involving multiple tropical cyclones. More importantly, the 12 ft sea radii derived by this model were often too large for tropical cyclones surviving longer than 72 hours.
TAFB adopted another parametric wave program, developed by C.S. Wu (affiliated with the National Weather Services Office of Science and Technology), into operations in 2003. This program required only six input parameters, the latitude of the storm, central pressure, environmental pressure, radius of maximum winds, maximum winds and forward speed.
The fewer input parameters saved time during the forecast process. This program produces 12 ft Sea radii in the right front and left rear quadrants of the tropical cyclone and the maximum sea height for the tropical cyclone. Forecast sea height tables were created from the CS Wu program and are still used operationally to estimate forecast 12 ft sea radii and the highest sea. The sea height tables were created for radii of maximum winds ranging from 5 nmi to 35 nmi and for storm motions of 10, 20 and 30 kts.
The Tropical Cyclone Forecast/Advisory (TCM) composed by NHCs Hurricane Specialists Unit provides an initial estimate of the 12 ft sea radii in the four quadrants of a tropical cyclone in a clockwise fashion beginning with the northeast quadrant. NHC Hurricane Specialists rely heavily on the input from TAFB meteorologists for the determination of 12 ft sea radii. Because an estimate of the 12 ft sea radii is required for each quadrant of a tropical cyclone, the output from the parametric wave programs is not detailed enough to meet this operational need. The following section describes the methodology the TAFB has adopted to provide this information to the Hurricane Specialists.
Current Method for Determining 12 ft Sea Radii and the Sea State Analysis in Observationally Rich and Sparse Regions
To meet the need to provide an accurate estimate of the 12 ft sea radii associated with tropical cyclones, an approach was taken that incorporates several complimentary data sets which provide the best overall picture of the 12 ft sea radii. The data sets are described in the following paragraphs.
The Jason-1 polar-orbiting satellite, launched on December 7, 2001, provides significant wave height data at 3 nmi horizontal resolution to the nearest one foot over the globe (NASA, 2008). The observations provided by the Jason altimeter supply wave height information in data sparse regions of the tropical Atlantic and East Pacific oceans. However, satellite altimeter swaths from Jason-1 are currently infrequent and narrow, covering only a small fraction of the TAFB forecast area at any given time. In addition, Jason-1 significant wave height data can show unrealistic variations from one data point to the next. These variations are generally attributed to atmospheric interference. While the Jason-1 observations are considered reliable, some interpretation is required by TAFB meteorologists to determine the wave field when these variations occur.
To fill in the sea state analysis in other locations, gridded wave heights from a short term forecast (most often the 6 hour forecast period) of a numerical wave model, such as the Multi-grid Wave Watch III, are used as a first guess field and adjusted accordingly for any reliable observations. In cases when the analysis period includes a tropical cyclone over the basin in question, the Geophysical Fluid Dynamics Laboratory (GFDL) version of the Wave Watch model, which incorporates more detailed initial conditions for the tropical cyclone than the other numerical wave models, is generally used as a background field. Currently, the GFDL version of the Wave Watch does not incorporate altimeter data into its initial analysis of significant wave heights.
Over data sparse regions such as the open tropical East Pacific or Atlantic Oceans, ship data are the only source of in situ observations available to assist in analyzing the 12 ft sea radii for a tropical cyclone. Figure 1 illustrates an example of the sparse ship observations over the open Atlantic Ocean in the vicinity of Hurricane Bertha for a 24 hour period ending 12 UTC 8 July 2008. Note the large areas where no ship reports were available during that time period. In such cases, a meteorologist is forced to rely heavily on numerical wave model output. While this is not ideal, the likelihood that the numerical wave model will accurately depict the wave field for the tropical cyclone is higher over the open ocean than in regions of varying bathymetry and terrain. This is highly dependent on the GFDL having an accurate representation of the tropical cyclones wind field.
Figure 1 shows the GFDL wave model initialization period for Hurricane Bertha overlaid with a Jason-1 pass within a half hour of the model initialization. The Jason-1 pass confirms the general distribution of wave heights in the western semicircle of Hurricane Bertha. However, there are some discrepancies between the Jason-1 observations and the GFDL Wave Watch initialization. Take note of the model-analyzed 12 ft sea radius in the southwest quadrant compared to the Jason-1 observations. While the 12 ft isopleth passes through a 12 ft observation from the Jason-1 altimeter, the significant wave height to its north and south correspond to values well below 12 ft. In this case, some interpretation of the Jason-1 data is required by the TAFB meteorologist. Because this data point is considered an outlier, the observational 12 ft sea radius in the southwest quadrant was interpreted to be closer to the center of the system where the Jason-1 values become consistently over 12 ft. The observed 12 ft sea radius in the southwest quadrant then becomes smaller than the initial model-analyzed radius. This case illustrates an example of a high bias in the model interpretation of the wave field. The difference between the observed and model-based values for the 12 ft sea radius in the southwest quadrant can then be applied to the short term forecast from the GFDL Wave Watch for the Atlantic High Sea Forecast. This method can also be applied to any other available wave model output in order to develop a more accurate forecast of the wave field.
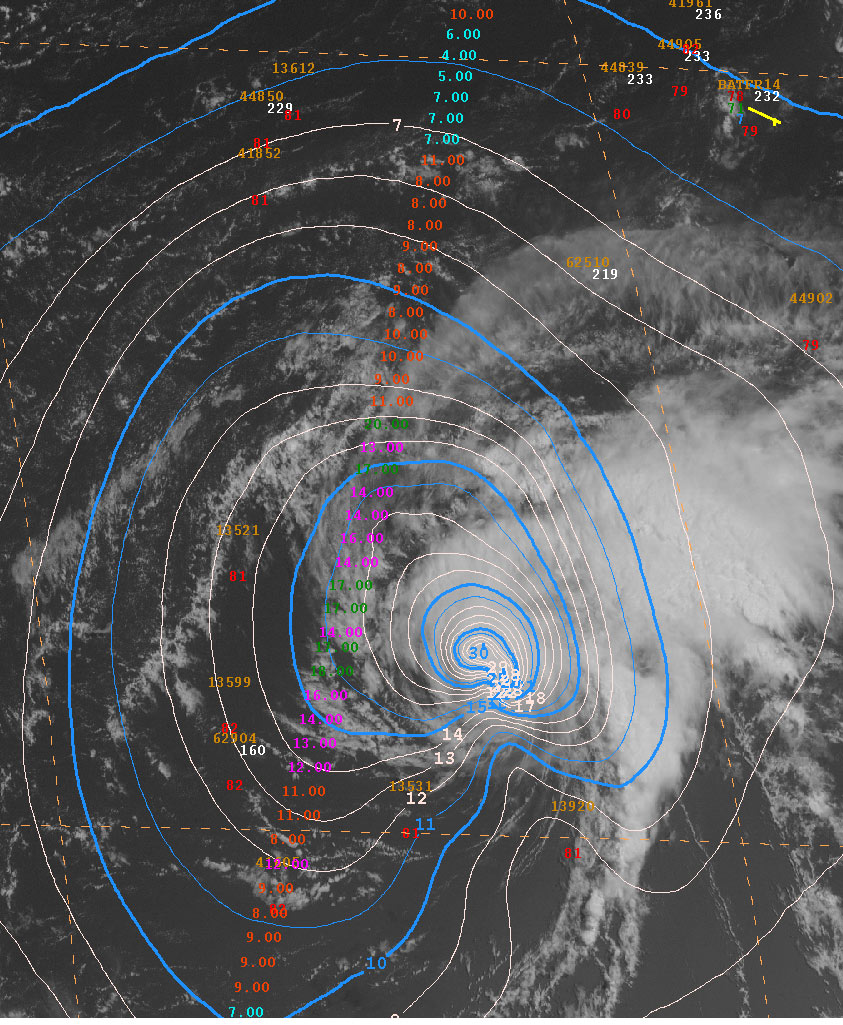
Figure 1: The sea state initialization at 1200 UTC 8 July 2008 of the Geophysical Fluid Dynamics (GFDL) version of the Wave Watch model for Hurricane Bertha. A JASON-1 altimeter pass within a half hour of the model initialization time and in situ observations from the previous 24 hour period are overlaid.
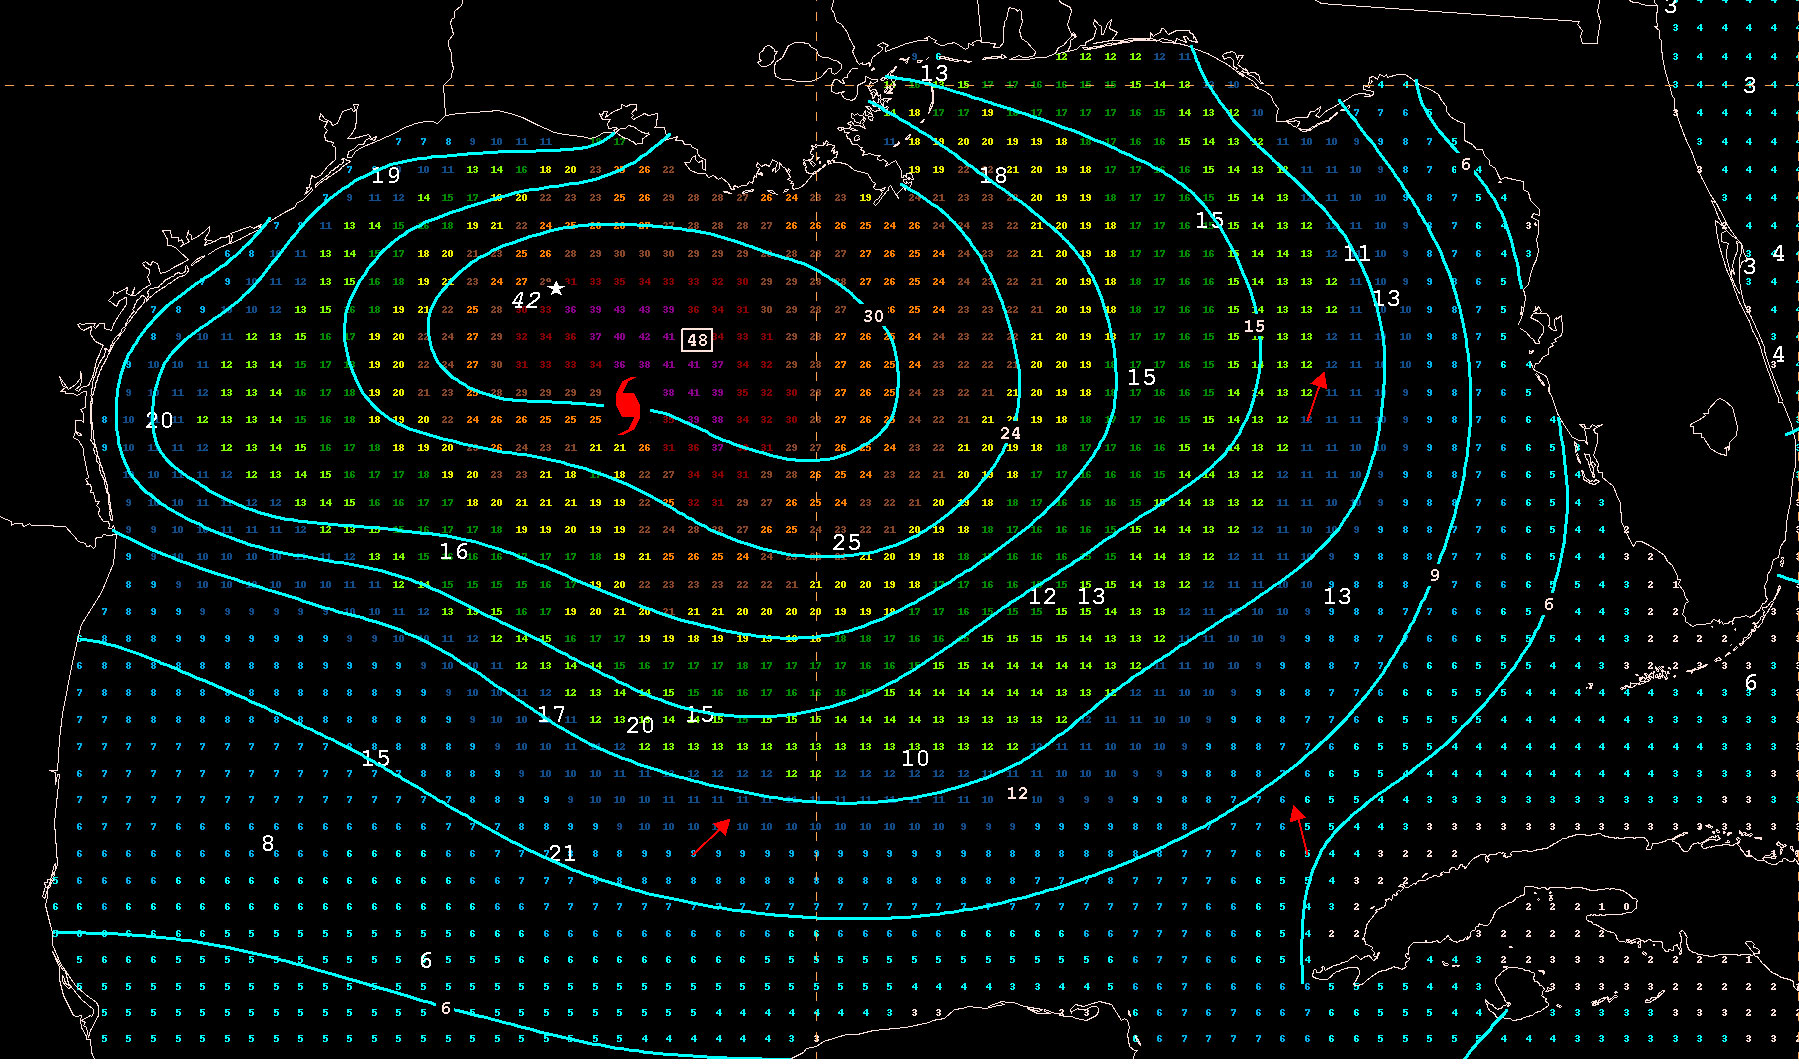
Figure 2: Example of the TAFB sea state analysis including the 12 ft sea contour derived for Hurricane Ike at 1200 UTC 12 September 2008. The color grid represents the Geophysical Fluid Dynamics (GFDL) version of the Wave Watch model and the white numbers are significant wave heights reported by buoys and ships. The report noted with the asterisk (*) is from the stranded ship (Antolena).
Once a tropical cyclone moves into the Gulf of Mexico, Southwest North Atlantic or the Caribbean Sea, the observational networks are denser with NOAA Buoys in the offshore waters and Coastal Monitoring Automated Network (CMAN) sites in the near shore waters, primarily along the Gulf Coast. The dense observational network provides enough data to ensure a much more accurate analysis of the 12 ft sea radii as well as a better assessment of the performance of the various model versions of the wave watch model (GFDL, Global Forecast System (GFS), or Fleet Numerical Modeling and Oceanography (FNMOC)) as compared to an event occurring over the open ocean.
Hurricane Ike (2008) is a good case study, as the storm spent a few days in the Gulf of Mexico and passed through one of the richest data regions in the Atlantic basin. Figure 2 is an image of the derived sea state during Hurricane Ike at 1200 UTC 12 Sept 2008, centered near 26.9 N 92.2 W. While the GFDL version of the Wave Watch model (color grid) performed very well over the eastern semicircle of the storm, it struggled significantly over the northwest quadrant. At that time, NOAA buoys 42019 and 42035 near the Texas coast reported 19 ft and 20 ft combined seas respectively, compared to 10-12 ft forecast by the model. Upon further investigation, the observed seas were mainly due to swell propagating westward from the strong winds over the northern eyewall. In addition, the NHC received a call from the Coast Guard informing the NHC of a stranded ship, the Antolena, near 28 N 93 W situated in the northwest portion of Ikes eyewall at that time. The Coast Guard asked the NHC for a short term forecast to determine when winds would subside enough to safely perform a search and rescue mission. At the time of the call, the ship was reporting 42 ft seas. This was significantly higher than expected as the ship was not located in the region of expected maximum winds and seas, which would be in the northeast quadrant. The GFDL Wave Watch model was running about 10 ft too low in the vicinity of the ship report. This information was not only critical in estimating the 12 ft sea radii and maximum sea, but was also useful for a short term forecast as a considerable low bias was clearly evident in model guidance west of the center.
Conclusions
The active utilization of satellite-based ocean observations allows for a more accurate analysis of the initial sea state in regions of little or no in situ data and provides a reality check for in situ observations that may contain errors. In turn, these more reliable sea state analyses permit a more accurate appraisal of the quality of numerical wave model output. While long-term verification is difficult due to a lack of historic data, we believe all of these advances have significantly improved the estimation of the 12 ft sea radii for tropical cyclones over previous methods.
While the increased coverage of wave height observations has significantly improved our analysis of the tropical oceans, satellite data is still not as robust as in situ observations. Satellite altimeter swaths are currently infrequent and narrow, covering only a small fraction of the TAFB forecast area. Therefore, TAFB continues to rely heavily on ship observations and is indebted to those mariners who provide these critical observations.
References
Chao, Y. and H. Tolman, 2000: Numerical Experiments on Predicting Hurricane Generated Wind Waves. Preprints of the 6th International Workshop on Wave Hindcasting and Forecasting, Monterey, California, November 6-10, 2000, 167-179.
Tolman, 2003: The North Atlantic Hurricane Wind Wave Forecasting System (NAH). Technical Procedures Bulletin No. 478, National Weather Service, NOAA, U.S. Department of Commerce. [Available online at http://polar.ncep.noaa.gov/mmab/tpbs/operational.tpbs/tpb478/tpb478.htm]
Chao, Y., L. Burroughs and H. Tolman, 2003: Wave Forecasting for the Western North Atlantic and Adjacent Waters. Technical Procedures Bulletin No. 495, National Weather Service, NOAA, U.S. Department of Commerce. [Available online at http://polar.ncep.noaa.gov/mmab/tpbs/operational.tpbs/tpb495/tpb495.htm]
Chao, Y., L. Burroughs, and H. Tolman, 2004: North Pacific Hurricane Wind Wave Forecast System. Technical Procedures Bulletin No. 238, National Weather Service, NOAA, U.S. Department of Commerce. [Available online at http://polar.ncep.noaa.gov/mmab/tpbs/operational.tpbs/1_tpb_nph_all.pdf]
Hydrometeorological Prediction Center, 2008: National Hurricane Center Backup Manual. National Weather Service, NOAA, U.S. Department of Commerce.
National Aeronautics and Space Administration Jet Propulsion Lab, 2008: MISSIONS: Jason-1 Fact Sheet. JPL Clearance: CL01-1707. [Available online at http://sealevel.jpl.nasa.gov/mission/jason-fact-sheet.html]
Tolman, H.L., 2007: Development of a multi-grid version of WAVEWATCH III. Technical Procedures Bulletin No. 256, National Weather Service, NOAA, U.S. Department of Commerce.
Back to top