Gust Factor Characteristics As Measured by NDBC Buoys
S. A. Hsu and B. W. Blanchard, Coastal Studies Institute, Louisiana State University, Email: sahsu@lsu.edu
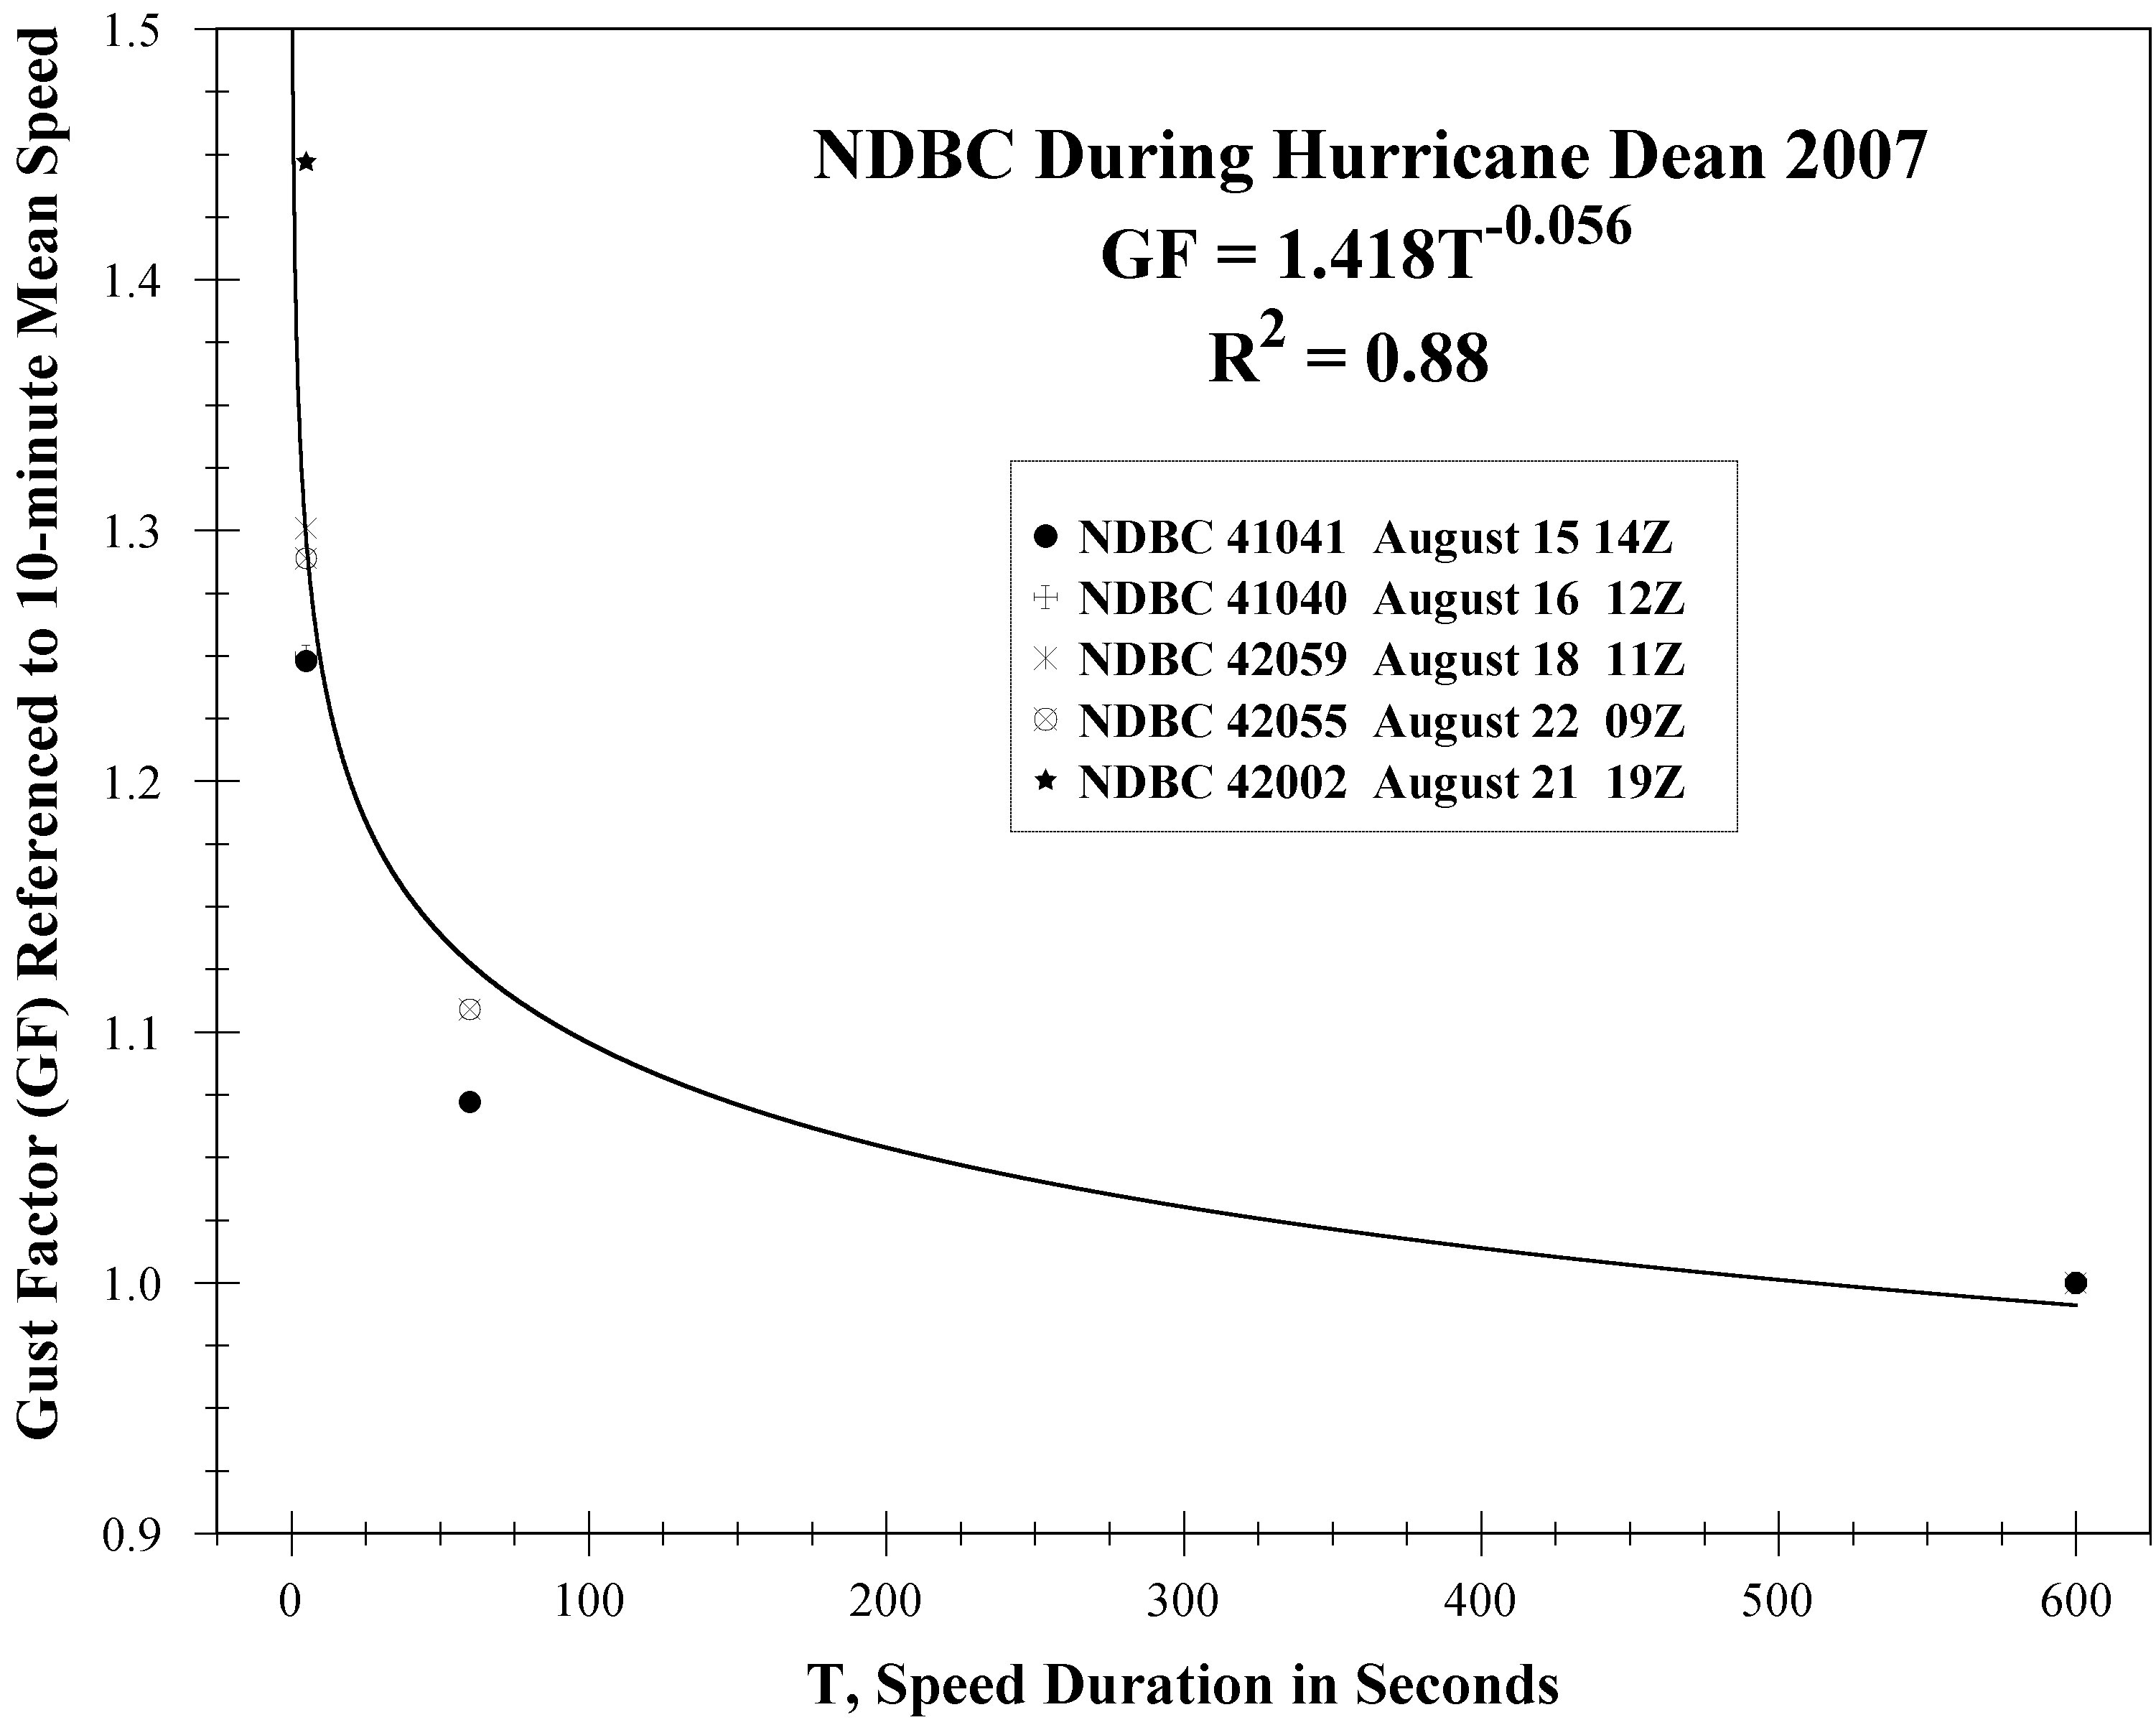
Figure 1. Variation of GF with sampling duration
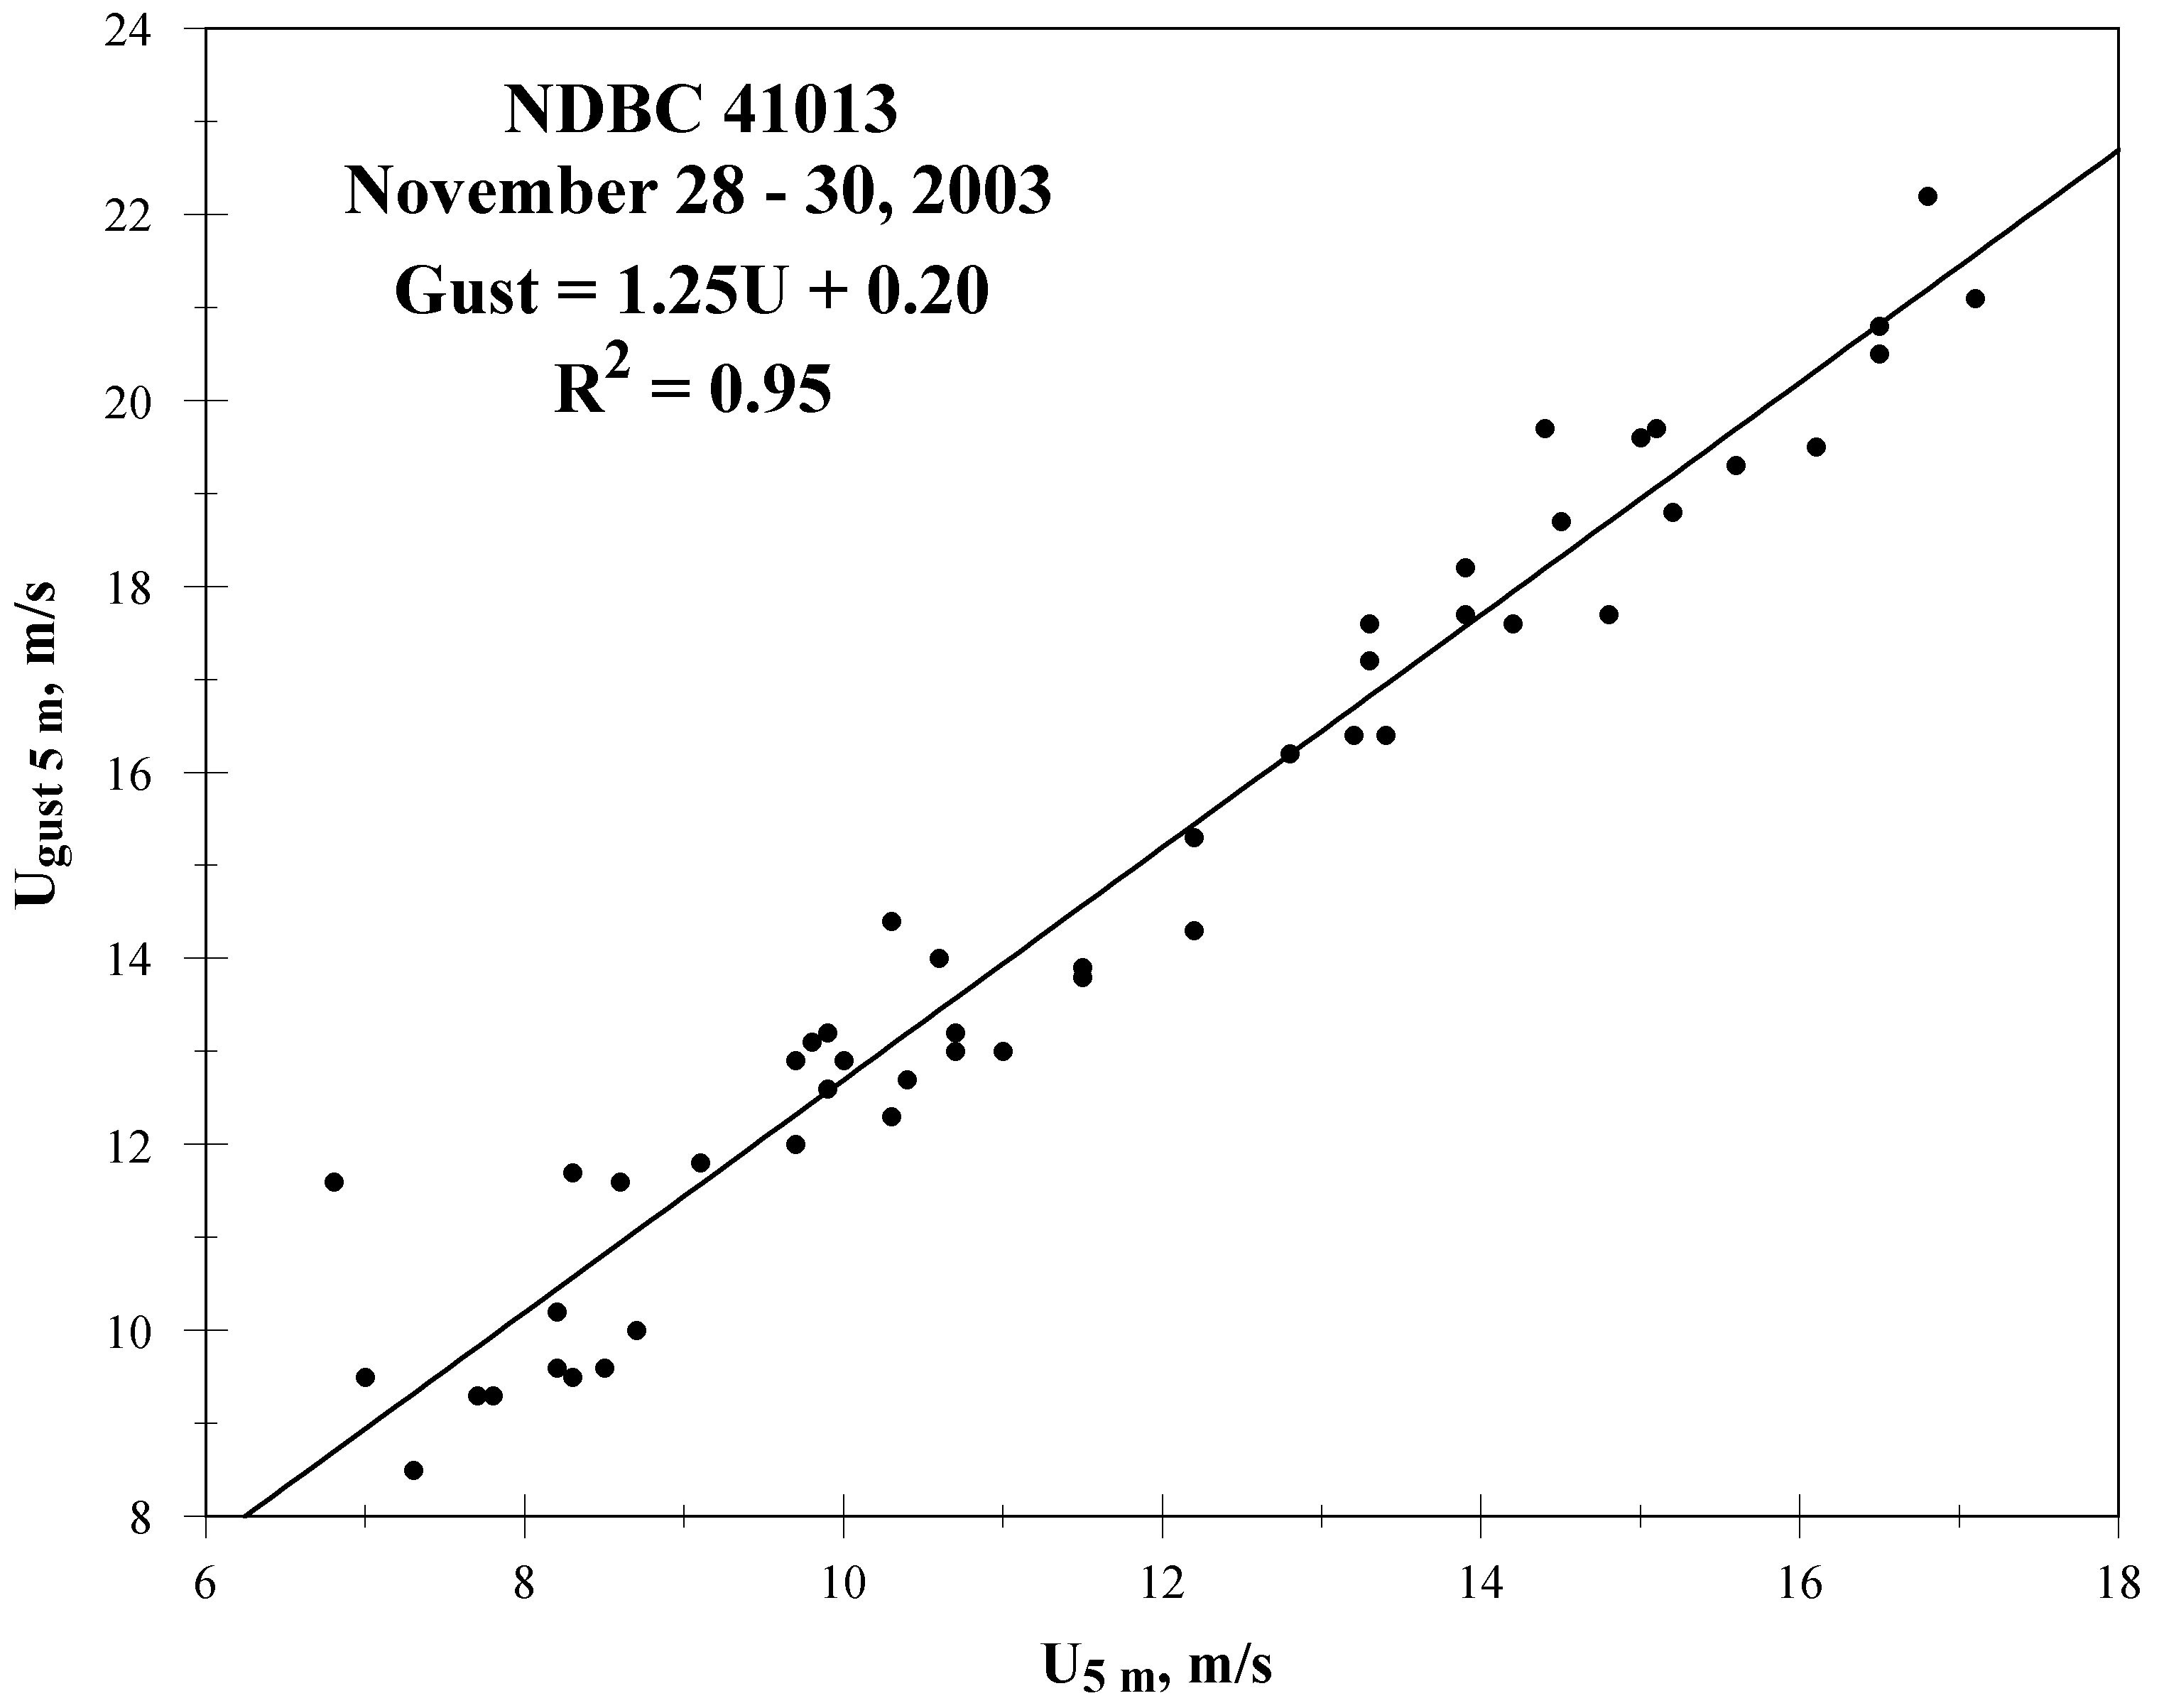
Figure 2a. Variation of GF with height (5 m level).
The National Data Buoy Center (NDBC) operates and maintains many instrumented buoys and platforms in the coastal and open waters bordering the contiguous U.S. and the Alaskan and Hawaiian islands. These buoys typically monitor both oceanographic and meteorological parameters, with measured values recorded hourly (see www.noaa.ndbc.gov)
Near-surface wind data, including peak gust, is a standard parameter at most buoy stations. The gust factor (GF) is the ratio of peak gust to sustained wind (see, e.g., Hsu (2006) at http://www.nwas.org/eg/pdf/2006-EJ2.pdf). Three common questions often raised by wind data users are: what is the variation of GF with sampling duration, with height, and with geography? It is the purpose of this brief study to address these uncertainties.
Temporal Variation
Figure 1 shows the variation of GF with the sampling duration in reference to 10 minute mean speeds. Wind data recorded during the passage of Hurricane Dean in 2007 from five separate buoys was used to derive the relationship. At each buoy, the values of maximum 10 minute wind, maximum 5 second gust, and maximum one minute winds were measured within 10 minutes of each other (see www.ndbc.noaa.gov/hurricanes/2007/Dean).
Height Variation
The variation of GF with height is provided in Figure 2a for 5 m and Figure 2b for 44.2 m. It can be seen that the GF is less at higher elevations due to the reduction in drag or friction.
Geographic Variation
The variation of GF with geography is shown in Figure 3a for the Bering Sea during an extratropical cyclone and Figure 3b for the Caribbean Sea during Hurricane Wilma. It is concluded that for a given wind speed at a given height the variation in GF due to geography is negligible.
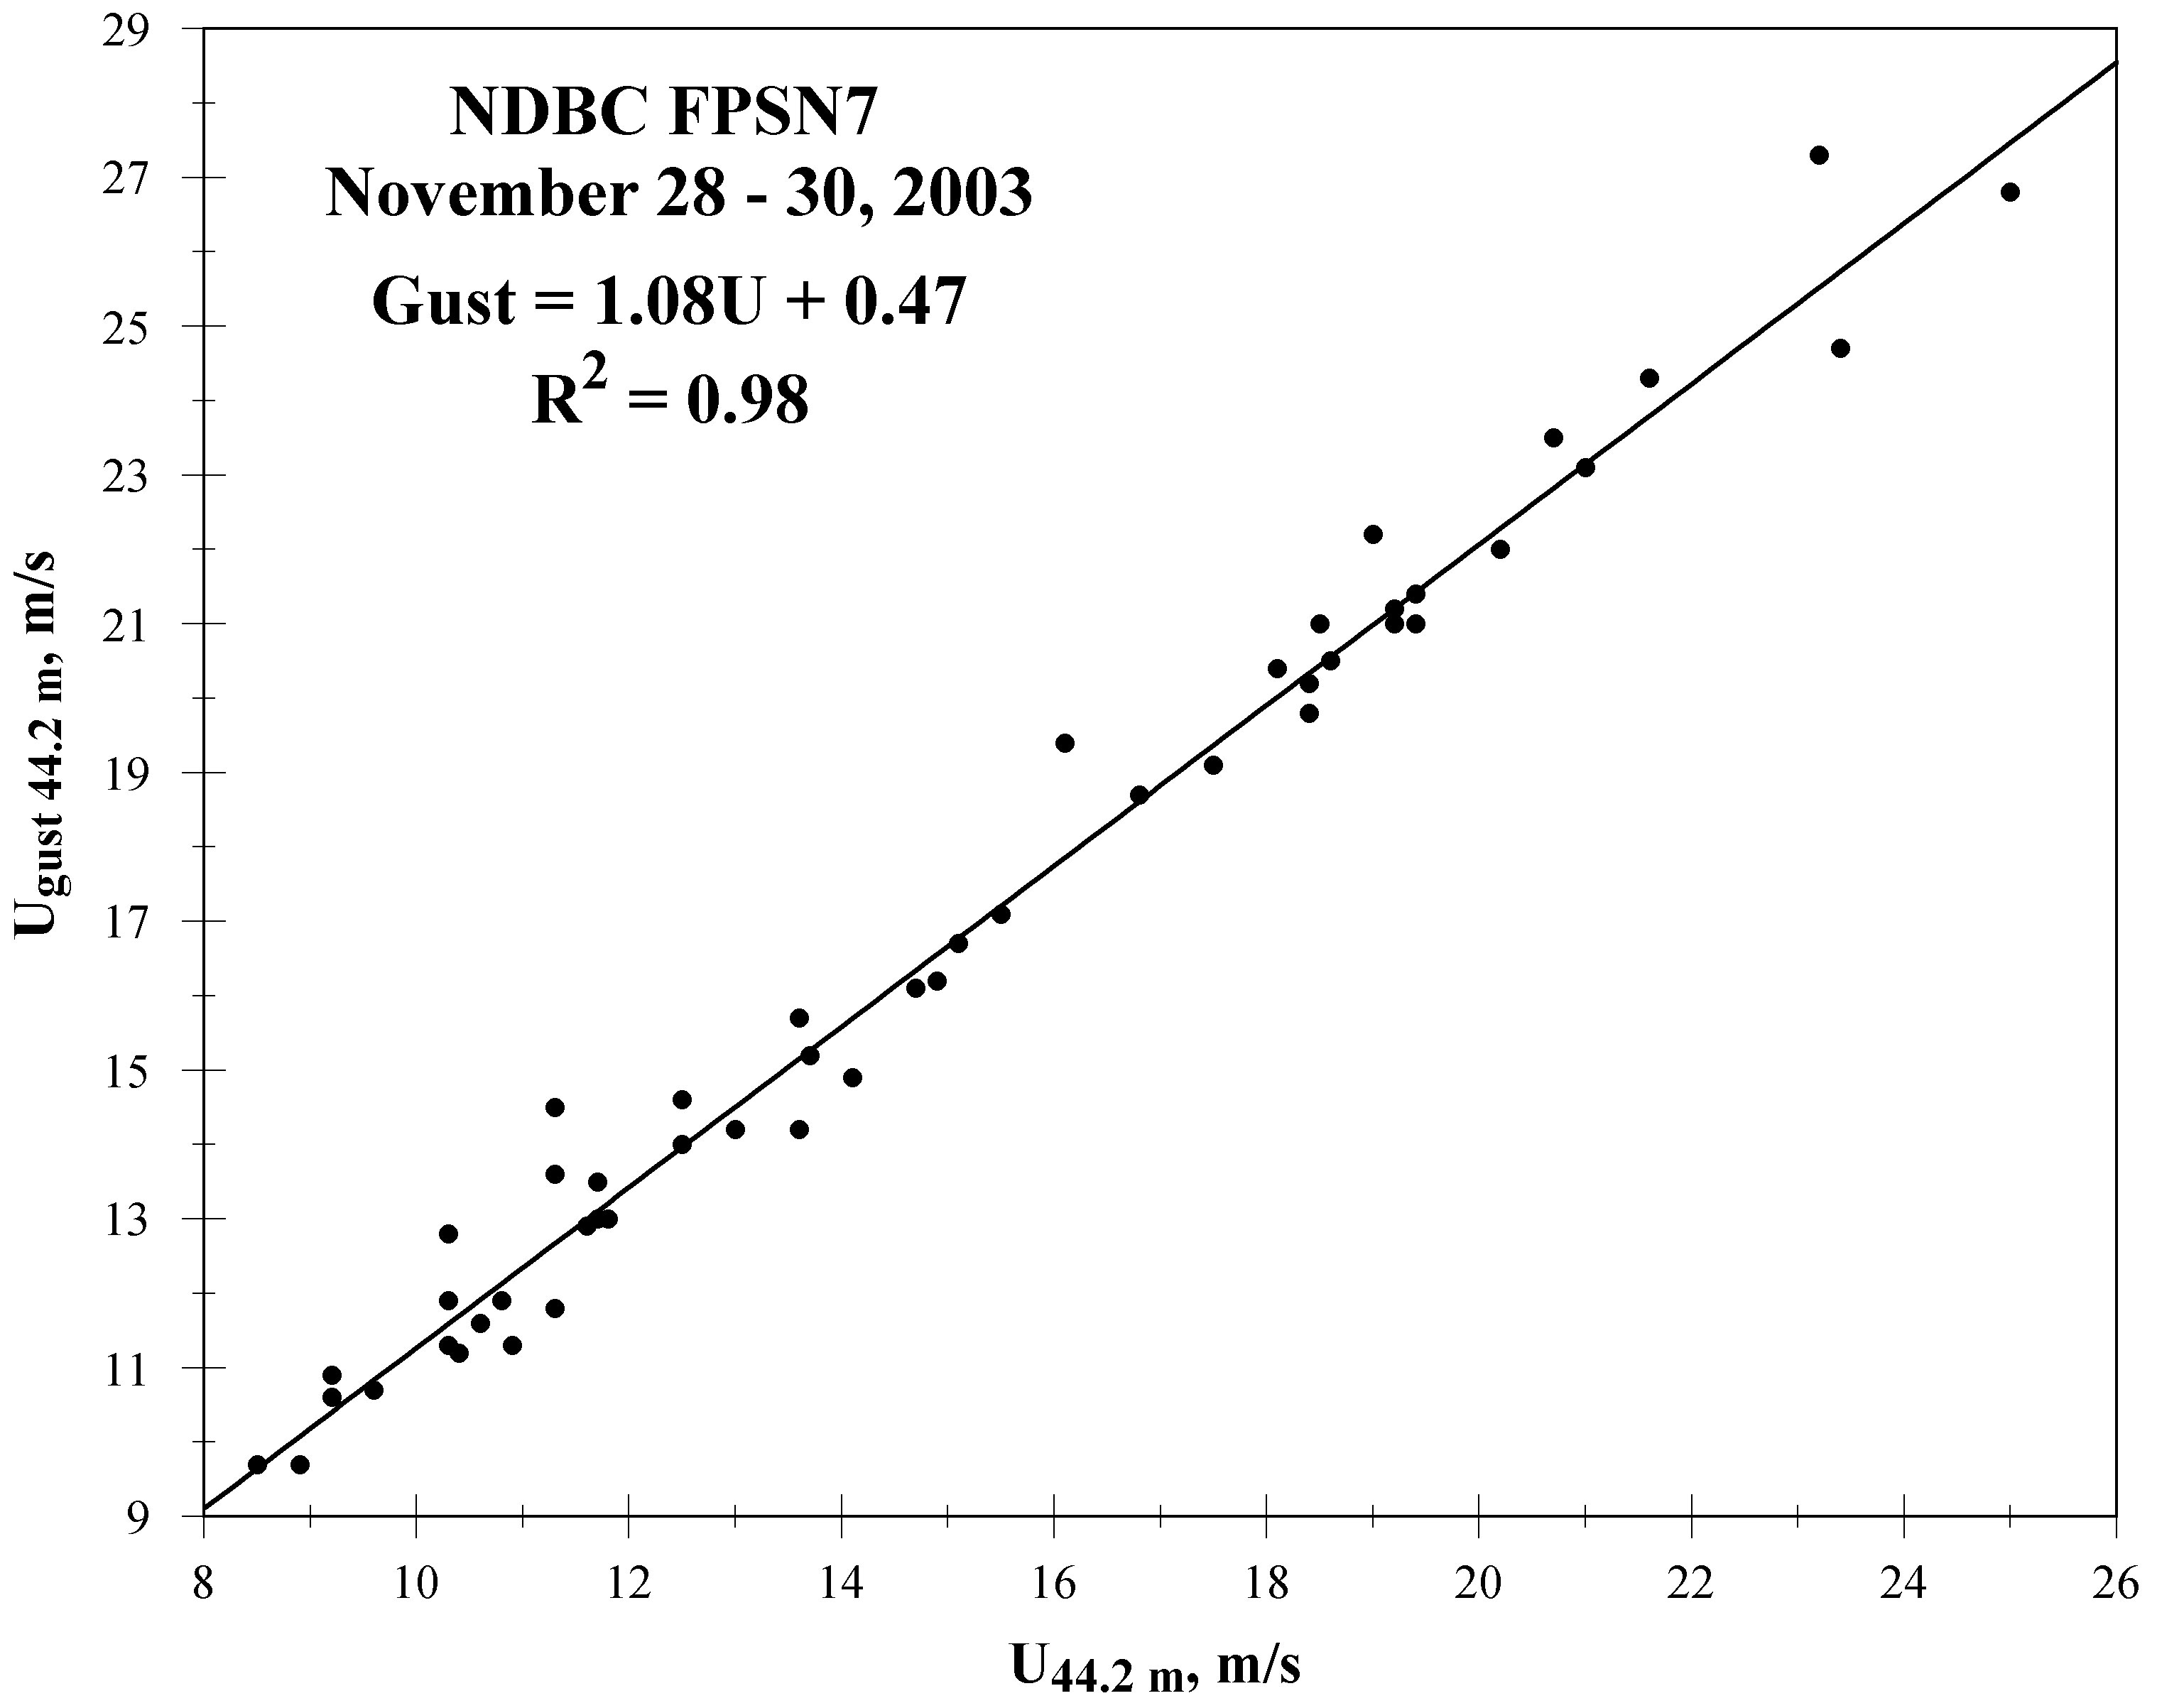

Figure 2b. Variation of GF with height (44.2 m level). Figure 3a. Variation of GF with geography (Bering Sea).
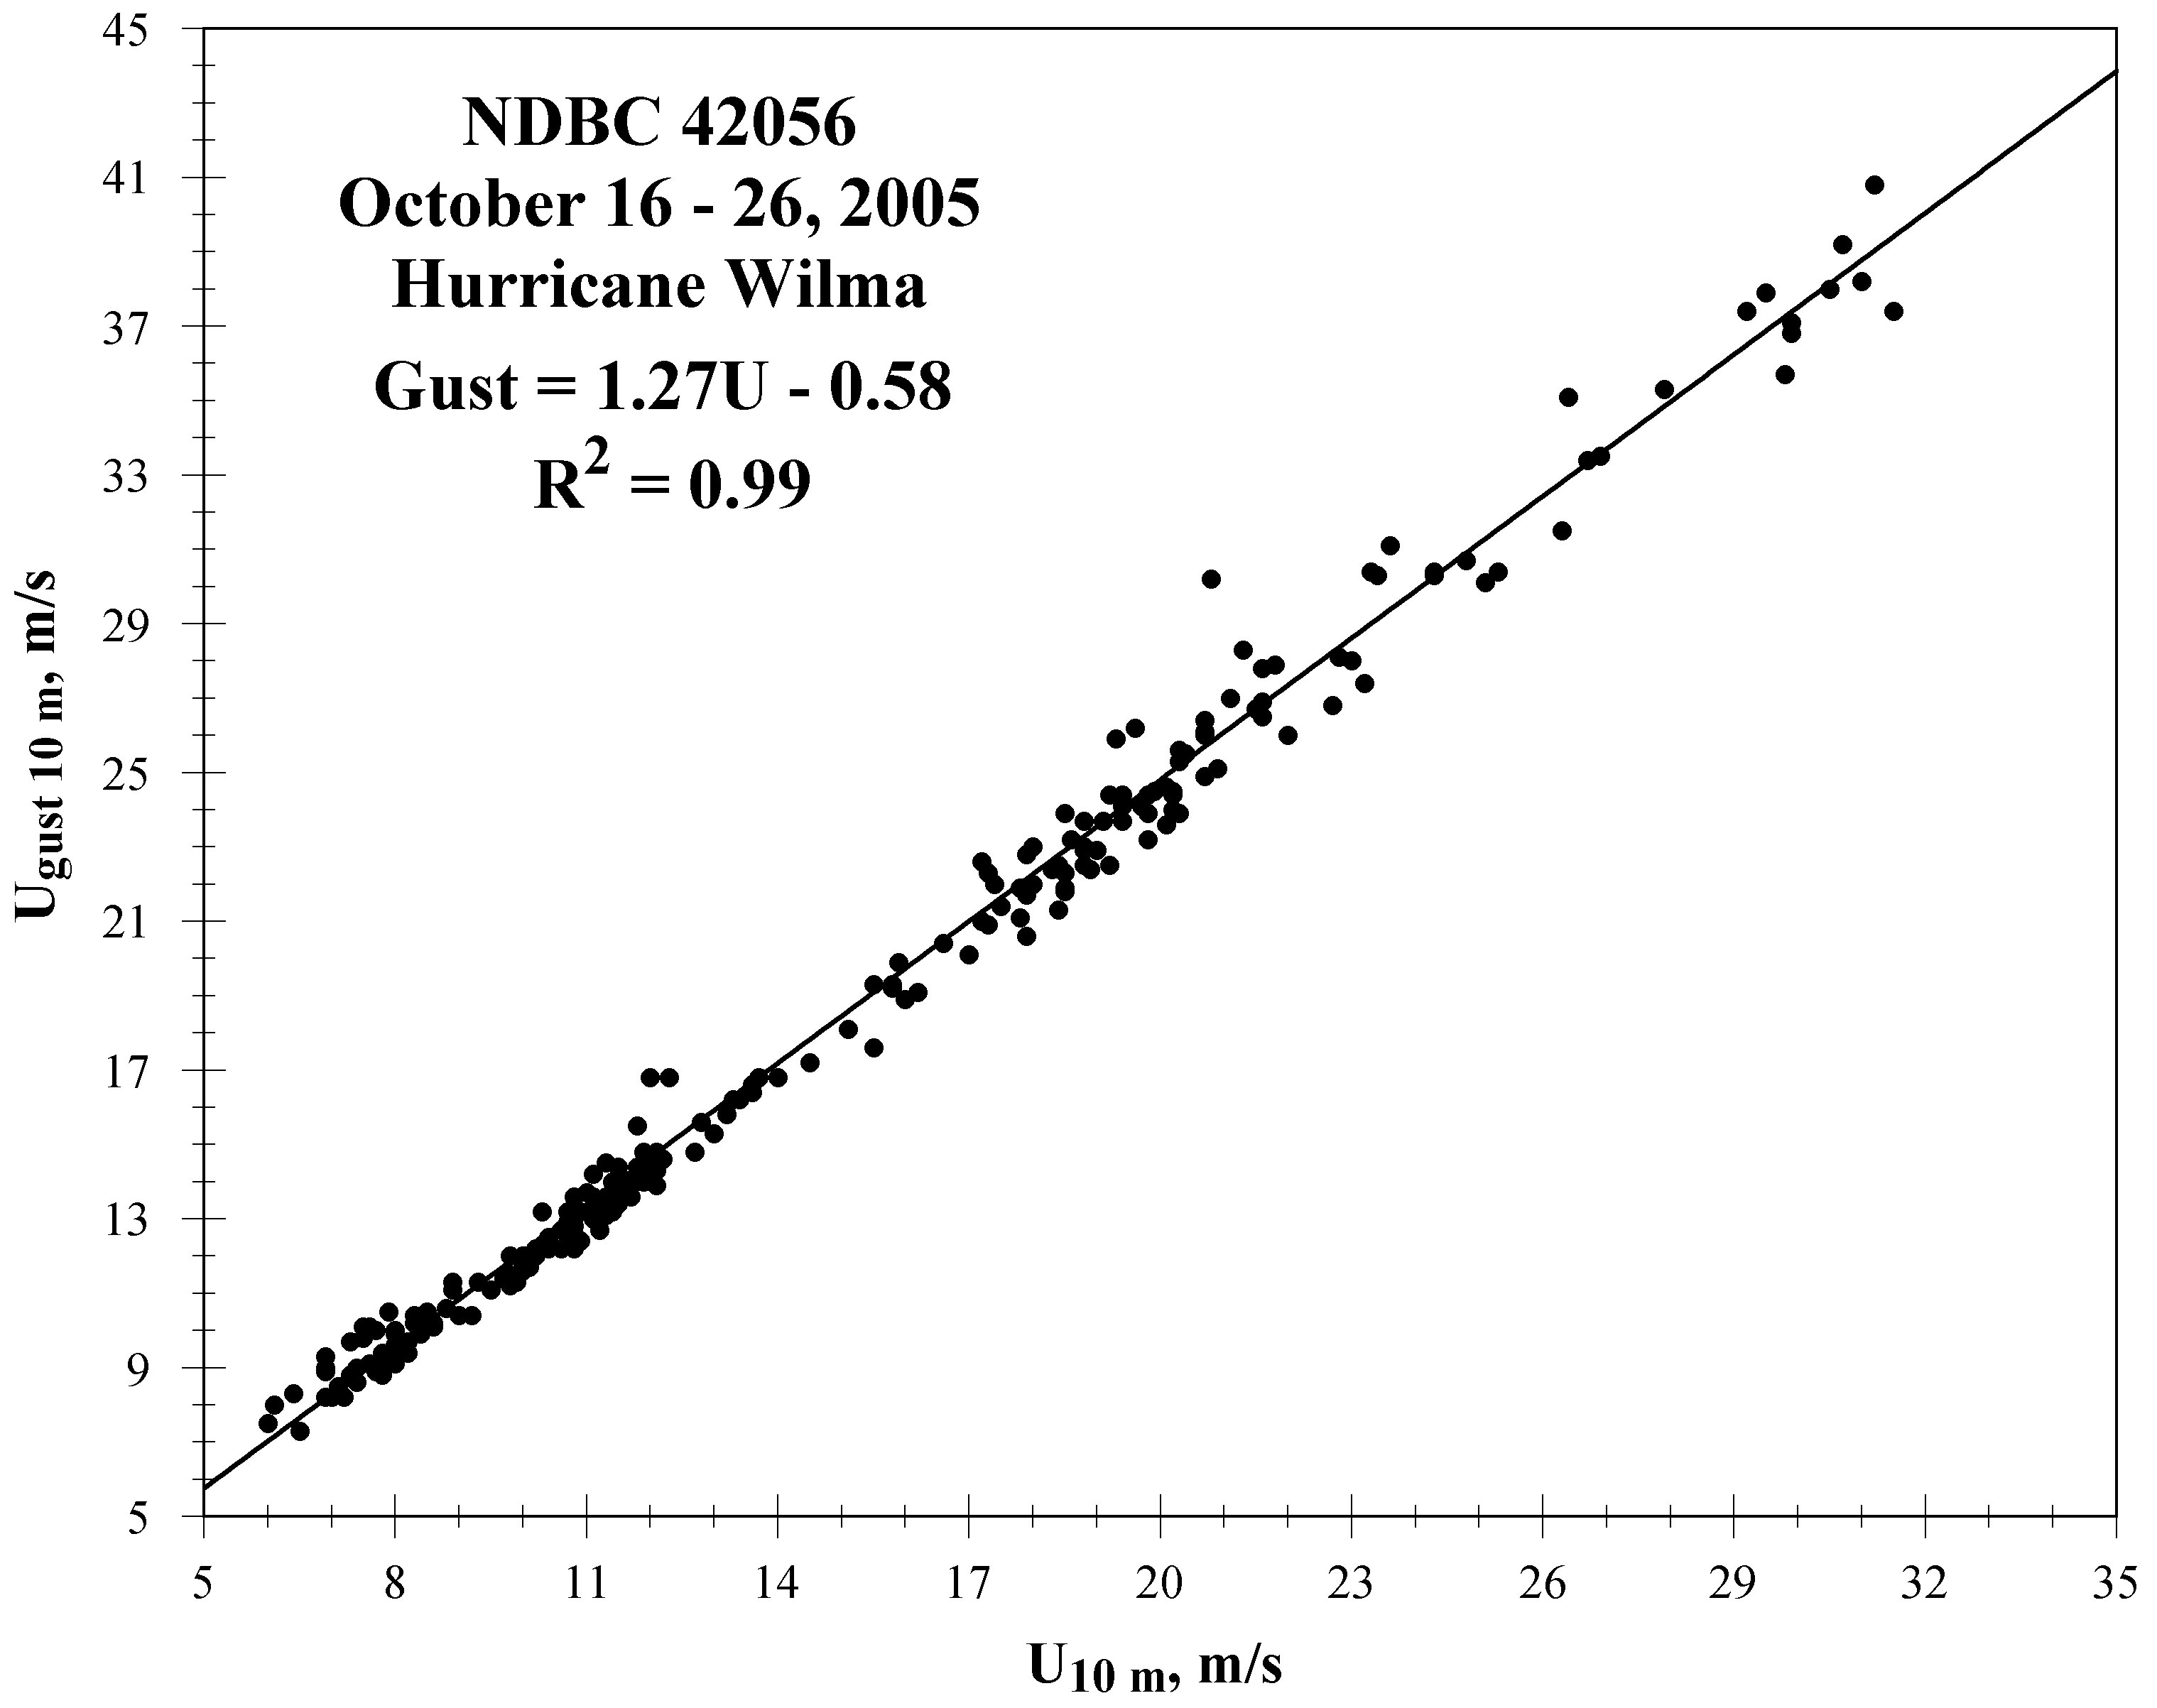
Figure 3b. Variation of GF with geography (Caribbean Sea).
Back to top