Tropical Atlantic and Tropical East Pacific Areas
May to August 2007
Dan Mundell and Hugh Cobb, Tropical Analysis and Forecast Branch, Tropical Prediction Center, Miami, Florida
Introduction
The May through August time period includes the beginning of the 2007 hurricane season. Thus, much of the significant weather during this period was due to tropical cyclones that developed in both the Atlantic and East Pacific Basins. In the Atlantic, five named storms developed during this time frame, including one hurricane (Dean) which reached Category Five status. Gale warnings were issued in TPC’s Tropical Analysis and Forecast Branch (TAFB) Atlantic high seas forecasts on one non-tropical event which transitioned to subtropical storm Andrea. Eight named storms developed in the East Pacific including two hurricanes, while only one non-tropical gale warning was issued for a late season Gulf of Tehuantepec event. The details of the 2007 hurricane season will be discussed in a future edition of the Mariner’s Weather Log.
Atlantic
Pre- Subtropical Storm "Andrea" Gale event
The only non-tropical cyclone gale event in the tropical Atlantic Ocean during the period occurred during the first half of May as Subtropical Storm Andrea was transitioning from a late spring extratropical low into a hybrid tropical cyclone. An area of low pressure developed near the North Carolina coast on 6 May, which then intensified as it drifted ESE over the next 24 hours. At 0600 UTC 7 May, a 998 hPa occluded low was analyzed near 33N72W. The satellite image a few hours later showed a large band of stratiform frontal band showers wrapping around a nearly cloud-free center (Figure 1). In contrast, the satellite image the next day showed the low, now 1000 hPa at 1800 UTC, detached from the front with cumuliform convection developing around the center, an indication that the system was now undergoing a transition to more tropical characteristics (Figure 2). A Quikscat pass at 1107 UTC 8 May showed a large area of gale force winds mainly north of the center, but also extending south to around 29N west of the low (Figure 3). The low produced very large seas and unusually high swells off the southeast United States coast. Buoy 41012 located 40 nmi ENE of St. Augustine Florida reported maximum sustained winds of 34 kts and gusts to 43 kts at 0200 UTC 9 May, and a maximum sea height of 19.5 ft with a 16 second period at 0700 UTC on 8 May
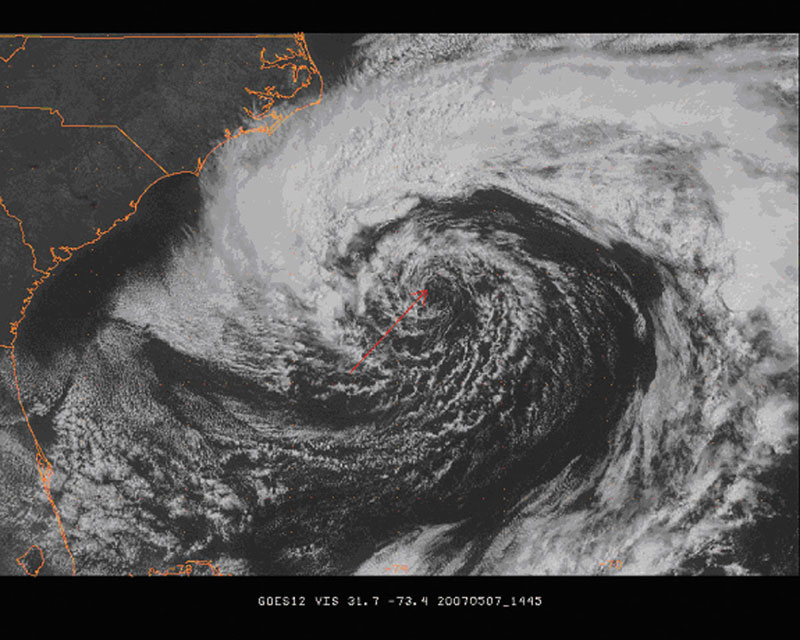
Figure 1. GOES 12 visual satellite image at 1445 UTC 7 May, showing an occluded 998 hPa low pressure system, about 300 nmi east of Charleston, South Carolina.
(Click the image to enlarge)
By 9 May the transition into a "hybrid" subtropical cyclone was nearly complete, as evidenced by a high resolution Quikscat image which shows a nearly continuous ring of 25-30 kt winds around a very large "eye" or area of light winds near the center (Figure 4). The Quikscat imagery also showed the area of gale force winds had rotated completely around the center, and were now located in the SE quadrant. The low was classified as a subtropical cyclone on 9 May, and the National Hurricane Center began issuing advisories at 1500 UTC.
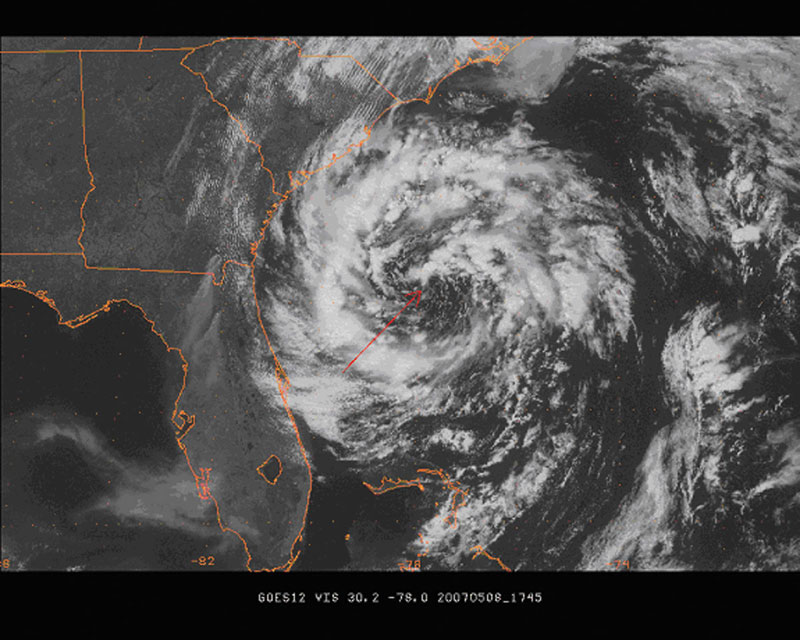
Figure 2. GOES 12 visual satellite image at 1745 UTC 8 May, showing the non-frontal 1000 hPa low, about 200 nmi east of Jacksonville, Florida.
(Click the image to enlarge)
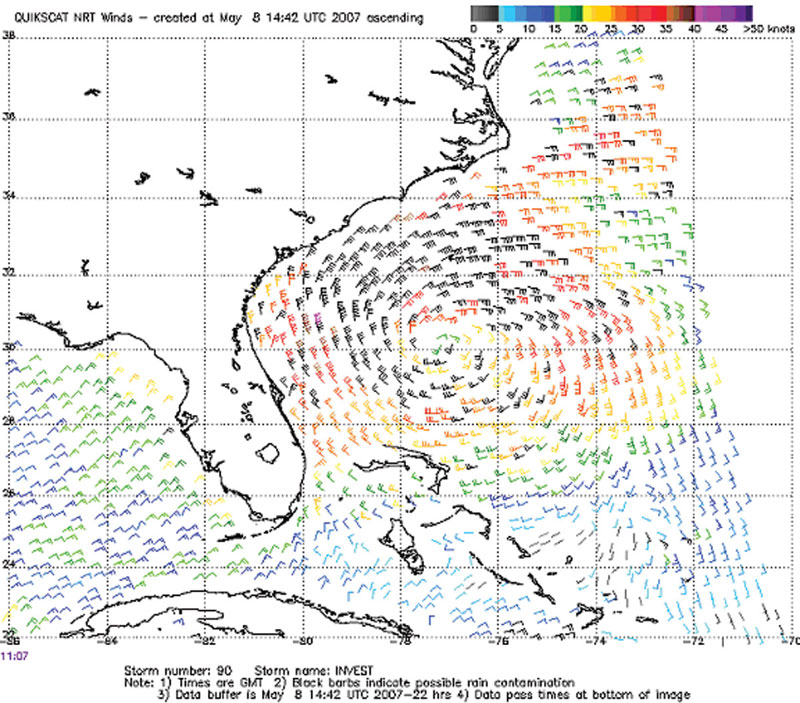
Figure 3. 1107 UTC 8 May Quikscat image of satellite-derived winds off the southeast coast of the United States, showing the radial extent of gale-force winds around the low.
(Click the image to enlarge)
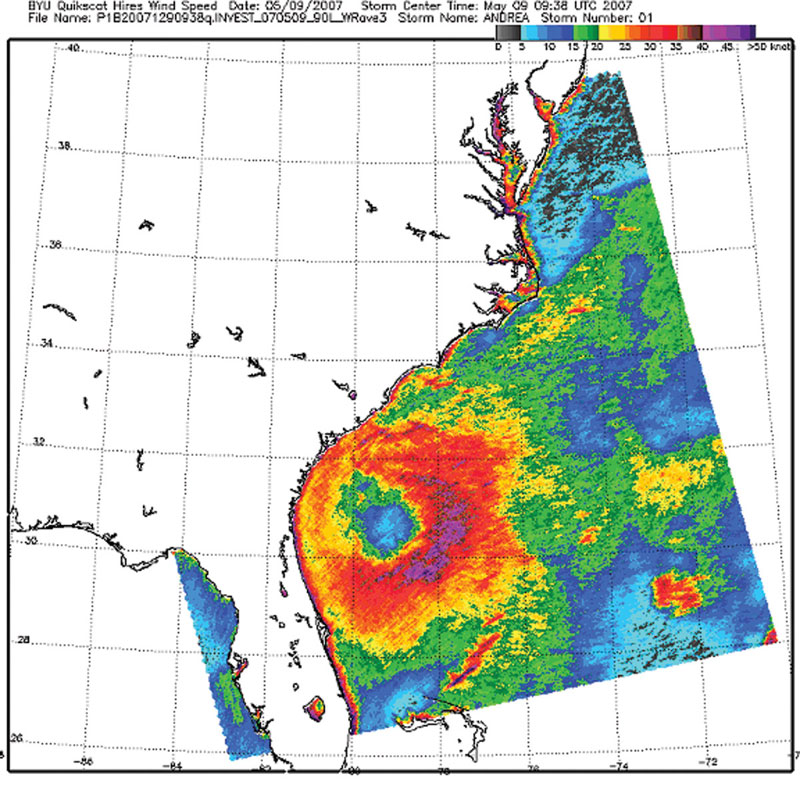
Figure 4. 0938 UTC 9 May depiction of high resolution Quikscat satellite-derived wind speed. Winds near the low are less than 10 kts, while the highest winds (40 to 45 kts) are about 100 nmi east and southeast of the center.
(Click the image to enlarge)
Eastern Pacific
Late Season Gulf of Tehuantepec Gale event
Gulf of Tehuantepec cold season wind events typically end by the first week of April. However, in this past cool season (2006-2007), there was a late season marginal gale event that was captured in the high resolution (12.5 km) QuikSCAT data. Thus, there were a total of 21 gale and storm events with a total of 12 storm force wind events in the 2006-2007 season, the highest number of storm events since records were catalogued in 1999 (Figure 5). The graph shows an upward trend in the number of storm events beginning in the 2002-2003 season. Most of this increase was due to the availability of the high resolution (12.5 km) QuikSCAT data beginning in January 2003.
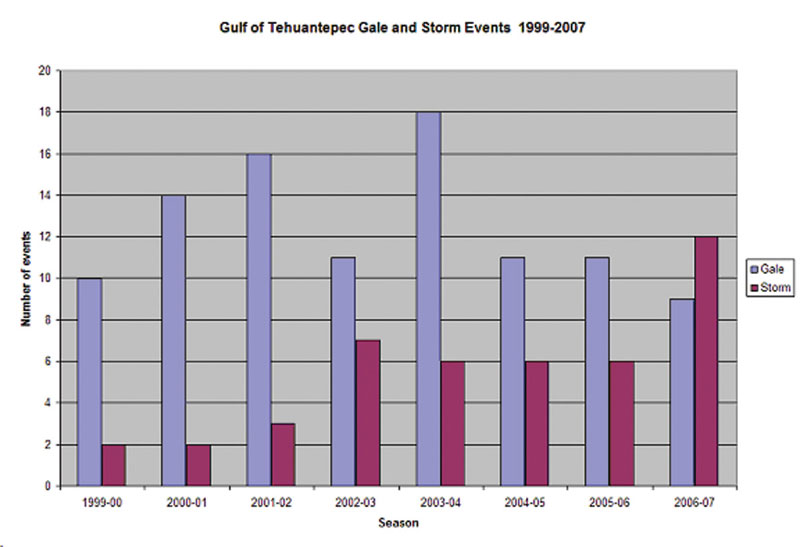
Figure 5. The Total Number of Gulf of Tehuantepec Gale and Storm events by season 1999-2007. There were a record 12 storm events in the 2006-2007 season.
(Click the image to enlarge)
The last gale event commenced around 1200 UTC 17 May, two days after the start for the East Pacific Hurricane Season, and lasted for 42 hours. Northerly winds of 20 to 30 kts had been blowing through the Chivela Pass into the Gulf of Tehuantepec since 15 May. The 1200 UTC 15 May TPC Surface Analysis (Figure 6) showed Salina Cruz reporting northerly winds of 30 kts and a ship Helsinki Express (ZCDT8) located near 14.3N 95.8W reported north-northeast winds of 25 kts and 3 m (10 ft) seas. High Seas forecasts over the next two days indicated northerly winds of 20 to 30 kts over the Gulf of Tehuantepec. A 1211 UTC 17 May QuikSCAT pass indicated a large area of 30 kts winds with isolated 35 kts barbs and prompted the issuance of a Gale Warning for the Gulf of Tehuantepec (Figure 7). An interesting aspect of this QuikSCAT pass was the orientation of the wind swath. Typically wind swaths associated with Gulf of Tehuantepec wind events turn to the right or to the west as they move southward due to coriolis force considerations. The wind swath in this pass was meridional in nature extending straight to the south. A subsequent but partial QuikSCAT pass from 1145 UTC 18 May still revealed the existence of gale force winds in the Gulf, and the Gale warning remained in effect. The gale ended 18 hours later around 0600 UTC 19 May.
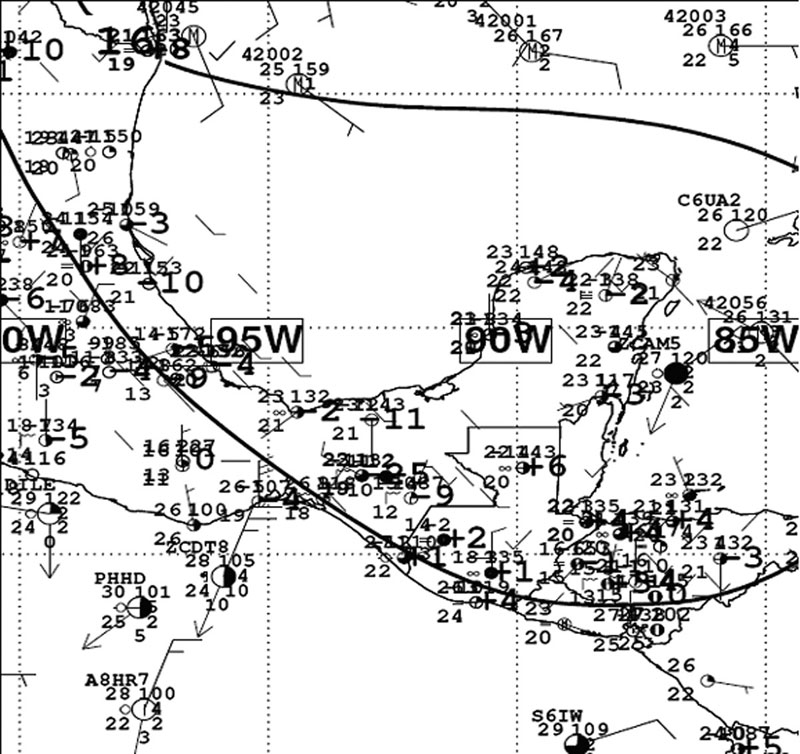
Figure 6. Tropical Prediction Center Surface Analysis valid at 1200 UTC 15 May 2007. Note the 30 kts winds at Salina Cruz and the 25 kts winds from the ship Helsinki Express (ZCDT8).
(Click the image to enlarge)
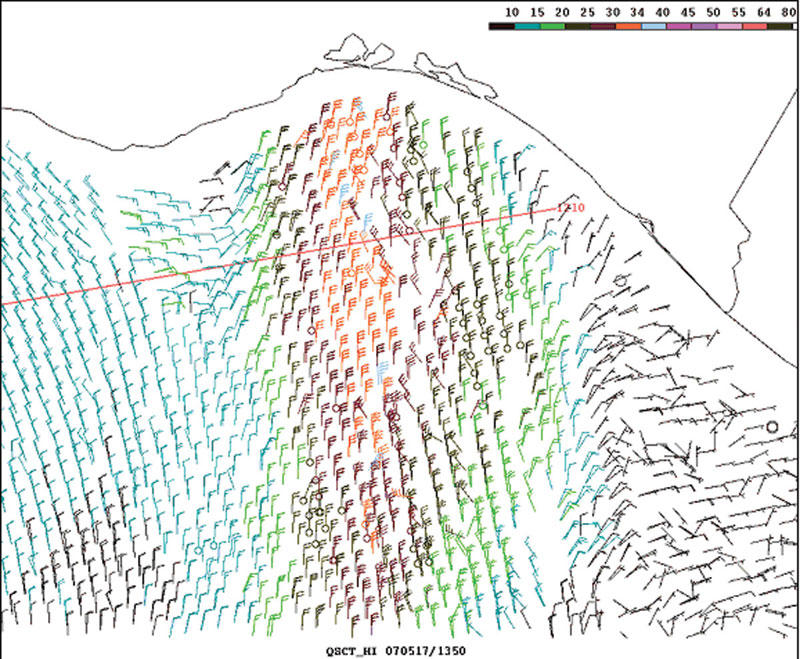
Figure 7. High resolution QuikSCAT image of satellite-derived winds for the Gulf of Tehuantepec at 1211 UTC 17 May, showing an area of high winds between 30 and 35 kts in a north-south oriented swath.
(Click the image to enlarge)