Nowcasting the Significant Wave Height During a Hurricane
Professor S. A. Hsu, Louisiana State University, E-mail: sahsu@lsu.eduIn order to steer a ship away from danger imposed by a tropical cyclone, such as a hurricane, short-term forecasts from minutes to a few hours, or nowcasting, is needed to supplement the "official" forecast. This study was motivated by the following facts: During Hurricane Katrina (see, e.g., Campbell, 2006) at 11GMT on 29 August 2005, the National Data Buoy Center (NDBC) buoy 42040 situated at the water depth of 444 m (see www.ndbc.noaa.gov and www.nhc.noaa.gov for location with respect to the hurricane track and intensity) measured the significant wave height (for definition see, e.g., Ainsworth, 2006) Hs = 16.91 m (or 55 ft), dominant wave period Tp = 14.29 sec, wind speed at 5 m U5 = 27.3 m/s with gust to 33.9 m/s, and the sea-level pressure = 979.3 mb. If we plot these measured Hs and Tp values in an operational wave forecasting nomograph (see, e.g., Hsu, 1988, p. 222, Fig. 8.28), it is found that the required wind speed to generate these 55 ft waves should be at least twice that measured. This indicates that one cannot use the local (in situ) wind to estimate the sea state, particularly when a hurricane is approaching the coast since the wind speed may be reduced faster than the changes in sea state in deep water. Note that since the wave steepness (Hs / Lp where Lp is the wave length, i.e., Hs / 1.56 Tp² = 16.91 / 1.56 (14.29)² = 0.053) is larger than 0.030, the sea state is not in the fully developed (or swell) condition (for more detail, see Hsu 2006) but was still in the windsea stage.
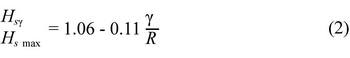
An alternate method is as follows: according to Hsu (1991)
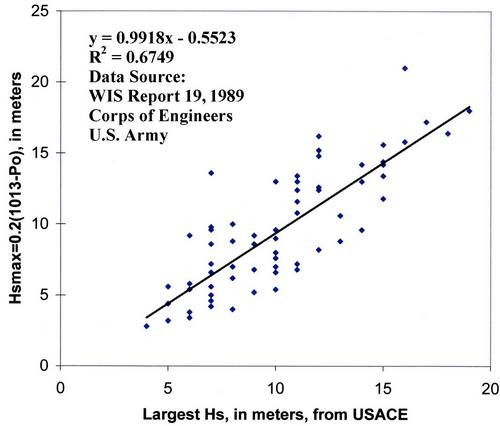
where Hs max is the maximum Hs (in meters), and P0 (in mb) is the hurricane‘s minimum sea-level pressure (which is normally provided by an "official" agency such as the National Hurricane Center). Further verification of Eq. (1) is provided in Figure 1 (based on data provided in Abel et al. (1989)). It can be seen that Eq. (1) is useful operationally.
Now, according to Hsu et al. (2000),
and
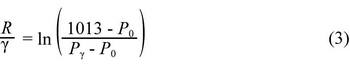
where Hs max is the Hs value at distance γ away from the hurricane center, R is the radius of maximum wind, and Pγ is the pressure at γ. Note that since a tropical storm begins with wind of 18 m/s (35 kts), Pγ needs to be approximately 1000 mb or less.
During Katrina in the Gulf of Mexico at 18GMT on 28 August 2005, P0 = 902 mb. Since Pγ = 979.3, Hs γ = 16.91 m and Tp = 14.29 sec at buoy 42040 at 11GMT on 29 August, and from Eq. (3),
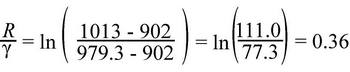
or γ / R = 2.78.
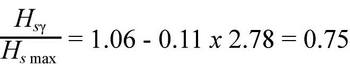
Now, by substituting this value into Eq. (2) we have
or
Also, substituting P0 = 902 into Eq. (1), one gets
From Eqs. (4) and (5), we have Hs g = 16.74 m, which is in excellent agreement with the measured value of 16.91 m at buoy 42040.
Another example is based on the same data sources, but for Hurricane Ivan in September 2004 in the Gulf of Mexico that at 00GMT on 15 September, P0 = 928 mb, and from Eq. (1), Hs max = 17.0 m. At buoy 42003 at 01GMT on 15 September, Pγ = 993.7 mb, Hs γ = 11.04 m and Tp = 12.9 sec. Thus Hs γ / Lp = 11.04 / (1.56 x 12.92) = 0.043 indicating that sea state was not fully developed. Now, substituting P0, Pγ, and Hs max values into Eqs. (2) and (3) as before, we get γ / R = 3.88 and Hs γ = 0.63 x 17.0 = 10.7 m. This Hs γ value is also in excellent agreement with the measured Hs γ = 11.04 m.
It is thus concluded that the significant wave height during a tropical cyclone can be "nowcasted" using the method proposed in this study. Note that in the open sea the wave height may be higher due to added effects by the swells. Note also that the wave height is generally lower on the left-hand side of hurricanes due to the opposing effects of wind and waves, if one moves with the storm track (see Hsu et al., 2000).
References
Abel, C. E., B. A. Tracy, C. L. Vincent, and R. E. Jensen, Hurricane Hindcast Methodology and Wave Statistics for Atlantic and Gulf Hurricanes from 1956 - 1975, (WIS Rept. 19, U.S. Army Corps of Engineers, P.O. Box 631, Vicksburg, MS, 39181-0631, 1989).
Ainsworth, T., When do ocean waves become ‘significant’? A closer look at wave forecasts, (Mariners Weather Log, Vol. 50, No. 1 (April 2006). Also available online at http://vos.noaa.gov/MWL/apr_06/waves.shtml.
Campbell, P. From the PMO Desk: Hurricane Katrina aftermath, (Mariners Weather Log, Vol. 50, No. 1 (April 2006), pp. 30 - 36. Also available online at http://vos.noaa.gov/MWL/apr_06/katrina.shtml).
Hsu, S. A., Coastal Meteorology. (Academic Press, San Diego, CA, 1988).
Hsu, S. A., Forecasting hurricane waves, (Mariners Weather Log, Vol. 35, No. 2, 1991, pp. 57 -58).
Hsu, S. A., Measurements of overwater gust factor for NDBC buoys during hurricanes. (Article # 2006-EJ2 [pdf] in NWA Electronic Journal of Operational Meteorology, 2006. Available online at http://www.nwas.org/ej/2006/2006.html).
Hsu, S. A., M. F. Martin, Jr., and B. W. Blanchard, An evaluation of the USACE‘s deepwater wave prediction techniques under hurricane conditions during Georges in 1998, (Journal of Coastal Research, Vol. 18, No. 3, 2000, pp. 823 - 829).