Operational Ocean Prediction and the Mariner
Ian T. Hunter, South African Weather ServiceThe term "metocean" is now commonly used by marine weather services to indicate the atmosphere/ocean mix of products that many clients working in a marine environment require. Metocean satellites provide information on sea surface temperatures, ocean surface winds and waves, sea surface heights and even biological information relevant to fisheries.
Numerical Weather Prediction (NWP) models have increased steadily in accuracy since the late 1970’s. Similarly the wave prediction models had become of significant benefit to ocean users by the end of the 80’s. In both cases the improvements were largely due to ever-increasing model resolution, improved representation of the actual physical processes and the rapidly increasing volume of input data from satellites. The deployment of ocean data collection platforms has also been a significant factor. For example, satellite-borne radar altimeters provide wave height measurements that are fed into the wave models, in addition to in-situ wave measurements from moored buoys. Wind vectors from scatterometers, such as the one flying on the QuikSCAT satellite, have been assimilated into the NWP models since 2001.
Tropical cyclone track predictions have also improved considerably. With a very quiet 2005/6 season in the South-West Indian Ocean Basin, the only significant system to enter the Mozambique Channel was "Boloetse." Although it seemed inevitable that it would hit the coast north of Beira, the models predicted the sudden southward swing two days in advance. There was no significant wind or wave damage on the Mozambican coast.
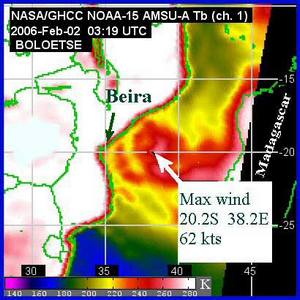
Pictured on the right, sensors operating in the microwave portion of the electromagnetic spectrum are affected little by cloud or rain. Data from the AMSU-A sounder (flying on the more recent NOAA POES satellites) - has resulted in more accurate analyses of tropical cyclones such as "Boloetse".
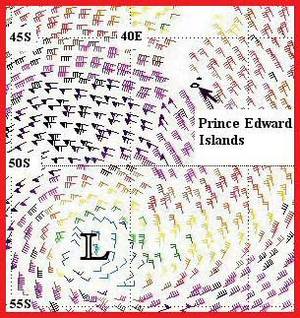
Pictured on the left, ocean surface winds derived from the QuikSCAT satellite on 18 August 2006. On this day the SA Agulhas was unloading cargo at Marion Island (site of an important South African weather base and part of the Prince Edward Island group). She confirmed winds of over 50 kts. These "scatterometer" winds are routinely assimilated into the NWP models.
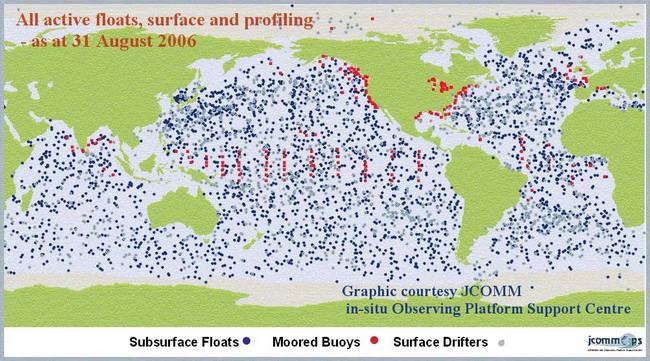
This map shows the position of all floating platforms which were collecting metocean data as at 31 August 2006. One surface drifter deployed by the South African Weather Service in September 2001 continued to provide barometric pressure to the numerical weather prediction models for almost four years. Note that there are very few moored, metocean buoys in the Southern Hemisphere.
Image located at: http://wo.jcommops.org/cgi-bin/WebObjects/Argo.woa/1/wo/6lZlqiadEclLzGrrB2otX0/9.0.0.3.1
Whereas satellites provide global coverage, in-situ data are still extremely important. Satellite sensors still have to be calibrated using in-situ data and there are some parameters they cannot measure (e.g., sea level pressure). Furthermore, most of the ocean surface measurements come from polar-orbiting satellites (as opposed to the geostationary satellites)—i.e., their temporal coverage is generally poor.
Surface drifters with onboard barometers and sea surface temperature sensors have been deployed for over two decades; whilst the profiling/subsurface float programs were only begun in earnest five to six years ago. One of the reasons behind the Argo float deployment program was the development of numerical models designed to predict (additional to the surface wind and sea state forecasts already available) sea temperature, salinity and ocean circulation throughout the water column.
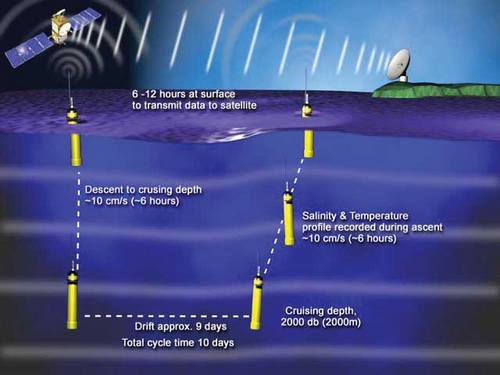
An Argo profiling float cycling through the water column.
Graphic courtesy of National Oceanographic Centre Southampton http://www.soc.soton.ac.uk/ JRD/HYDRO/argo/index.php
Consider the three images from the NLOM ocean prediction model, courtesy of the US Naval Research Laboratory: recent actual versus predicted surface circulation in South African waters. SST is not always a good indicator of ocean circulation. This is borne out by the way in which the eddy south-west of Cape Town is best captured in the last image i.e., ocean currents calculated from a combination of satellite-derived sea surface heights and the surface wind field. Currents around such eddies can be up to two kts, making information on the analysed/forecast position of these features particularly useful for slow-moving vessels, such as tugs with rigs/barges on tow.
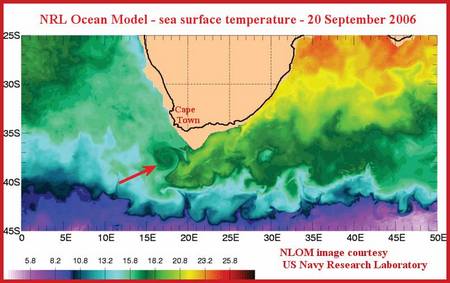
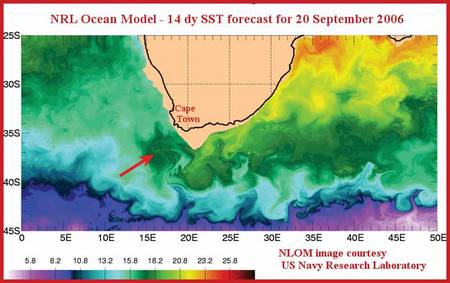
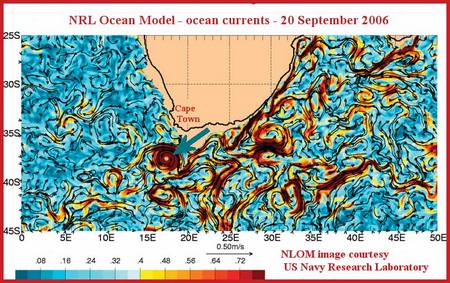
Three images from the NLOM ocean prediction model run by the US Navy Research Laboratory show the actual sea surface temperature (SST) on 20 September 2006, the 14-day forecast for that day, and the actual ocean surface currents calculated from satellite information. Note that the model does not include the shallow waters of the continental shelves.
Similarly, in the Agulhas Current itself, vessels sailing south from Durban generally seek out the core of the Current to add several knots to their speed. However, current meter measurements have shown that the Agulhas Current can shift laterally over a 100 km seaward in a day due to the so-called ’Kwazulu Natal Pulse’ propagating down the east coast. A high resolution ocean prediction model—which includes the continental shelf region—could provide useful information for both southbound and northbound vessels.
In all of these models—NWP, wave and ocean—continued improvements in accuracy rely on developments in the following areas :
- High resolution regional or even mesoscale models
- Further improvements in model physics
- More/ better input data, in-situ and remotely-sensed
- The use of ’ensembles‘ - where the model is run many times with slight adjustments to the initial analysis, so that probabilities may be linked to different forecast scenarios.
While there are a great variety of ocean surface parameters being derived from satellites—and subsequently being fed into the various numerical prediction models—many of these satellites are not part of an operational "constellation." That is, there is no back-up should that particular satellite fail. Several of them have gone well beyond their designed life-time. This is obviously cause for concern as failure of a single satellite could significantly affect model performance.
As regards to in-situ data, recent statistics have shown that ocean data collection platforms providing barometric pressure data to the NWP models have increased steadily in number over the past few decades. However this is mainly due to increased numbers of drifting buoys. The number of Voluntary Observing Ship (VOS) reports globally have remained generally static, even decreasing at times.
The alternative of fitting vessels with automatic weather stations (AWS) has had limited impact. Installation can be a problem, e.g. many shipboard AWS do not have anemometers. Furthermore, important phenomena such as present weather (e.g. fog), sea state estimates, SST etc - are lost. This is the sort of information used by the marine forecaster to do an initial evaluation of the model prediction and to fine tune the short-term forecast.
Weather prediction began with the mariner. For over 150 years ships have been providing invaluable marine observations, and VOS databases continue to provide the basis for long-term metocean climatology. It is therefore fitting that the mariner should benefit from the new emphasis on operational ocean prediction.