Marine Weather Review - North Pacific Area
May through August 2005
By George P. Bancroft, NOAA National Center for Environmental Prediction
Introduction
This four-month interval is typically a period of declining non-tropical cyclonic activity as late spring progresses into summer. There was a hurricane-force storm just west of the U.S. Pacific Northwest offshore waters in late May, a very unseasonable event that stood out as the most significant non-tropical event of the period. July is typically the least active month over the North Pacific, and this year was no exception with much of the North Pacific having no storm-force lows, except for tropical activity. Cyclonic activity usually picks up in August, and this was somewhat the case in 2005, but unlike the North Atlantic, there were no deep lows with pressures below 980 hPa.
There was no tropical cyclone activity in the western North Pacific from May into the early part of June. Activity picked up thereafter, with June contributing one tropical cyclone, July three and August four tropical cyclones. Two of the cyclones entered OPC's high seas waters before becoming extratropical. No tropical cyclones redeveloped into powerful storms after becoming extra-tropical.
Tropical Activity
|
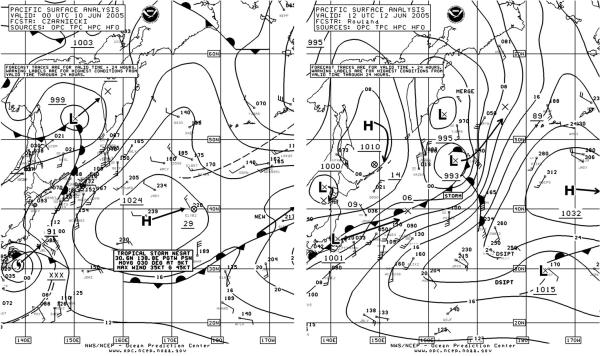
Figure 1.-OPC North Pacific Surface Analysis charts (Part 2) valid 0000 UTC June 10 and 1200 UTC June 12, 2005. Tropical Storm Nesat is depicted becoming an extratropical storm. |
Typhoon Nesat: Nesat came from west of OPC's oceanic map area, reaching 23N 134E at 1800 UTC June 6 with maximum sustained winds 120 kts with gusts to 145 kts, and turned north toward Japan while weakening. By 1200 UTC June 8 Nesat was a minimal typhoon with maximum sustained winds 65 kts with gusts to 80 kts, near 26N 135E. The Amapola (H9YY) near 35N 135E reported south winds of 50 kts six hours later. The cyclone weakened to a tropical storm by 0000 UTC on the 9th, and became an extratropical gale thirty hours later while passing 200 nmi southeast of Tokyo. Nesat underwent some redevelopment as an extratropical low, briefly developing storm-force winds on the 12th. Figure 1 depicts this transition to an extratropical storm over a sixty hour period. At 0000 UTC June 13 the SeaLand Reliance (WFLH) reported a south wind of 50 kts near 44N 176E. The cyclone then stalled in the western Bering Sea as a gale with the central pressure as low as 985 hPa early on the 13th, before looping southeast and weakening to below gale force in the central Aleutians on the 16th.
Tropical Storm Haitang: Tropical Depression 05W formed near 23N 153E at 1200 UTC July 11 with maximum sustained winds 25 kts with gusts to 35 kts. The cyclone was named Tropical Storm Haitang at 0000 UTC July 12 near 23N 152E, with maximum sustained winds 35 kts with gusts to 45 kts. Haitang then intensified to a typhoon near 21N 146E at 1800 UTC on the 13th with maximum sustained winds 70 kts with gusts to 85 kts, and continued to track west while intensified. At 0600 UTC July 14 the Taio Cosmos (ELMA6) encountered north winds of 40 kts near 23N 139E while the typhoon was located near 20N 142E. Haitang then passed west of OPC's oceanic radiofacsimile map area early on the 15th and became a super typhoon while crossing 20N 130E at 0000 UTC on the 16th.
Tropical Storm Nalgae: Tropical Depression 06W formed near 24N 164E at 0000 UTC July 20 with maximum sustained winds of 30 kts with gusts to 40 kts and moved northwest, becoming Tropical Storm Nalgae six hours later. The cyclone developed a maximum intensity of 50 kts sustained winds and gusts to 65 kts with the center near 29N 160E at 1200 UTC on the 21st. Nalgae crossed into OPC's high seas area (north of 30N and east of 160E) as a weakening tropical storm on July 22, with the center near 32N 160E at 1800 UTC July 22. Nalgae then became an extratropical gale near 34N 162E with 1006 hPa central pressure twenty-four hours later. The extratropical remains of Nalgae were later absorbed on July 28 by another low, former Tropical Storm Banyan, to be described below.
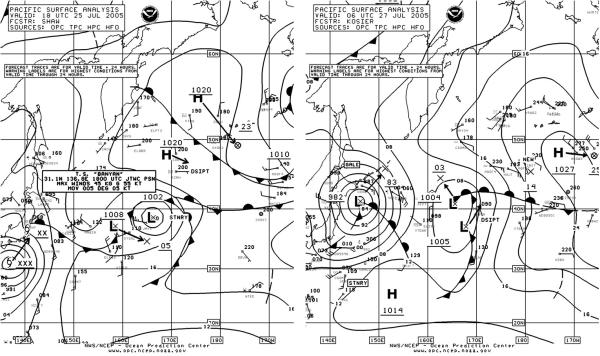 |
Figure 2.-OPC North Pacific Surface Analysis charts (Part 2) valid 1800 UTC July 25 and 0600 UTC July 27, 2005. Tropical Storm Banyan is shown becoming extratropical. |
Tropical Storm Banyan: Banyan arrived in OPC's oceanic map area from the south as a minimal tropical storm, located near 16N 138E at 0600 UTC July 22. Banyan intensified to a strong tropical storm while moving north to 25N 137E by 1200 UTC July 24, with maximum sustained winds 60 kts with gusts to 75 kts. The cyclone then weakened to a minimal tropical storm while passing just east of Tokyo early on the 26th, with extratropical transition coming early the next day. Some selected observations taken during the storm's passage are listed in Table 1. Figure 2 shows Tropical Storm Banyan becoming extratropical while passing east of Japan, during the 36-hour period ending at 0600 UTC July 27. The central pressure was as low as 980 hPa as extratropical Banyan passed over the southern Kurile Islands on the 27th, before the cyclone weakened.
| OBSERVATION | POSITION | DATE/TIME (UTC) | WIND (kts) | SEAS (m/ft) |
| Edisongracht (PDUJ) | 22N 140E 21N 141E |
23/0600 24/0000 |
S 45 S 55 |
12.0/39 8.5/28 |
| Maharashtra (VTSQ) | 33N 139E | 26/0000 | SE 55 | |
| Shinchi Maru (JBKB) | 36N 144E | 26/0000 | SE 35 | 8.0/26 |
| New Oasis (3ENO4) | 33N 135E | 26/0000 | N 35 | 8.0/26 |
| Overseas Joyce (WUQL) | 35N 143E | 26/1200 | S 55 | |
| Pudong Senator (DQVI) | 38N 146E | 27/0000 | S 55 | 7.5/25 |
| Buoy 52523 | 17N 139E | 23/0800 | SW 55 | |
| Buoy 52520 | 23.5N 139.5E | 24/0700 | S 60 | |
| Buoy 52690 | 28.2N 139.3E | 25/0100 | SE 50 |
Table 1.-Some ship and buoy observations taken during passage of Tropical Storm Banyan.
Super Typhoon Mawar: Tropical Depression 11W formed near 21N 143E at 1200 UTC August 19 with maximum sustained winds 30 kts with gusts to 40 kts, and drifted northwest, intensifying to Tropical Storm Mawar six hours later with maximum sustained winds 45 kts with gusts to 55 kts. Mawar then continued to drift northwest while rapidly intensifying, becoming a typhoon near 22N 141E with maximum sustained winds 80 kts and gusts to 100 kts at 0000 UTC on the 21st, and a super typhoon twenty four hours later near 23N 139E with maximum sustained winds 130 kts and gusts to 160 kts. The cyclone then weakened in the next twenty-four hours and then maintained an intensity near 105 kts for sustained winds until early on the 24th. Mawar then passed south of Japan near 32N 137E on the 24th with maximum sustained winds 90 kts with gusts to 110 kts before turning more north and northeast. Mawar then passed just south of Tokyo at 1800 UTC August 25 with maximum sustained winds 85 kts and gusts to 105 kts. The ship (9MRW7) (32N 138E) encountered southwest winds of 40 kts at that time. Mawar then weakened to a tropical storm by early on the 26th while heading northeast away from Japan, before becoming an extratropical gale near 37N 150E at 0600 UTC on the 27th. The extratropical remains of Mawar then drifted east, and dissipated by the end of the month.
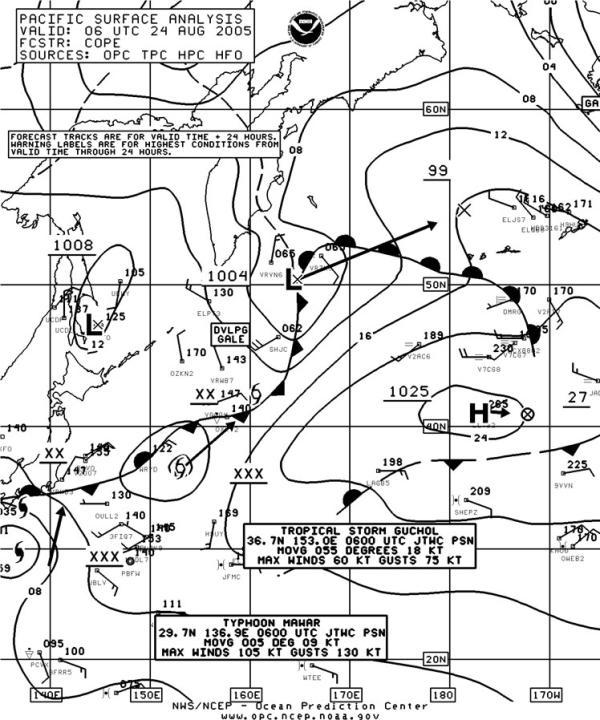 |
Figure 3.-OPC North Pacific Surface Analysis chart (Part 2) valid 0600 UTC August 24, 2005. Typhoon Mawar and Tropical Storm Guchol are shown. |
Tropical Storm Guchol: This cyclone was a weaker companion to Mawar, originating at about the same time as Tropical Depression 12W near 23N 151E at 0000 UTC August 20 and drifting northwest. The cyclone became Tropical Storm Guchol near 25N 148E at 0600 UTC August 21 with maximum sustained winds of 40 kts with gusts to 50 kts. At 0000 UTC on the 22nd Guchol reached maximum intensity, with maximum sustained winds 60 kts with gusts to 75 kts, near 27N 147E. The cyclone then maintained a similar intensity while moving northeast to 37N 153E by 0600 UTC on the 24th. Figure 3 shows both Guchol and Mawar east and south of Japan, respectively. Guchol then weakened and entered OPC's high seas area near 41N 160E as a minimal tropical storm at 0000 UTC August 25, and then became extratropical six hours later. Guchol's remains then moved north into the Bering Sea as a gale on the 27th, before reaching mainland Alaska on the 29th.
Typhoon Talim: Tropical Storm Talim entered the far southwest portion of OPC's oceanic chart area, south of Japan and moved northwest, becoming a typhoon near 20N 137E at 1200 UTC August 28 with maximum sustained winds of 70 kts with gusts to 85 kts. The typhoon then passed west of 135W late on the 28th.
Typhoon Nabi: Nabi moved northwest to 17N 142E at the end of August with maximum sustained winds 105 kts with gusts to 130 kts as of 1800 UTC August 31.
Other Significant Events
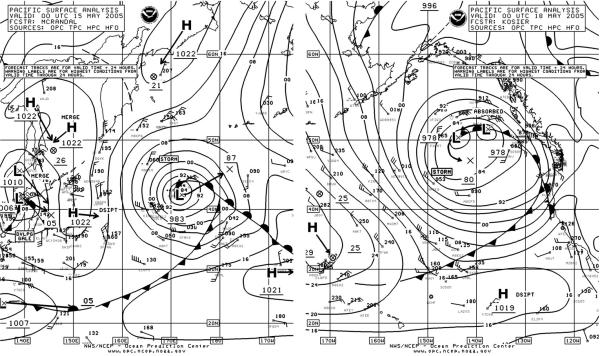 |
Figure 4.-OPC North Pacific Surface Analysis charts valid 0000 UTC May 15 (Part 2) and 0000 UTC May 18, 2005. |
North Pacific Storm, May 14-18: This low originated as a gale passing southeast of Japan on May 12 and moved across the North Pacific over the next five days, strengthening to a storm during the period from 1200 UTC May 14 until 1800 UTC May 15, with the central pressure down to 983 hPa by 0000 UTC on May 15 (Figure 4). Available ships reported gale-force winds, but a QuikSCAT overpass on the morning of May 15 revealed 50 kts wind barbs northeast of the center near the occlusion, and also south of the center. The cyclone was classified as a gale after it crossed the dateline, until it arrived off the U.S. West Coast where it attained its lowest central pressure of 977 hPa at 0600 UTC on the 18th. As the front approached the coast, the Colorado Voyager (KLHZ) (43N 126W) near the Oregon coast encountered south winds of 50 kts at 0000 UTC May 18. Reported seas were 6.0 m. The cyclone subsequently stalled and slowly weakened, and drifted north into the Gulf of Alaska by the 21st.
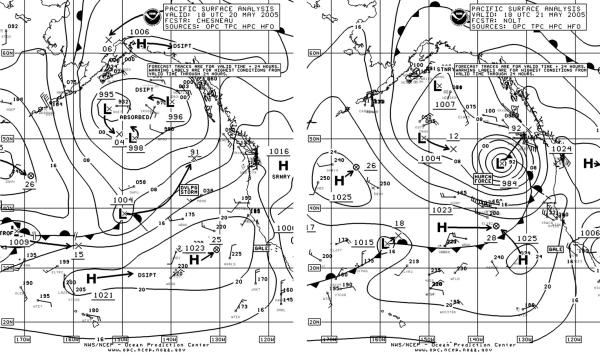
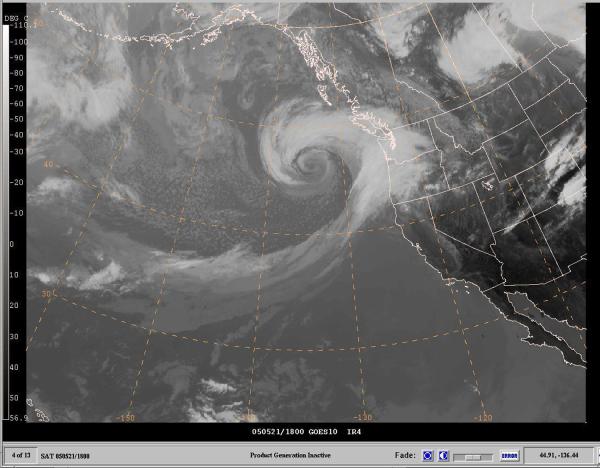
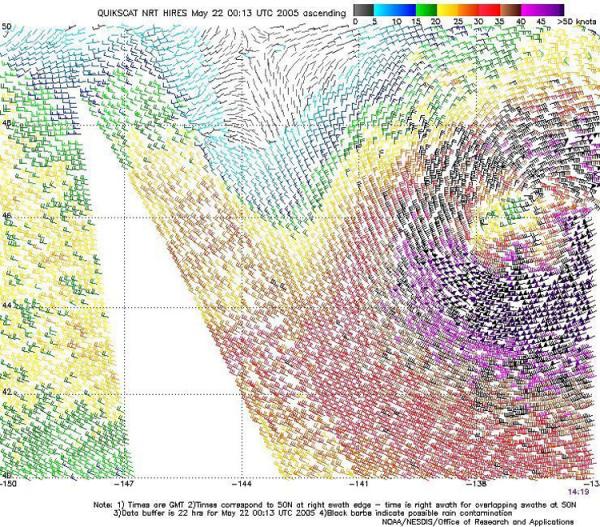
Northeast Pacific Storm of May 20-21: This cyclone was noteworthy for being unseasonably intense for this part of the North Pacific, and for producing hurricane-force winds at a time of year when they are quite rare when non-tropical systems are considered. Figure 5 depicts the rapid development of this storm over a twenty-four hour period, with the lowest central pressure of 982 hPa coming six hours later than the time of the second part of Figure 5. The infrared satellite image in Figure 6 shows the storm near maximum intensity with cloud bands wrapping around the well-defined center, and broad cold-topped frontal features north and east of the center. The QuikSCAT winds of up to 70 kts south of the center as shown in Figure 7 support the hurricane-force label in the second part of Figure 5. The Akashi Bridge (H3QM) (40N 140W) reported southwest winds of 55 kts at 0600 UTC May 21. The hurricane-force winds lasted only 6 to 12 hours, as the cyclone weakened after 0000 UTC May 22 and then dissipated inland early on the 23rd.
|
| ||||
| |||||
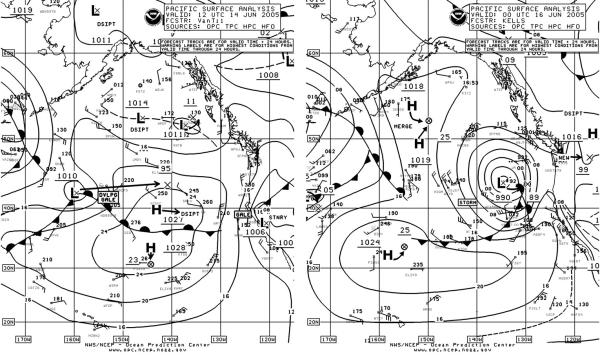
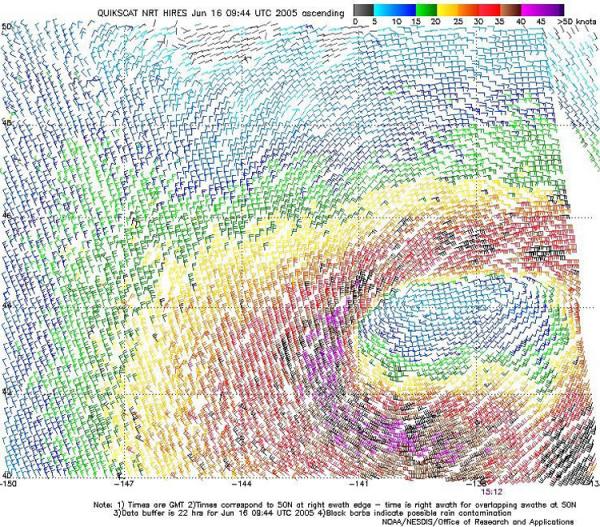
Eastern North Pacific Storm of June 14-16: This storm also affected the waters off the U.S. West Coast but was not as intense. Figure 8 shows the development of this storm from a frontal wave of low pressure over a thirty-six hour period. Table 2 lists some ship and buoy observations taken during the storm. Additionally the buoy 46002 (42.6N 130.4W) reported a lowest pressure of 991.7 hPa at 2000 UTC on the 16th. Available conventional observations show only gales, but the QuikSCAT image in Figure 9 reveals scattered 50 kts wind barbs southwest and west of the center which is marked by an area of lighter winds within the area of stronger winds. The cyclone developed a maximum intensity of 989 hPa at 0000 UTC June 17 as it drifted east. The system then drifted southeast and weakened, before dissipating on the 20th.
|
|
| OBSERVATION | POSITION | DATE/TIME (UTC) | WIND (kts) | SEAS (m/ft) |
| Century Leader No. 3 (JADY) | 46.7N 130W | 16/0600 | E 40 | |
| Hatsu Elite (VSJG7) | 38.3N 130.7W | 17/0600 | NW 45 | |
| Buoy 46006 | 40.8N 137.5W | 15/1800 15/2300 |
SW 35 G43 Peak gust 49 |
5.0/16 7.0/23 |
| Buoy 46002 | 42.6N 130.4W | 15/2300 16/2000 |
SE 33 G43 Maximum 6 |
4.0/13 5/16 |
| Buoy 46015 | 42.7N 124.8W | 17/1000 17/1100 |
S 35 G43 Peak gust 45 |
5.5/18 6.0/20 |
| Buoy 46050 | 44.6N 124.5W | 17/0700 17/0600 |
S 29 G35 Peak gust 39 |
6.0/20 |
Table 2.-Ship and buoy observations taken in the storm of June 14-16.
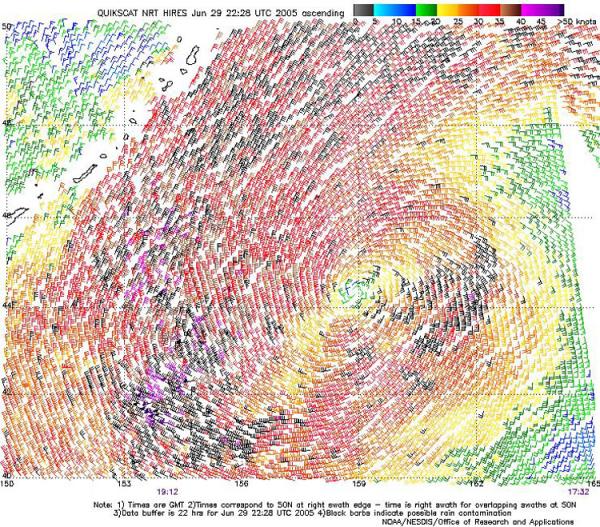
Western North Pacific Storm, June 28-30: Figure 10 depicts the development of this storm over a forty-eight hour period with the cyclone reaching maximum intensity of 970 hPa at 0000 UTC June 28. This cyclone was the most intense (in terms of central pressure) non-tropical low of the four-month period in the North Pacific. There was one ship, the Century Leader No. 3 (JADY), reporting storm-force winds, a 50 kts northwest wind near 43N 156E at 0600 UTC June 30. The same ship reported south winds of 45 kts, 6.0 m seas (19 ft) and a pressure of 972.0 hPa near 44N 160E twelve hours prior. Figure 11 reveals a tight and well-defined circulation center in the QuikSCAT winds and several wind barbs in the 50 to 60 kts range southwest of the center. Some of the Kurile Islands appear in the upper left portion of the image. The storm then weakened to a gale early on June 30 while heading northeast, followed by an eastward turn near the western Aleutians. The low then continued to weaken and dissipated near Southeast Alaska on July 6.
|
|
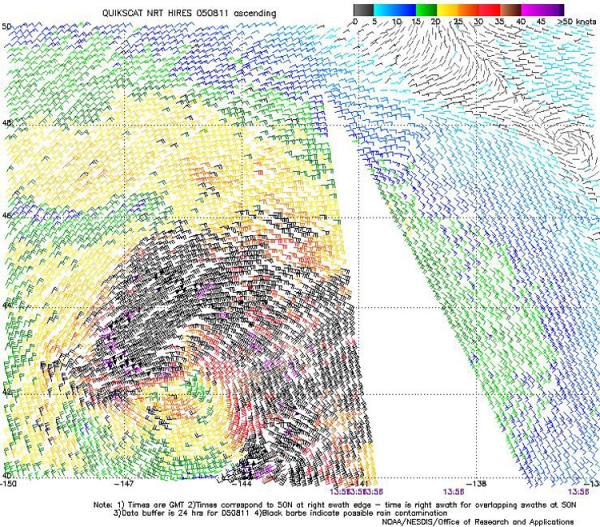
Eastern North Pacific Storm of August 11-12: Figure 12 shows the development of this relatively compact cyclone over a twenty-four hour period, with the second part of Figure 12 depicting the storm with its lowest central pressure of 996 hPa. The OOCL Los Angeles (DBUQ) (43N 147W) encountered north winds of 50 kts at 1800 UTC August 11. This report was supported by a QuikSCAT pass from four hours earlier Figure 13) which showed winds in the 40 to 55 kts range in the area where the ship reported, and even a 60 kts barb northwest of the center.) The storm subsequently turned northwest and weakened to a gale by early on the 12th. The cyclone then moved north and dissipated south of Kodiak Island late on August 14.
|
|
Western North Pacific Storm, August 15-16: This cyclone was another brief spinup of a compact storm similar to the one above in the eastern Pacific. A low moving off Japan on the 15th briefly became a storm with a 993 hPa central pressure near 43N 164E at 1200 UTC August 16, before stalling and then drifting southeast while weakening. A high-resolution scatterometer pass at about 0700 UTC on the 16th showed a compact circulation with several 50 kts wind barbs northeast of the center near 46N 164E. At 1800 UTC August 16 the ships Roger Revelle (KAOU) (47N 161E) and Nova Terra (C6IZ) (47N 167E) reported northeast winds of 35 kts and 4.0 m seas (13 ft) and east winds of 35 kts with 3.5 m seas (12 ft), respectively.
References
1. From Tropical Prediction Center website, http://www.nhc.noaa.gov/aboutsshs.shtml
2. Sienkiewicz, J. and Chesneau, L., Mariner's Guide to the 500-Mb Chart, Mariners Weather Log, Winter 1995.
Page last modified: