Marine Weather Review - North Atlantic Area
May through August 2005
By George P. Bancroft, NOAA National Center for Environmental Prediction
Introduction
The period started out with a pattern more typical of late winter, with the month of May featuring two significant coastal storms off the U.S. East Coast and another slow-moving storm forming early in the month in the southeast high seas waters. The period from June through August featured a more summerlike pattern with most of the significant non-tropical cyclonic activity north of 50N. In a preview of fall two hurricane-force non-tropical cyclones developed in the northeast Atlantic late in August.
In what is turning out to be a very active North Atlantic hurricane season, twelve named cyclones formed during the four-month period, with four of these moving through or directly affecting Ocean Prediction Center's (OPC's) marine area of responsibility. One of these attained hurricane strength in OPC's waters north of 31N and later redeveloped into a powerful extratropical storm near Greenland.
Tropical Activity
Tropical Storm Franklin: Franklin formed south of OPC's marine area late in July and became the first tropical cyclone of the season to directly affect OPC's area. The cyclone entered OPC's waters near 31N 68W with maximum sustained winds of 35 kts with gusts to 45 kts early on July 26. Franklin then moved slowly north before turning more northeast and accelerating on the 28th around the periphery of the subtropical ridge, attaining a maximum strength while passing 300 nmi northwest of Bermuda on the afternoon of the 28th, with maximum sustained winds of 50 kts and gusts to 60 kts. This was followed by a slow weakening trend as the system accelerated northeast. The Alkin Kalakvan (V7GY3 near 41N 58W) reported a southwest wind of 50 kts at 2100 UTC July 29 as Franklin's center passed to the north. The Canadian buoy 44141 (43.0N 58.0W) reported a southeast wind of 31 kts and gusts to 39 kts at that time, along with 2.0 m seas (7 ft) which peaked at 5.5 m (18 ft) two hours later. Another buoy to the east, 44138 (44.3N 53.6W), reported southeast winds of 27 kts with gusts to 43 kts and 2.0 m seas (7 ft) at 0600 UTC July 30, and maximum seas of 4.5 m (15 ft) three hours later. Franklin became an extratropical gale-force low while passing 200 nmi south of the island of Newfoundland late on the 29th, and then became absorbed by a larger low in the Labrador Sea early on July 31.
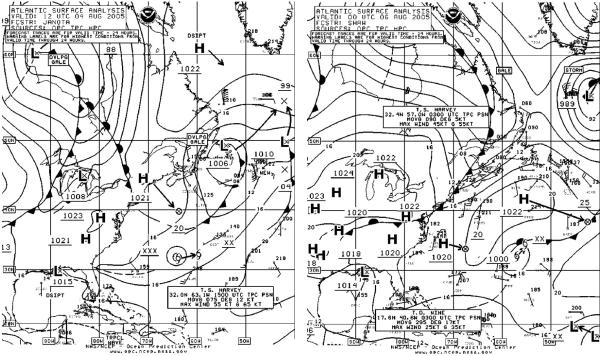
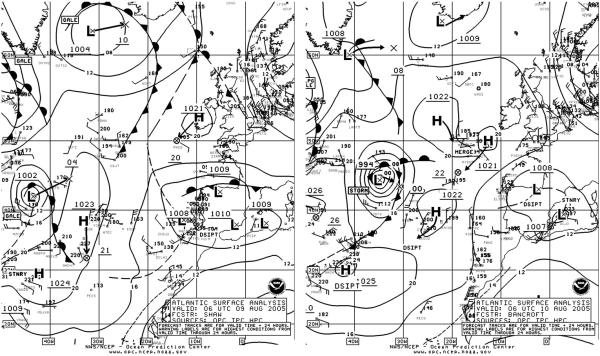
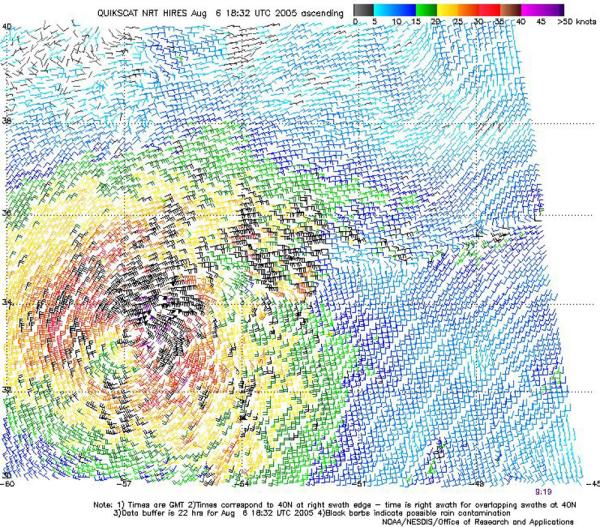
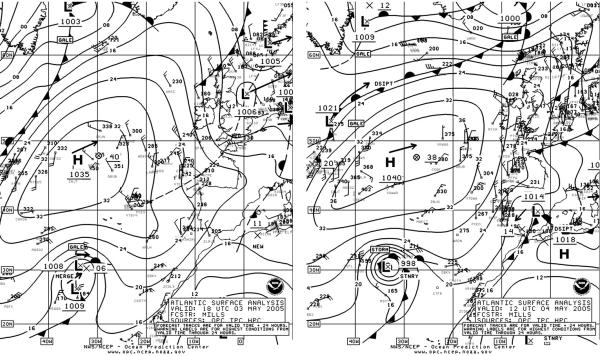
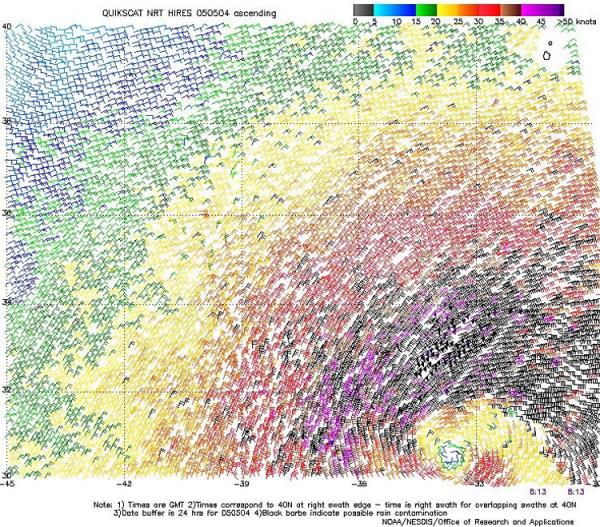
Tropical Storm Harvey: Harvey entered OPC's waters near the same location as Franklin's entry point, as a minimal tropical storm at mid-day on August 3, with maximum sustained winds 35 kts with gusts to 45 kts. Figure 1 shows Harvey passing near Bermuda at 1200 UTC on the 4th when the cyclone developed a maximum intensity of 55 kts sustained with gusts to 65 kts as of the 1500 UTC TPC advisory time. Harvey then weakened only slightly before turning northeast along an approaching front (second part of Figure 1). A scatterometer overpass (Figure 2) about nine hours later reveals a tight circulation with strongest winds close to the center (33.5N 57W), characteristic of tropical cyclones. Winds of 50 kts are shown just north and northeast of the center along with some 60 kts barbs that appear to be rain-contaminated. Harvey became extratropical late on August 8 near 41N 45W. Figure 3 shows the former Harvey as an extratropical gale near 41N 43W at 0600 UTC on the 9th, re-intensifying into a storm twenty-four hours later. The 994 hPa central pressure of the storm was based on a drifting buoy report (62935 at 44.73N 34.80W) of 994.2 hPa at 0520 UTC on the 10th. QuikSCAT data is available, not shown here but having similarity to Figure 2 with its compact circulation, except that the stronger winds (50-55 kts) were just south and southeast of the center. The storm then began a weakening trend on the 10th, before turning southeast and becoming stationary near 41N 32W by the 12th.
|
|
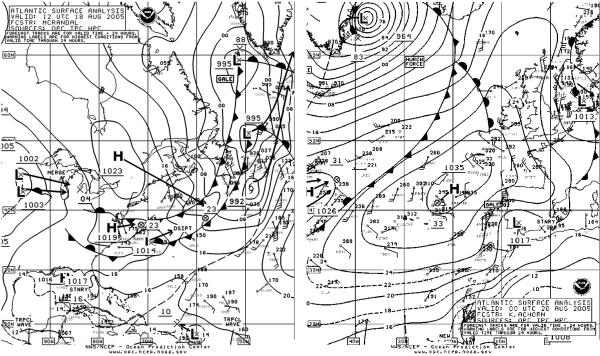
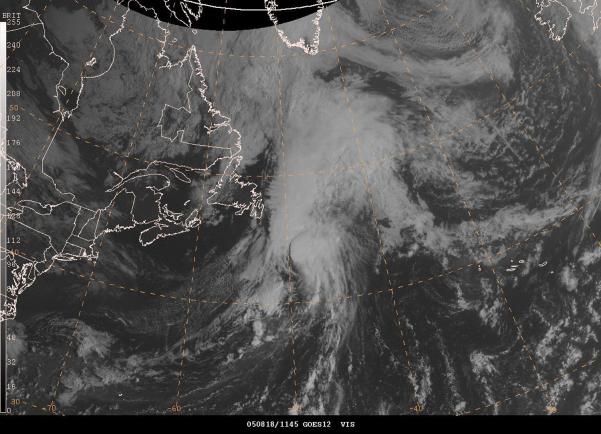
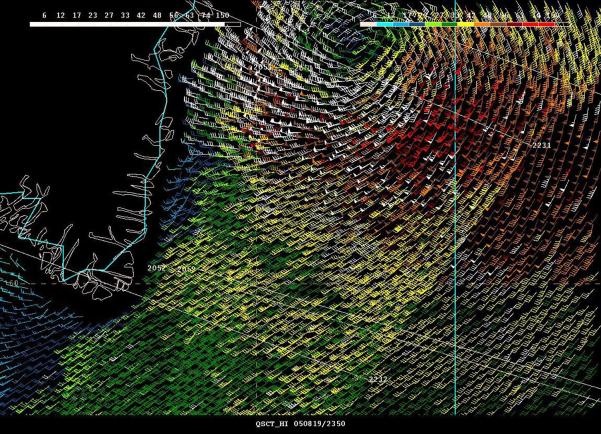
Hurricane Irene: Irene developed from Tropical Depression Nine, which appears well south of OPC's marine area in second part of Figure 1, and crossed 31N near 69W late on August 13 as a strong tropical storm, with maximum sustained winds of 60 kts with gusts to 75 kts. Irene strengthened into a hurricane late on the 14th while passing near 35N 69W, with maximum sustained winds 70 kts with gusts to 85 kts. The cyclone then turned more east between 36N and 37N from the 15th into the 17th of August as a cold front approached from the north, attaining a maximum intensity of 85 kts sustained with gusts to 105 kts near 36.5N 61.6W at 2100 UTC on the 16th. This made it a Category 2 hurricane on the Saffir-Simpson scale1. Irene then began to weaken while accelerating northeast, losing tropical characteristics late on the 18th while passing east of Newfoundland. At 1100 UTC August 18, the Maersk Naples (A8FI4) (38N 51.5W) reported a southwest wind of 40 kts and 3.0 m seas (10 ft). Seven hours later the Maveric (PFWZ) encountered south winds of 35 kts and 8.5 m seas (28 ft) near 47N 42W. Figure 4 shows Irene as a tropical storm in the first part of the figure, becoming a powerful extratropical storm near Greenland thirty-six hours later. Figure 5 is a morning visible satellite image showing Irene as the separate somewhat circular cloud mass east of the cold frontal cloud band that lies off Newfoundland. The western edge of Irene's cloud mass can be seen casting a shadow on the lower frontal clouds to the west in this high-resolution image. The high-resolution QuikSCAT image of Figure 6 shows the winds around extratropical storm Irene, in an area that often has little or no ship data. Wind barbs in the 50 to 75 kts range appear around the south side of the storm. The cyclone was at maximum intensity (964 hPa) at that time. The system then stalled and weakened between Greenland and Iceland, before becoming absorbed by another low near Iceland late on August 22.
|
| ||||
| |||||
Tropical Storm Lee: Tropical Depression Thirteen formed near 29N 50W early on August 31 and briefly became Tropical Storm Lee while approaching OPC's marine area near 30.5N 50W at 2100 UTC August 31, with maximum sustained winds of 35 kts with gusts to 45 kts. Lee then weakened to a tropical depression six hours later while drifting north into OPC's waters, and losing tropical characteristics later on September 1.
Other Significant Events of the Period
Southeastern Storm, May 4-5: This compact storm formed in the subtropics about 500 nmi southwest of the Azores from the merger of two non-tropical lows as shown in Figure 7. Although the lowest central pressure was only 998 hPa, the cyclone formed in an environment of high pressure and winds around the north and west sides reached storm force by the 4th, as revealed in the scatterometer winds of Figure 8. There are even a few 60 kts barbs on the north side of the well-defined storm center near 30.5N 34W. At 1800 UTC May 4 the CP Performer (ZCBD4) (33N 32W) reported east winds of 40 kts. Blocked by the large area of high pressure to the north, the cyclone began a northeastward drift on the 5th and weakened to a gale, before merging with another low moving southeast from the Grand Banks early on the 8th.
|
|
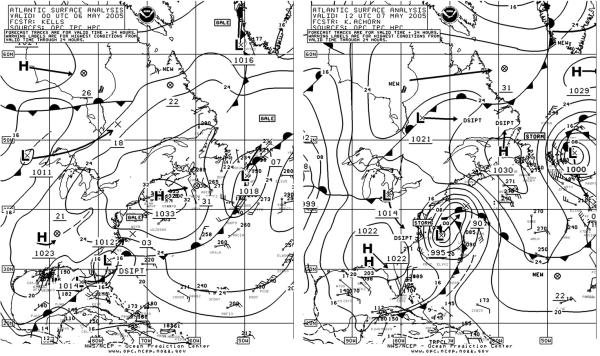 |
Figure 9.-OPC North Atlantic Surface Analysis charts (Part 2) valid 0000 UTC May 6 and 1200 UTC May 7, 2005. |
Coastal Storm, May 5-7: A frontal wave of low pressure moved out of the Gulf of Mexico early on May 5 and intensified to a storm near the North Carolina coast on the morning of the 6th. Figure 9 shows the system becoming fully developed off the mid-Atlantic coast by early on the 7th. Most of the stronger wind reports and highest seas came during the period covered by Figure 9. Table 1 contains a list of ship, buoy and coastal C-MAN observations taken during the storm. The system, blocked by the ridge to the east and northeast, weakened to a gale and began a southeastward motion after reaching Georges Bank early on the 8th. The gale center then passed well south of Newfoundland on the 11th before turning north and becoming absorbed by another low near Newfoundland on May 13.
| OBSERVATION | POSITION | DATE/TIME (UTC) | WIND (kts) | SEAS (m/ft) |
| Montebello (DGZN) | 37N 73W | 06/1800 | NE 55 | |
| State of Maine (WCAH) | 37N 69W | 06/1800 | SE 50 | 6.0/19 |
| Sumida (3FMX7) | 36N 73W | 06/2000 | S 35 | 8.0/26 |
| UBC Saiki (P3GY9) | 36N 74W | 07/1200 | N 40 | 6.5/22 |
| Lykes Explorer (WGLA) | 36N 68W | 08/0000 | W 35 | 8.0/27 |
| Luzon Strait (PBHT) | 34N 74W | 08/0000 | NW 35 | 9.5/31 |
| Buoy 41004 | 32.5N 79.1W | 05/2100 05/2200 |
N 37 G47 maximum |
3.5/11 4.0/13 |
| Buoy 41002 | 32.3N 75.4W | 05/2300 06/0000 07/0200 |
E 31 G39 peak gust 43 maximum |
3.5/11 5.5/18 |
| Buoy 41025 | 35.0N 75.4W |
06/2100 06/1900 |
N 43 G 52 Peak 60 maximum |
5.0/16 6.0/20 |
| Buoy 41001 | 34.5N 73.4W |
07/1300 07/1400 |
NW 37 G47 maximum |
6.5/21 7.0/23 |
| Buoy 44014 | 36.6N 74.8W | 07/0600 | N35 G43 Peak 47 |
5.5/18 |
| Buoy 44004 | 38.5N 70.5W | 07/2100 | NW 35 G47 | 4.5/15 |
| Buoy 44017 | 40.7N 72.0W | 07/0900 07/1200 |
N 29 G37 Maximum |
3.5/11 4.0/13 |
| Buoy 44025 | 40.3N 73.2W | 07/0800 07/0900 |
NE 29 G37 Maximum |
3.0/10 3.5/11 |
| Buoy 44013 | 42.4N 70.7W | 07/1500 07/2100 07/1900 |
NE 33 G43 Peak 47 Maximum |
4.0/13 5.5/18 |
| Duck Pier (DUCN7) | 36.2N 75.7W | 07/0000 | N 41G51 | |
| Cape Lookout (CLKN7) | 34.6N 76.4W | 07/0000 | N 46 G56 peak 62 | |
| Buzzards Bay (BUZM3) | 41.4N 70.9W | 07/1700 | N 45 G52 peak 54 | |
| Isles of Shoals (IOSN3) | 43.0N 70.5W | 07/1600 | NE 41 G46 peak 53 | |
| Mount Desert Is. (MDRM1) | 44.0N 68.0W | 07/1900 07/2000 |
NE 47 G52 Peak 57 |
Table 1.-Ship, buoy and coastal C/MAN station observations taken during coastal storm of May 5-7.
North Atlantic Storm, May 6-7: This storm developed at the same time as the aforementioned coastal storm. Figure 9 shows it developing from a frontal wave of low pressure southeast of Newfoundland, moving northeast and quickly spinning up into a storm before looping southeast, blocked by high pressure to the north. Platform (VEP717) in the Grand Banks reported a northwest wind of 60 kts at 1200 UTC on May 7. The cyclone then headed southeast as a gale before turning east over the eastern Atlantic and dissipating near Portugal on the 11th.
Coastal Storm, May 25-26: A series of low-pressure centers moved off the mid-Atlantic coast late in May and looped near or over the southern New England offshore waters before heading east, with the strongest of these developing storm-force winds mainly in the southern New England waters on the 25th. The area of gale to storm-force winds was confined mainly to the north semicircle of the low. QuikSCAT data from about 2300 UTC on the 25th revealed uncontaminated winds to 50 kts in the New England waters south of 43N. The Gypsum Baron (ZCAN3) and the Ship (PTAG) reported north winds of 35 kts near 41N 70W and south winds of 35 kts near 40N 69W, respectively. After looping south of New England on the 26th, the cyclone headed northeast as a broad area of low pressure passing just south of Newfoundland on the 28th, before reaching the central Atlantic as a gale by the end of the month, and dissipating near Great Britain on June 4.
North Atlantic Storm, June 1-2: This storm formed from a frontal wave of low pressure about 180 nmi northwest of Bermuda at 0000 UTC June 1 and was much more progressive than the blocked systems of late May. A scatterometer pass revealed 50 kts winds around the center around 0000 UTC June 2 when the low passed near 38N 52W with a 1000 hPa central pressure. The Zim Haifa (4XIM) reported east winds of 40 kts near 42N 49W at 1200 UTC June 2. The system then followed its predecessor northeastward as a gale, before elongating and then dissipating near Great Britain on the 5th.
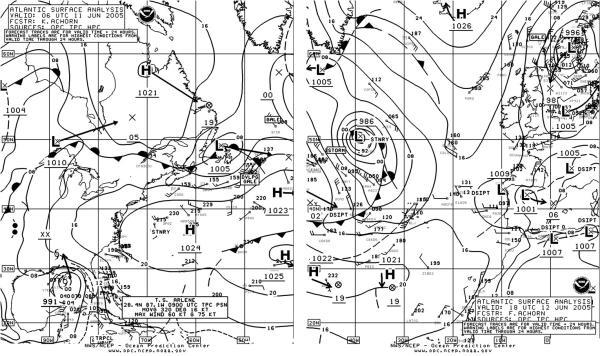
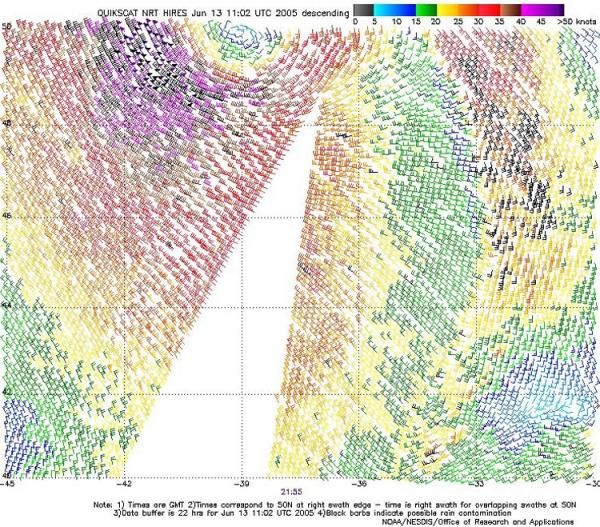
North Atlantic Storm, June 11-13: Figure 10 shows a frontal wave of low pressure moving east from the island of Newfoundland and developing into a storm over a 36-hour period. High-latitude blocking caused it to stall near 50N 40W and then turn southwest and weaken to a gale on the 13th. A QuikSCAT pass (Figure 11) reveals 50 kts northwest winds southwest of the center which is on the northern edge of the image. The Queen Mary 2 (GBQM) reported northwest winds of 45 kts near 49N 41W at 1200 UTC on the 12th. The Nuka Arctica (OXYH2) encountered northeast winds of 50 kts near 59N 44W between the front and the tip of Greenland at 0600 UTC June 14. The cyclone was absorbed by another gale passing to the south and then east early on the 16th.
|
|
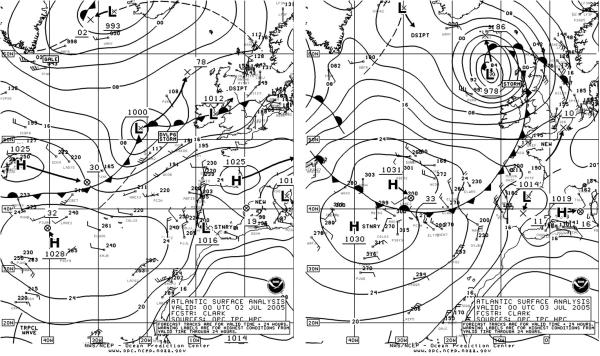
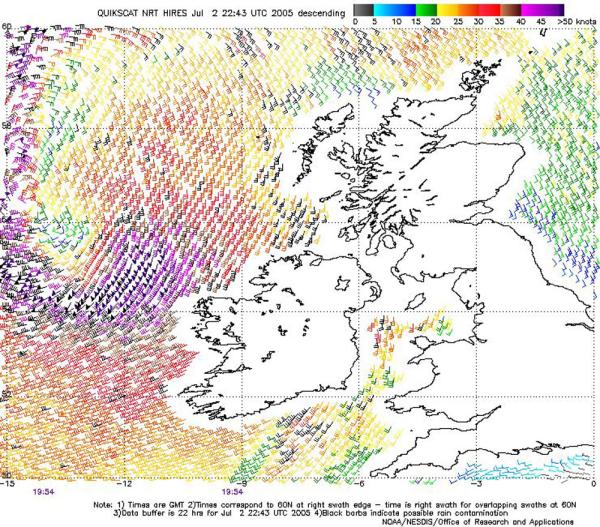
Northeast Atlantic Storm of July 2-4: This was unusual in its intensity at a time of year when such activity is usually at a minimum. Figure 12 shows the rapid development of this storm over the twenty-four hour period ending at 0000 UTC July 3 when the central pressure bottomed out at 978 hPa. The QuikSCAT image in Figure 13 reveals a swath of wind in the 50 to 60 kts range west of Ireland and even a couple of 65 kts barbs which appear to be rain-contaminated. There are even 50 kts barbs in the easterly flow north of the center. The Pelagia (PGRQ) reported northwest winds of 52 kts and 5.0 m seas (17 ft) near 55N 16W at 1800 UTC July 2. Buoy 62566 (58N 17W) reported northwest winds of 45 kts at 0100 UTC on the 3rd, while 62105 (55.5N 12.5W) had seas of 7.5 m (25 ft). The cyclone subsequently drifted northwest and weakened, and dissipated over Iceland on July 5.
|
|
|
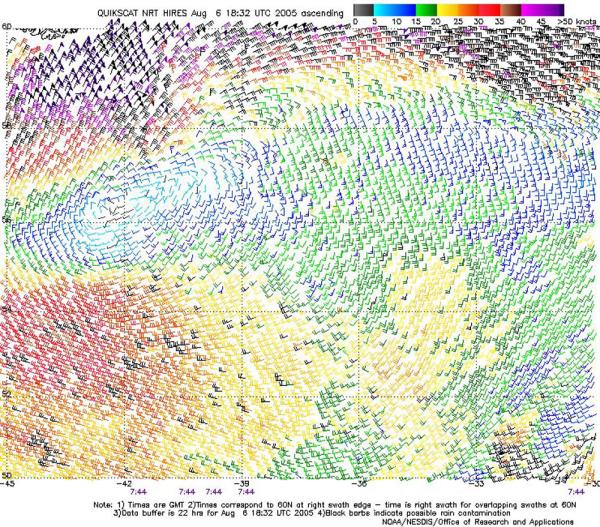
Figure 14.-High-resolution QuikSCAT scatterometer image of satellite-sensed winds valid at 0744 UTC August 6, 2005. The valid time of the pass is almost eight hours later than the valid time of the second analysis in Figure 1. Image is courtesy of NOAA/NESDIS/Office of Research and Applications. |
North Atlantic Storm of August 5-7: Referring back to Figure 1, a Newfoundland low moved northeast and developed into a storm over a 36-hour period ending at 0000 UTC August 6. The QuikSCAT image in Figure 14 is valid about eight hours later and reveals winds of up to 80 kts southeast of Cape Farewell, Greenland. The northeast winds appear to be enhanced by the proximity to the Greenland coast, and the higher winds may be an overestimate due to rain contamination. It is still possible there could be maximum winds of hurricane force near Cape Farewell. The winds of at least 50 kts extend well to the east in easterly flow. The Atlantic Peace (DEOT) encountered northeast winds of 50 kts near 56N 47W at 0600 UTC August 6. The system then continued on a northeastward track and weakened to a gale near 61N 35W at 0000 UTC on the 8th, before drifting east and dissipating near Iceland on the 10th.
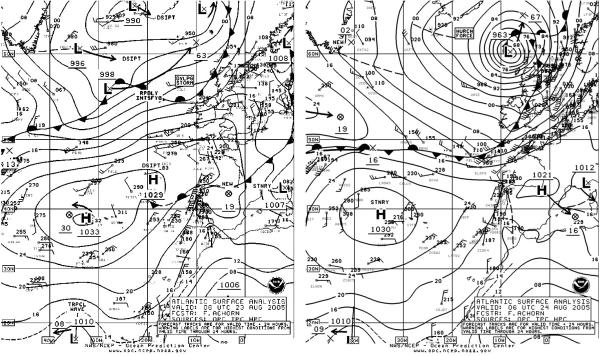
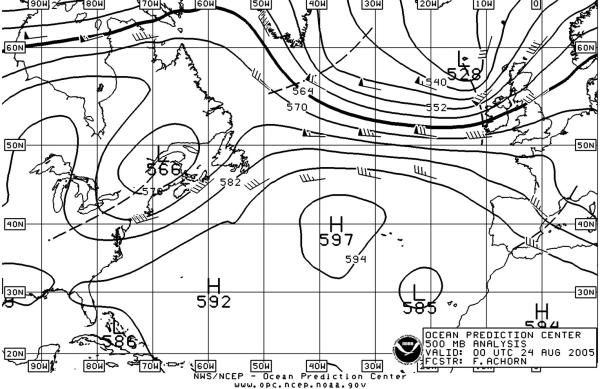
Northeast Atlantic Storm of August 23-24: Figure 15 depicts the rapid development of this storm from a frontal wave of low pressure shown in the first part of the figure. A true meteorological "bomb", this cyclone deepened by 36 hPa in the twenty-four hour period ending at 0000 UTC on the 24th. The central pressure bottomed out at 963 hPa at 0600 UTC on the 24th, making it the deepest low (in terms of central pressure) of the four-month period in the North Atlantic and North Pacific. This intensity is quite unusual for a summer cyclone that did not have tropical origins, and is 1 hPa deeper than the intensity Tropical Storm Irene developed after becoming extratropical. The 500 hPa analysis in Figure 16 shows good support for this development in the form of a 75 kts jet and a short wave trough developing negative tilt. See Reference 2 for more information on the use of the 500 hPa chart. The Charles Darwin (GDLS) encountered west winds of 45 kts near 55N 13W at 0000 UTC on the 24th. The buoy 62114 (58N 0W) reported south winds of 55 kts six hours later. The cyclone subsequently turned north and weakened, passing north of the area as a gale early on the 25th.
|
|
Northeast Atlantic Storm of August 28-29: This storm quickly followed its predecessor and originated from a frontal wave south of Newfoundland on the 25th. This cyclone tracked farther north and was not as deep as the previous storm, but OPC briefly classified it as hurricane force at 0600 UTC on the 29th, when the central pressure was 972 hPa. The Naja Arctica (OXVH2) encountered southwest winds of 55 kts near 59N 15W at 1800 UTC August 28. At 1200 UTC on the 29th the ship British Cormorant (MGRX2) reported west winds of 55 kts near 62N 1W. OPC analyzed maximum seas of 9 m (30 ft) in this area on its sea state analysis on August 29. This system subsequently moved quickly northeast of OPC's radiofacsimile map area by early on the 30th.
References
1. From Tropical Prediction Center website, http://www.nhc.noaa.gov/aboutsshs.shtml
2. Sienkiewicz, J. and Chesneau, L., Mariner's Guide to the 500-Mb Chart, Mariners Weather Log, Winter 1995.
Page last modified: