NOAA Offers Hard, Cold Facts About Great Lakes Ice in Electronic Atlas
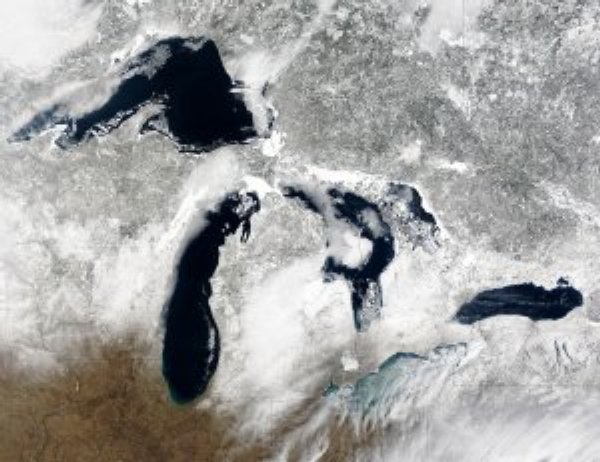
Reprinted with permission, NOAA Magazine, http://www.magazine.noaa.gov/stories/mag172.htmJune 15, 2005 - For the past 30 years, NOAA has been keeping an eye on the ice in the Great Lakes. Researchers at the NOAA Great Lakes Environmental Research Laboratory in Ann Arbor, Michigan have tracked ice cover in this region, searching for signs of climate change, and gathering data to help them better understand ice and its impacts on the Great Lakes and other regions of the world.
|
|
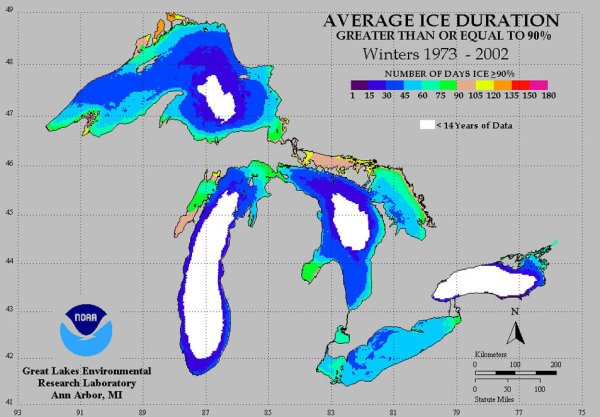
To share the vast amount of information about the ice, NOAA researchers published an electronic atlas of ice cover for the Great Lakes. The atlas contains data on more than 1,200 digitized Great Lakes ice charts for winters from 1973 to 2002 and offers three types of analysis of these ice charts. Data came from combined measurements from satellites, aircraft, shipboard observers and other sources. The atlas offers:
- Ice chart dates of the first reported ice, dates of the last reported ice, and ice duration for each winter, as well as statistics over the 30 winters - the maximum, minimum and average;
- A 30-winter set of annual daily ice cover time series. The daily time series was used to create computer animations of spatial patterns of ice cover for each winter and line plots of lake-averaged ice cover for each lake over the 30 winters;
- Weekly ice charts of maximum, 3rd quartile, median, 1st quartile and minimum ice cover concentrations for the 30-winter base period. The weekly statistics are based on the original ice chart data set and not on the daily time series.
| |||
|
Detailed documentation and description of analysis methods, and a discussion of the resulting products, supplement this atlas as a series of reports.
The atlas contains a lot of information - 1.4 gigabytes of data, much of which is in compressed files (about 4 gigabytes when uncompressed). The online version of this atlas can be used to browse and download a limited amount of data. However, because of its large size, it is not practical to download the entire atlas from the Internet. Therefore, it is also available on CD-ROM and DVD formats. To request a copy of the atlas on CD-ROM or DVD send an e-mail to Cathy.Darnell@noaa.gov or to iceatlas.glerl@noaa.gov. (Please provide your name and complete mailing address.)
The atlas and dataset are archived at the National Snow and Ice Data Center, but the NOAA Great Lakes Environmental Research Laboratory will maintain the Internet version of the atlas, for several years to come and will still continue to supply CD-ROM and DVD versions of the atlas after that.
Who will use the Great Lakes Ice Atlas?
"The atlas is a resource for those seeking information on Great Lakes ice cover climatology. It provides a benchmark of ice cover and ice cover variation on the Great Lakes during the last quarter of the 20th century and the early years of the 21st century," explained Raymond Assel, a physical scientist at the NOAA GLERL, who (along with others) spent a decade working on this project.
Assel added that the Navy/NOAA National Ice Center and the Canadian Ice Service use information from this atlas in making operational Great Lakes ice charts. Portions of these data have also already been used by other federal and state government agencies, academia and the private sector for research, educational, operational and engineering applications.
What are the Impacts of Ice Cover on the Great Lakes?
When ice forms on the Great Lakes each winter, both humans and the weather/environment around the region are impacted (i.e., more ice cover means less evaporation and therefore often less lake effort snow over the Great Lakes region). Some of the human uses that are affected include the fishing industry, coastal zones and navigation:
 |
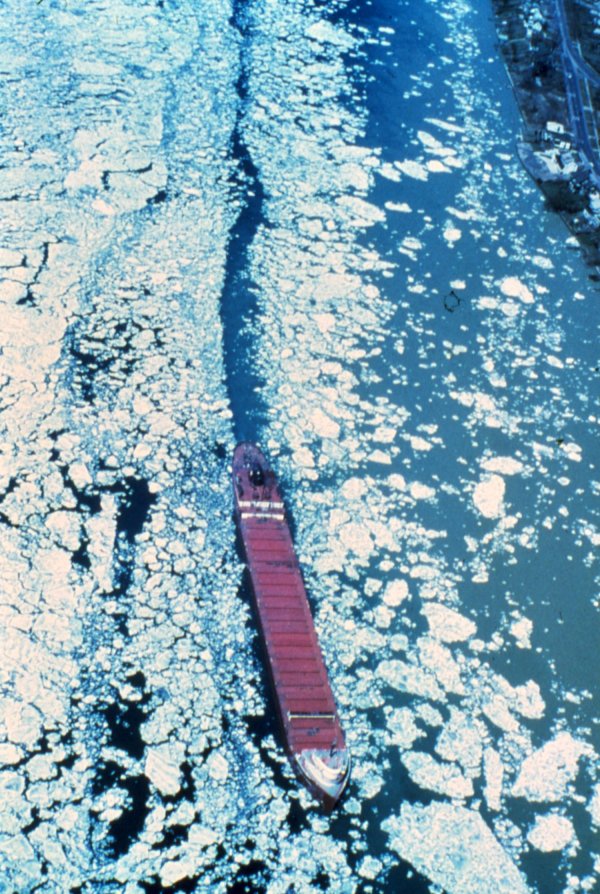 |
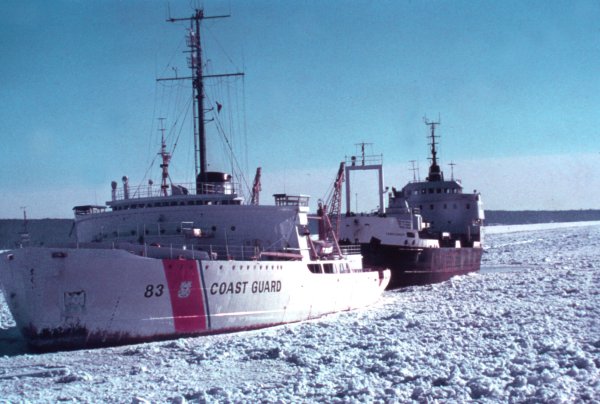
Freighter moving
through ice channel. |
- Effects on Fishing: Generally ice cover is a good thing for both commercial
and recreational fishing. Ice plays a major role in ecology and climate around the
Lakes. It is particularly important to the reproduction of fall-spawning fish, such
as whitefish, whose eggs lie in the cold water during winter. "When you do have
extensive ice cover, you tend to have more eggs survive into the spring," Assel said.
"Open water leaves the eggs vulnerable to wind, waves, predators or even being tossed
onshore."
- Effects on Rivers: Ice jams can form when ice flows amass and obstruct normal
water flow from one lake to another through the rivers that connect the Great Lakes
(St. Marys River, St. Clair River, Detroit River and Niagara River). This lack of water
downstream can adversely affect hydropower electricity production, often forcing
electrical power distributors to find alternate sources of power. Since ice jams act like
dams, flooding can also occur upstream of an ice jam. To make matters worse, when an ice
jam dissipates, large quantities of water and ice move downstream, often damaging shoreline
property. An ice control structure called an "ice boom" is installed at the head of the
Niagara River at the east end of Lake Erie in early winter to help prevent ice jams.
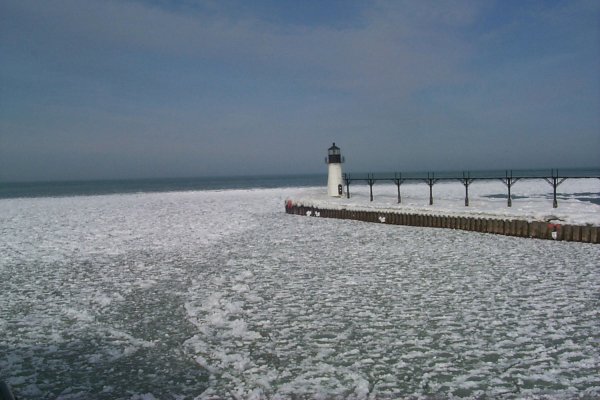
- Effects on Coastal Zone: Ice formation along Great Lakes coastlines can be
highly beneficial. In a typical winter, ice forms a solid anchor along most shorelines,
which acts as buffers against strong winds and waves. A solid ice cover on bays and inlets
also protects wetland communities from disruptive storm events and associated erosion. In
many cases, ice formation on bays, inlets, major rivers and around islands is essential
for recreational activities, such as ice fishing and snowmobiling.
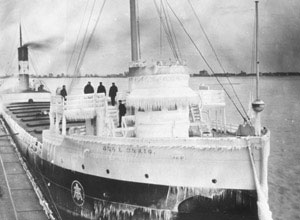
- Effects on Navigation: A hard winter can cause extremely heavy ice buildup
along navigation channels in the Great Lakes region. Ice buildup can be a navigational
hazard and can disrupt commercial shipping in the early winter and/or delay the opening
of the next shipping season. Since ice cover usually reduces evaporation over the lake, a
cold winter can moderate water loss from the lake during low water periods. Higher water
levels allow commercial shipping companies to carry more of their commodity and make fewer
trips. Many Great Lakes and connecting channels have ice control measures, such as ice booms
and ice breaking, to limit damage and keep these waterways ice-free.
Climate Trends in Great Lakes Ice Cover
The Great Lakes ice atlas data indicates that a trend for below average ice conditions persisted over the entire Great Lakes from 1998 to 2002 (Figure 1). However, more data needs to be collected and analyzed before researchers will know if a lower ice cover regime has started.
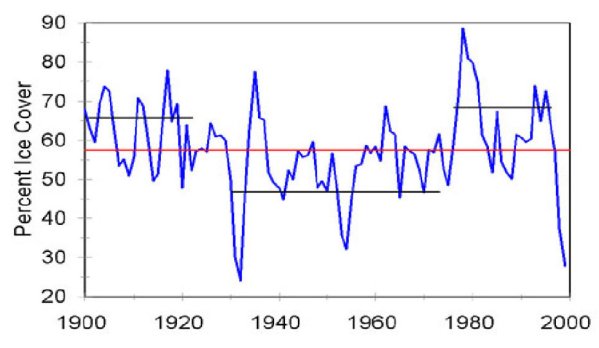 |
Figure 1. - Graph showing three-year moving averages of annual maximum ice cover. Red line is long-term mean. Black lines are periods of above and below that long-term mean. (Photo courtesy "NOAA.") |
Research has shown that a strong El Niño event is a precursor to above average winter temperatures and below average ice cover on the Great Lakes. This is most evident in the winter of 1997-1998, which followed an extremely strong El Niño period. Ice cover following this El Niño event was near record lows as shown on the graph.
Relevant Web Sites
NOAA Research: http://www.research.noaa.gov/
Great Lakes Products/NOAA National Geophysical Data Center: http://oas.ngdc.noaa.gov/drs/prod_d/ngdc_products.disc_prods?disc=G16
Great Lakes Online: http://glakesonline.nos.noaa.gov/
NOAA GREAT LAKES LAB ON MISSION TO LAKE ERIE DEAD ZONE: http://www.noaanews.noaa.gov/stories2005/s2427.htm
Thunder Bay National Marine Sanctuary and Underwater Preserve (Alpena, Michigan): http://thunderbay.noaa.gov/welcome.html
NOAA Research in Michigan: http://www.oarhq.noaa.gov/nriys/nriys.asp?id=MI
Science with NOAA Research: Great Lakes: http://www.oar.noaa.gov/k12/html/greatlakes2.html
'NO BALLAST ON BOARD' DOESN'T MEAN 'NO ORGANISMS ON BOARD' SAYS NOAA / UNIVERSITY GREAT LAKES REPORT: http://www.noaanews.noaa.gov/stories2005/s2435.htm
Media Contact: Jana Goldman, NOAA Research, (301) 713-2483
Page last modified: