Mean Circulation Highlights and Climate Anomalies
May through August 2005
A. James Wagner, Senior Forecaster, Climate Operations Branch, Climate Prediction
Center /NCEP/NWS/NOAA.
May-June 2005
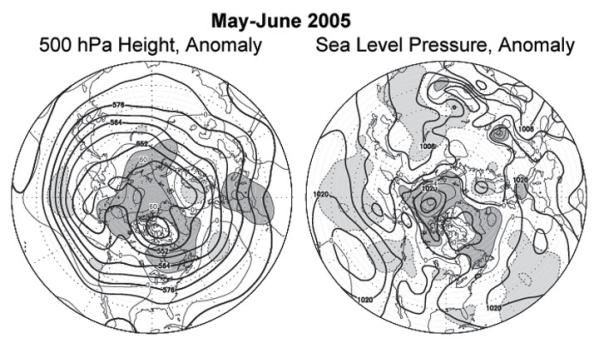
The circulation pattern over the Northern Hemisphere during May and June was characterized by generally above normal middle tropospheric heights and sea level pressure over much of the Arctic Basin and parts of northeastern Canada and the north Atlantic, as well as southwestern Europe and the western Mediterranean. The 500 hPa heights and sea level pressure were generally near or slightly below normal across middle latitudes of most of the Northern Hemisphere, but with no unusually strong anomalies. To some degree, these weak anomalies over the lower 48 States reflect two quite different circulation regimes that prevailed in May and June.
|
Although both months were unusually warm over Alaska under the influence of a persistent ridge, strong blocking over the Davis Strait and Labrador kept the westerlies well south of normal over the eastern U.S., resulting in widespread well below normal temperatures for the month. During June, the circulation changed dramatically, and a deeper than normal trough developed near the West Coast while an anomalously strong downstream ridge formed over the Northeast. Temperatures rapidly rose to well above normal over the region, with only a small area of the Southeast remaining cool. The strong trough over the West continued the rainy season well beyond its usual end in June, which provided some limited relief to the multi-year drought that had built up in the area due to several recent years with deficient cool-season precipitation. Coupled with below normal temperatures, this pattern had the additional benefit of providing at least a delay to the start of the summer wildfire season.
Elsewhere, a persistently strong ridge prevailed over the western Mediterranean and southwestern Europe during both months, and was related to early summer heat in that area, along with a continuation of a generally dry period that has been in place for most of the past year. Unusually cool weather prevailed over parts of northern and central Europe into early June, where as in the northeastern U.S., cool weather in May was replaced by warmer than normal weather later in June as ridging built over most of the region.
July-August 2005
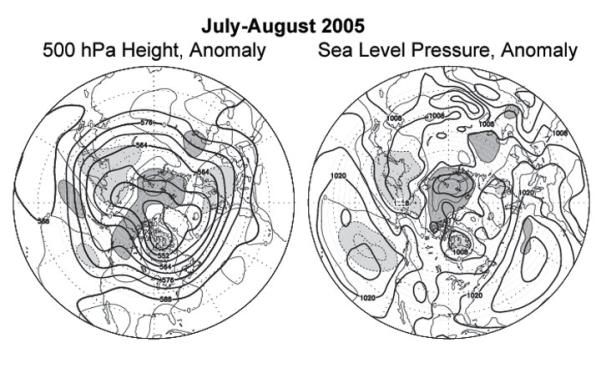
During the high summer months of July and August, middle tropospheric heights and surface pressures remained higher than normal over the Arctic Basin, particularly on the Asian side. The abnormally strong ridge also remained in place near or over Alaska most of the time, leading to the second unusually warm and rather dry summer in as many years in many locations and contributing to another bad season for wildfires in the interior of the state. Relatively strong westerlies broke across the Gulf of Alaska to the south of this ridge, leading to a slightly enhanced 500 hPa trough off the Pacific Northwest coast, and a weaker than normal surface high over the eastern Pacific. Anomalies in the general circulation over the U.S. and Atlantic sectors were generally weak.
|
Both July and August were predominantly warmer than normal months over the lower 48 States, with the most excessive heat being located in the West in July and over most areas east of the Mississippi River during August. The heat was compounded by a very late arrival of the summer monsoon in Arizona and New Mexico, with many locations having record heat during the first two weeks of the month before the monsoon's arrival. During late July and most of August, generous amounts of rain fell in southern parts of Arizona and New Mexico, but the precipitation failed to penetrate very far to the north, except over parts of the southern Great Plains, where moisture was steered northward to the east of occasional troughs making their way through the Rockies and High Plains. Drought intensified over parts of the Midwest, particularly Illinois, and a new area of moderate drought developed in the middle Atlantic area which was missed by both the frontal activity at higher latitudes and tropical moisture to the south.
The Tropics
The status of the El Nino -- Southern Oscillation (ENSO) phenomenon remained in neutral territory throughout the late spring and summer months. Moderately strong Madden-Julian waves progressed from the Indian Ocean region across the Pacific, but they were not strong enough to trigger Kelvin Wave activity in the subsurface Pacific. Throughout most of the summer, convective activity in the atmosphere was concentrated along a pronounced ITCZ near 10 N over the Pacific.
Unusually warm sea-surface temperature over the entire tropical and subtropical Atlantic Basin was probably the main factor contributing to an extremely active tropical storm season in the area. Additional favorable items were generally low vertical wind shear and an active West African summer monsoon, which meant that the disturbances that become Atlantic tropical storms were already well-supplied with moisture when they moved out over the water.
The Atlantic hurricane season got off to an early start with two named tropical storms in June, only the twelfth time this many were observed in June since reliable records began in 1851. The month of July saw an unprecedented number of named storms (five), two of which became major hurricanes. This is the first time since 1916 that two major hurricanes formed in the Atlantic sector during July, and one of these (Dennis) attained Category 4 intensity over the Gulf of Mexico before weakening to a Category 3 storm when it made landfall in the western Florida Panhandle. By the end of August, five more named storms developed, and two of them became hurricanes, bringing the seasonal total to twelve named storms, three of them major (Category Three or higher). Of all the storms, Katrina was by far the worst, having the fourth lowest sea level pressure on record in the Atlantic Basin when it was a violent Category 5 storm over the Gulf of Mexico. Even though it weakened before making landfall in Louisiana and Mississippi, preliminary estimates are that it did more damage than any other natural disaster in the history of the United States. Although the casualty figures are not complete, the number is greater than for any hurricane in the U.S. for many decades. The total number of named storms in the Atlantic Basin through the end of August was almost as great as the number of typhoons in the western Pacific (fourteen), which is usually much larger.
There were a total of nine named storms over the eastern Pacific. The most unusual event was the first storm of the season, Adrian, which moved northeastward into El Salvador and Honduras on May 20 as a tropical depression after weakening from hurricane intensity before landfall.
Figure legends and description of units:
The charts show the seasonal mean 500 hPa height contours at 60 m intervals in heavy solid lines, with alternate contours labeled in decameters (dm). Positive height anomalies are contoured in light solid lines at 30 m intervals, and light dashed lines show negative height anomalies. Areas of mean height anomalies greater than 30 m above normal have heavy shading, and areas of mean height anomalies of more than 30 m below normal have light shading.
The charts show the seasonal mean sea level pressure (SLP) at 4 hPa intervals in heavy solid lines, labeled in hPa at selected intervals. Anomalies of SLP are contoured in light lines at 2 hPa intervals, with dark shading and solid lines in areas more than 2 hPa above normal, and light shading with dashed lines in areas greater than 2 hPa below normal.
Page last modified: