Marine Weather Review-North Atlantic Area
May through August 2004
By George P. Bancroft, National Center for Environmental Prediction
Introduction
Most of the significant developments of low-pressure systems during this period were over the far northern reaches of the Atlantic after the lows initially passed off the Canadian coast, with a few originating over the central waters. Several of these developed storm-force winds and are described below.
Tropical cyclone activity during this four-month period was concentrated during August, although the Atlantic hurricane season officially begins June 1. Of the eight named tropical cyclones that formed during this period, six affected OPC's marine area of responsibility north of 31N, and are described below. Alex was the only major hurricane to affect OPC's marine area through the end of August, and was also the only tropical system to re-intensify into a storm-force low after becoming extratropical.
Tropical Activity,
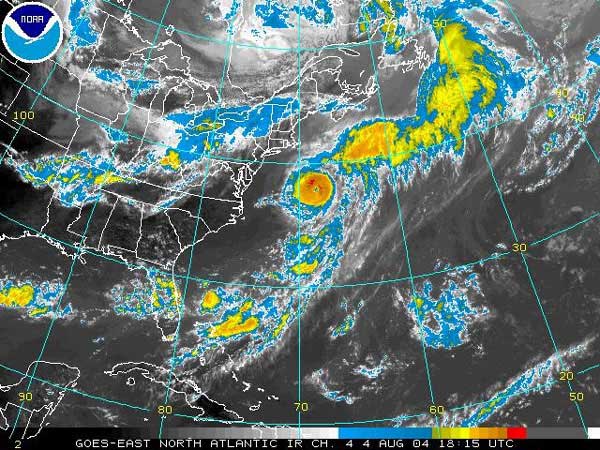 |
Figure 1. GOES infrared satellite image valid at 1815 UTC August 4, 2004. Satellite senses temperature on a scale from black (warm) to white (cold) in this type of imagery, but image has coldest temperatures enhanced to make the highest cloud tops stand out. |
Hurricane Alex: Tropical Depression One formed late on July 31 off the north Florida coast and drifted north-northeast, intensifying into Tropical Storm Alex about 120 nmi off the Georgia coast twenty-four hours later, with maximum sustained winds of 35 Kt and gusts to 45 Kt. The cyclone became a hurricane while passing about 90 nmi southeast of Cape Fear early on August 3, and developed maximum sustained winds of 85 Kt with gusts to 105 Kt when passing just east of Cape Hatteras on the afternoon of August 3. After weakening through the morning of August 4 but still remaining a hurricane while moving offshore, Alex strengthened into a major hurricane on the evening of August 4 about 300 nmi south of Nova Scotia. Maximum sustained winds of 105 Kt with gusts to 130 Kt were maintained from the night of August 4 through the following morning. This intensity is rated Category 3 on the Saffir-Simpson scale of hurricane intensity (Reference 1.) Figure 1 depicts the hurricane in an enhanced infrared satellite image just prior to attaining peak intensity. A well-defined eye is apparent near 38N 68W, surrounded by a circular central dense overcast containing the coldest cloud tops which are enhanced in this type of image. Selected ship, buoy and C-MAN platform observations taken near the storm are shown on the right in Table 1.
| OBSERVATION | POSITION | DATE/TIME(UTC) | WIND | SEAS(m/ft) |
| Tanabata
(WCZ5535) |
32N 67W | 03/1800 | S 34 | |
| Charles Island
(C6JT) |
33N 72W | 04/0000 | S 50 | |
| Enterprise
(WAUY) |
36N 67W | 04/1500 | W 35 | |
| Buoy 41013 | 33.5N 77.6W | 03/0700 | NE 33G45 | 4.0/13 |
| Buoy 41001 | 34.7N 72.7W | 03/22/00
04/0100 04/0200 |
S 29 Peak gust 39 |
5.0/16
maximum 6.0/20 |
| Buoy 41025 | 35.2N 75.3W | 03/1600* | SE 47 G62 | 6.5/21 |
| Cape Lookout
(CLKN7) |
34.6N 76.4W | 03/1400 | N 51
Peak gust 62 |
|
| Duck Pier
(DUCN7) |
36.2N 75.6W | 03/2000 | NE 39 G43
Peak gust 45 |
Table 1. Some observations taken off the U.S. East Coast during passage of Hurricane Alex.
*Buoy 41025 became disabled and reported its last observation at this time.
As Alex passed south of the Canadian Maritimes the Canadian buoy 44140 (43.8N 51.8W) reported a minimum pressure of 979.3 hPa at 2200 UTC August 5, and maximum seas of 6.5 m (21 ft) one hour later. A ship, the Enterprise (WAUY), encountered southwest winds of 40 Kt and 9.5 m seas (31 ft) near 36N 68W at 1800 UTC August 4 and again three hours later.
Alex then entered the next stage in its evolution, transformation into an extratropical storm, as shown in Figure 2. Alex passed north of the Gulf Stream and over cooler water and began to weaken late on August 5, and at the same time approached a frontal zone to the north. The first part of Figure 2 shows Alex still a hurricane at the synoptic time, but the boxed text indicates Alex was downgraded to a tropical storm at the advisory time of 1500 UTC August 6. The cyclone then merged with the nearby frontal system and re-intensified into the extratropical storm shown in the second part of Figure 2, the third deepest of the period in the North Atlantic with a lowest central pressure of 972 hPa. At 1800 UTC August 7 the Faust (WRYX) reported a northwest wind of 50 Kt near 50N 21W.
|
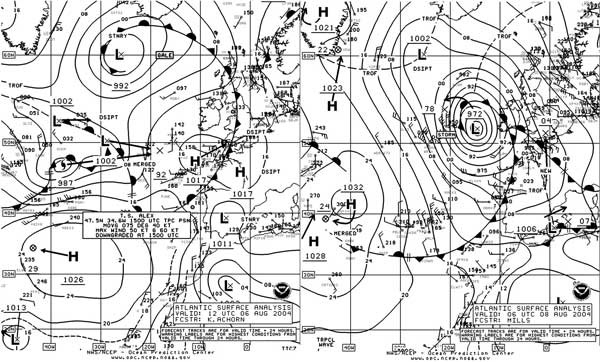
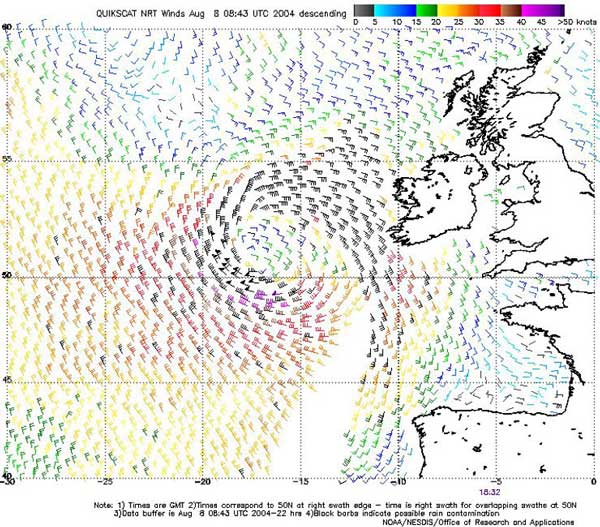
A QuikSCAT image taken at about that time (Figure 3) reveals winds to 60 Kt just east of the ship's location. The system subsequently turned northwest and weakened to a gale-force low late on August 8, before looping to the south and then east toward Great Britain. The remains of Alex passed over Great Britain on the 12th before moving inland over the European mainland early on the 14th.
Tropical Depression Bonnie: Bonnie, after moving through the Gulf of Mexico as a tropical storm, weakened while passing inland over northwest Florida on August 12. Bonnie then moved along the U.S. East Coast just inland as a tropical depression from late on August 12 through the 13th, with minor effects offshore, before dissipating over southern New England. The ship (MXGU3) reported a south wind of 35 Kt near 34N 76W at 1800 UTC August 13.
Hurricane Charley: Charley, after maintaining hurricane strength while passing through the Florida peninsula, entered the far southwest part of OPC's offshore waters near 31N 80.5W early on August 14 with maximum sustained winds of 75 Kt and gusts to 90 Kt. Charley then moved to the coast near Cape Romain by 1800 UTC August 14 and then weakened to a tropical storm inland over eastern North Carolina at 2100 UTC on the 14th, with maximum sustained winds of 50 Kt and gusts to 60 Kt. After passing near the Virginia capes as a minimal tropical storm on the evening of the 14th, Charley became extratropical and merged with a frontal zone over southeast Massachusetts on the morning of the 15th, before dissipating over Nova Scotia on the 16th. The more notable observations taken during the passage of Charley are listed in Table 2.
| OBSERVATION | POSITION | DATE/TIME(UTC) | WIND | SEAS(m/ft) |
| MOL Virtue
(A8BZ6) |
37N 75W | 15/0300 | SW 42 | |
| Buoy 41008 | 31.4N 80.9W | 14/0900
14/1100 |
NE 33 G43 | 2.0/7
maximum 3.0/10 |
| Buoy 41004 | 32.5N 79.1W | 14/1300
14/1400 |
SE 43 G64 |
maximum 7.5/25 |
| Buoy 41013 | 33.5N 77.6W | 14/1700
14/1900 |
S 37 G49 |
maximum 5.0/16 |
| Buoy 41014 | 36.6N 74.8W | 15/0200 | SW 31 G37 | 2.5/8 |
| Folly Island (FBIS1) | 32.7N 79.8W | 14/1200 | NE 42 G50
Peak gust 56 |
|
| Duck Pier (DUCN7) | 36N 75.6W | 14/2200 | SW 37 G48 | |
| Cape Lookout
(CLKN7) |
34.6N 76.4W | 14/1900 | S 34 G39
Peak gust 46 |
|
| Chesapeake Light
(CHLV2) |
36.9N 75.6W | 14/2200
14/2300 |
NE 46 G50
Peak gust 63 |
Table 2. Ship, buoy and coastal C/MAN station observations taken during the passage of Charley.
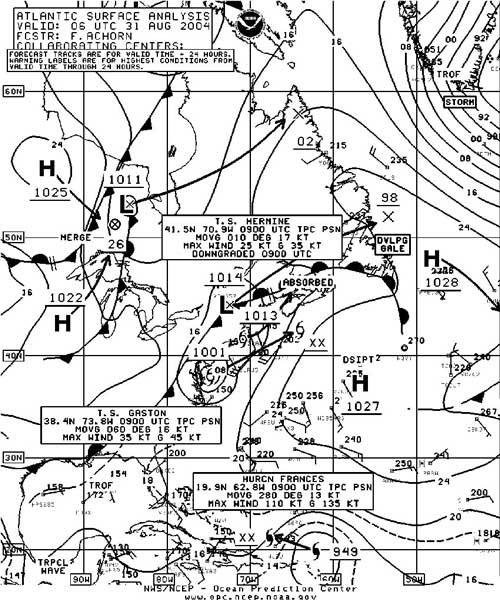 |
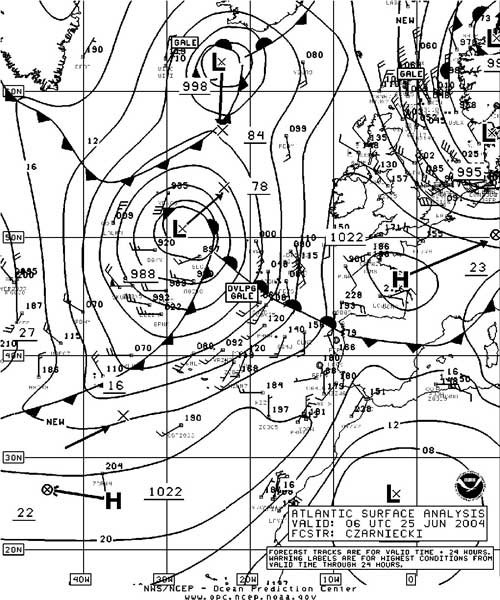
Figure 4. OPC North Atlantic Surface Analysis chart (Part 2 - west) valid 0600 UTC August 31, 2004. |
Tropical Storm Danielle: Danielle, once a hurricane over the open waters of the eastern tropical Atlantic, weakened to a minimal tropical storm while approaching OPC's high seas area from the south, near 30.3N 37.0W at the 0900 UTC advisory time on August 20. OPC's high seas area is north of 31N and west of 35W. Danielle weakened to a tropical depression near 31N 38W twelve hours later, and then dissipated on the 21st about 800 nmi southwest of the Azores.
Tropical Storm Gaston: Tropical Depression Seven formed from a non-tropical area of low pressure about 120 nmi southeast of Cape Romain at 2100 UTC August 27 and became Tropical Storm Gaston the next morning while drifting northwest toward the coast. Gaston moved inland just northeast of Charleston early on August 29 with maximum sustained winds of 60 Kt and gusts to 75 Kt, just below hurricane strength. The cyclone then weakened to a depression on the evening of the 29th while inland over the Carolinas, before re-strengthening to a tropical storm while moving offshore from the Delmarva Peninsula late on the 30th. Figure 4 shows Gaston moving back over water as a tropical storm at 0600 UTC August 31. Gaston then headed northeast to Georges Bank on the 31st and began to become extratropical south of Nova Scotia at the end of the month. Some notable observations taken during the passage of Gaston are listed in Table 3.
| OBSERVATION | POSITION | DATE/TIME(UTC) | WIND | SEAS(m/ft) |
| Tellus (WRYG) | 40.6N 63.2W | 01/0000 | SW 44 | 5.0/17 |
| Buoy 41004 | 32.5N 79.1W | 29/1000 | maximum 6.0/20 | |
| Buoy 41013 | 33.5N 77.6W | 29/1000 | SE 27 G35 | 2.5/8 |
| Buoy 44014 | 36.6N 74.8W | 31/0600
31/0400 |
SW 27 G37 | 2.5/8
maximum 3.0/10 |
| Buoy 44004 | 38.5N 70.5W | 31/1600
31/1700 |
SW 33 G43 | 4.0/13
maximum 5.5/18 |
| Buoy 44008 | 40.5N 69.4W | 31/2200 | NW 31 G41 | 5.5/18 |
| Buoy 44137 | 42.3N 62.0W | 01/1000
01/1300 |
NW 29 G 43 | 3.5/11
maximum 4.5/15 |
| Buoy 44141 | 43.0N 58.0W | 01/1200
01/1800 |
S 31 G49 | 2.5/8
maximum 5.0/16 |
| Folly Island
(FBIS1) |
32.7N 79.8W | 29/1200
29/1300 |
NW 32 G40
Peak gust 47 |
|
| Chesapeake Light
(CHLV2) |
36.9N 75.6W | 31/0100 | SW 43 G50 | 2.0/7 |
Table 3. Ship, buoy and coastal C/MAN station observations taken during passage of Tropical Storm Gaston.
Tropical Storm Hermine: Hermine was short-lived. Like Gaston and Alex before it, Hermine formed outside the tropics off the U.S. southeast coast about 360 nmi west of Bermuda on the afternoon of August 29 and moved north, developing maximum sustained winds of 45 Kt with gusts to 55 Kt while passing 200 nmi east of the Delmarva Peninsula on the afternoon of the 30th. Hermine then weakened to a tropical depression near Cape Cod early on August 31 while Gaston was emerging off the Delmarva coast (Figure 4). Hermine then merged with a frontal zone to the north later that day.
Other Significant Events of the Period
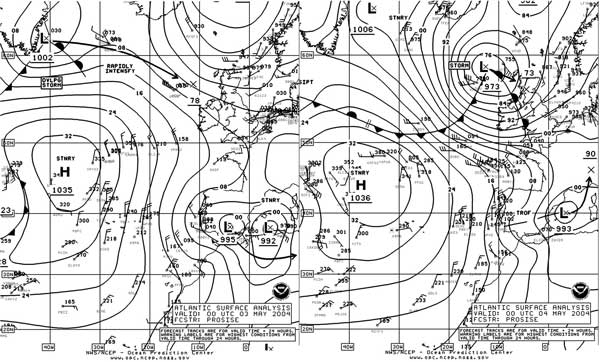
North Atlantic Storm, May 3-4: An area of low pressure moved off the Labrador coast early on May 2, to the southeast Greenland coast late on May 2. The system then moved east-southeast toward Great Britain while rapidly intensifying (Figure 5). The central pressure dropped 29 hPa in the twenty-four hour period covered by Figure 5, the fastest intensification of any non-tropical low during this period. The center developed a pressure as low as 970 hPa (second deepest of the four-month period) near the coast of Scotland at 1200 UTC on the 4th. Among several buoys west of Great Britain, 44551 (55.5N 17W) reported the strongest wind (northwest 45 KT) at 0300 UTC May 4, while the others reported winds in the 30 to 40 KT range. A QuikSCAT image taken near 0600 UTC on the 4th (not shown) revealed a small area of 50 KT northwest winds near 54N 14W. Buoy 62090 (53N 11W) reported seas as high as 10.0 m (33 ft) at 1000 UTC May 4. Buoy 62081 (51N 13.5W) had seas up to 9.5 m (31 ft) at 1200 UTC on the 4th. The storm subsequently stalled and weakened over Great Britain on the 5th, before lifting northwest the next day and dissipating near Iceland on May 8.
|
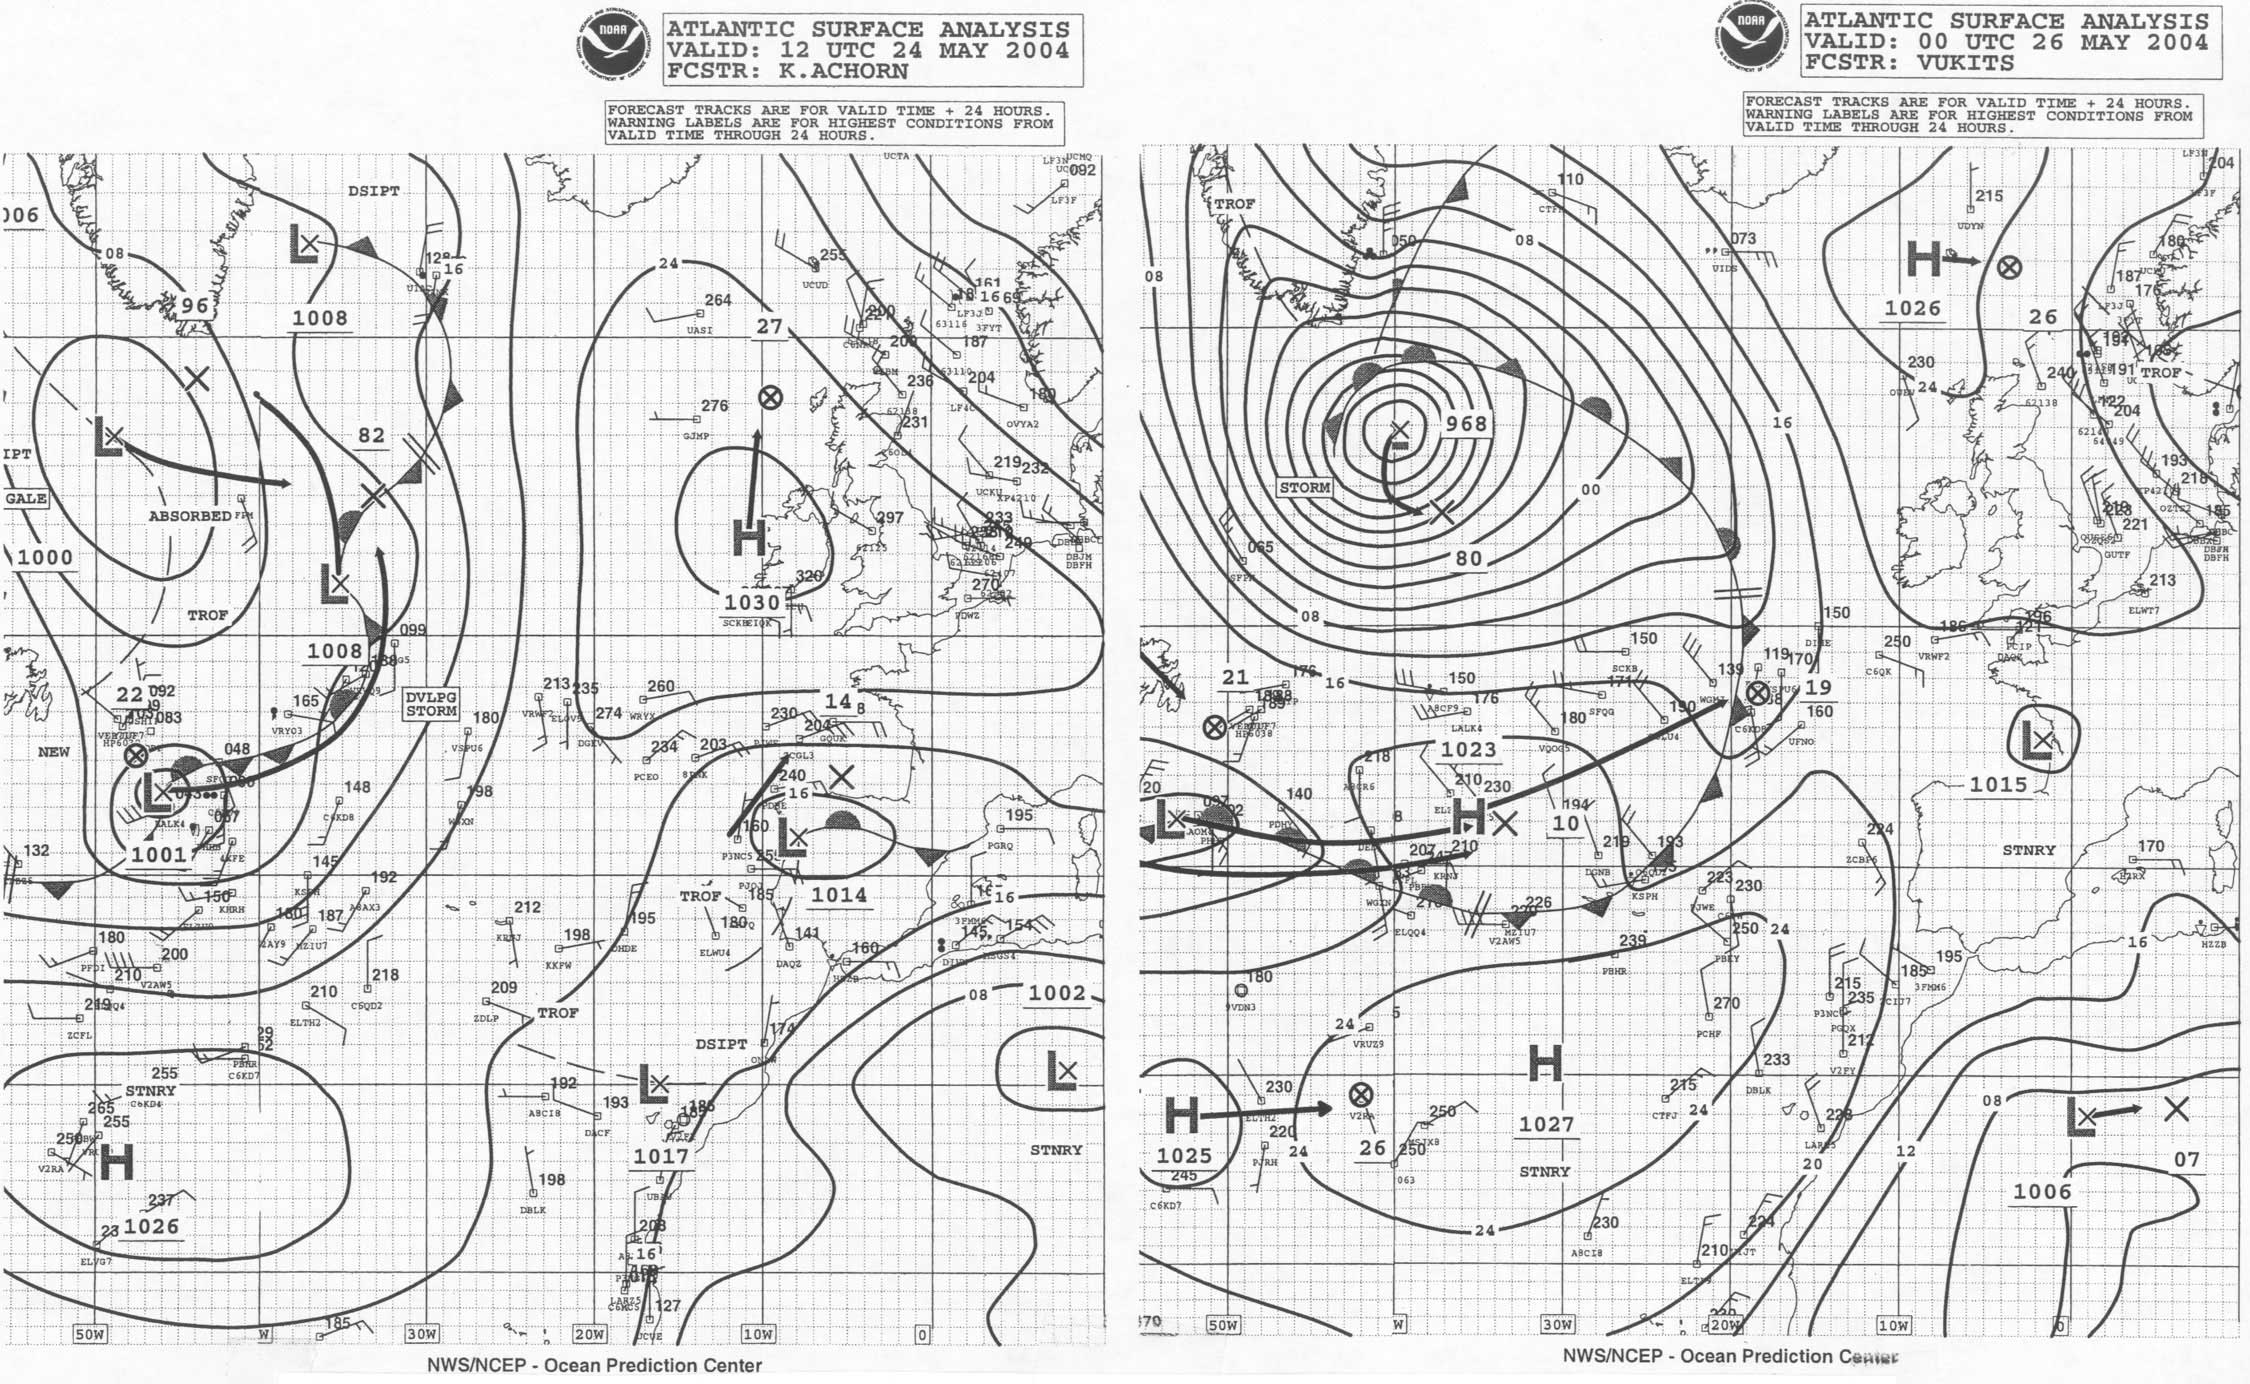
North Atlantic Storm of May 25-26: This development over the central waters is shown in Figure 6, covering a 36-hour period. The period of most rapid development was in the twenty-four hour period after 1200 UTC May 24, the valid time of the first part of Figure 6, when the central pressure dropped 29 hPa. This matched the rate of deepening of the early-May storm described above. This storm became the most intense (in terms of central pressure) of the four-month period in not only the North Atlantic but also the North Pacific as well, and the second part of Figure 6 shows the storm at maximum intensity, 968 hPa.
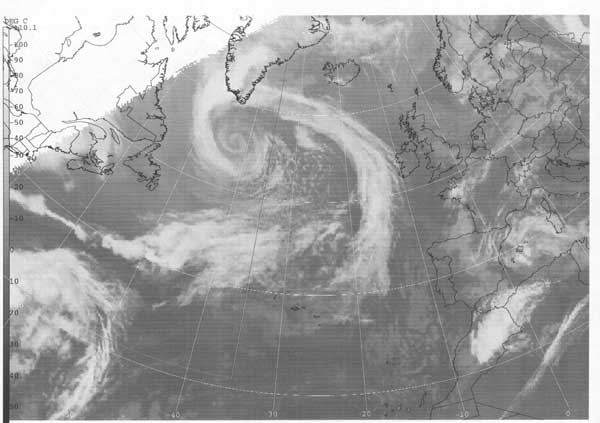
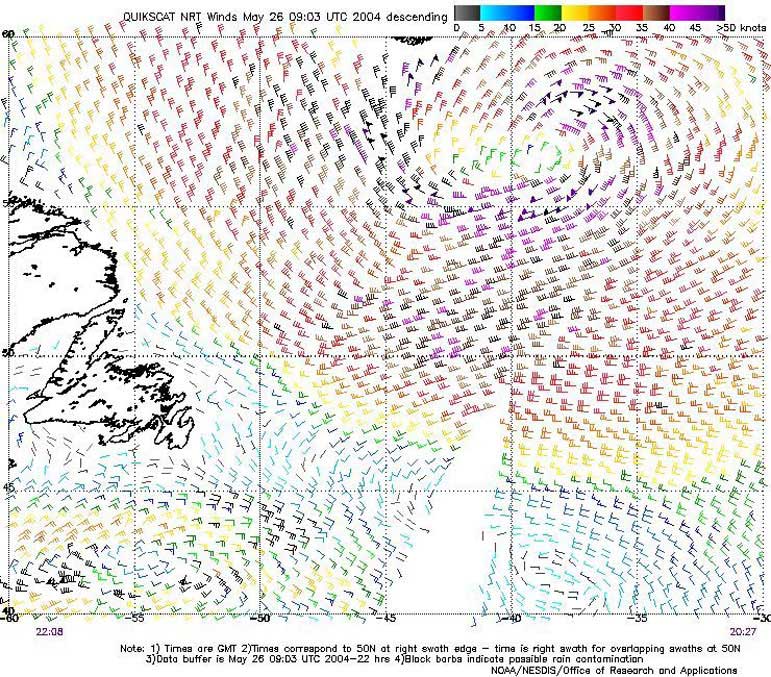
The storm is shown six hours later in the satellite picture of Figure 7 as it was looping back to the south. The system appears as a mature well-defined cloud spiral around the center south of Greenland, with the frontal cloud band extending almost to Ireland. With the storm's passage through an area lacking in ship reports, QuikSCAT data becomes especially useful. The satellite-derived winds shown in Figure 8 reveal winds of 50 KT almost surrounding the center near 57N 39W, with a 55 KT wind barb appearing near the top of the figure. A ship, Independent Action (A8CF9) near 48N 36W, encountered west winds of 45 KT at 1800 UTC May 25, well south of the storm center. The system subsequently moved southeast and weakened to a gale near 54N 37W at 0000 UTC May 27, before drifting east. The low dissipated 600 nmi west of Scotland by month's end.
|
North Atlantic Storm of June 3-4: This storm followed a track toward the north-central waters like the late-May storm, but originated near the mid-Atlantic coast on June 1 and was not as intense. The deepening center passed east of Newfoundland at 0000 UTC June 3, and then briefly became a storm near 57N 36W with a 986 hPa central pressure at 0600 UTC on the 4th. Six hours later the ship Stadiongracht (PDBY) near 54N 38W reported a west wind of 50 KT. The system continued on a northeast track and weakened to a gale late on the 4th, before dissipating west of Norway on the 7th.
Northeast Atlantic Storm of June 24-27: This storm was the stronger of two lows which moved east and then northeast from the Canadian Maritimes in late June and developed into storm-force lows over the far northern waters between Greenland and Iceland before stalling and weakening. The first moved east from Newfoundland on June 22 and then intensified after absorbing another low dropping south from Iceland (Figure 9). The maximum intensity of 977 hPa was reached near 52N 26W, twelve hours later than the first part of Figure 9. The ship M/V Freedom (WDB5483) (48N 24W) encountered west winds of 45 KT at 0600 UTC on the 26th. The storm then lifted north to near Iceland and then looped to the southwest by early on the 27th (second part of Figure 9). The Atlantic Peace (DEOT) reported northeast winds of 60 KT off Greenland's east coast at 0000 UTC and 0600 UTC June 27. The system then stalled and weakened, and was absorbed by the second of the two lows early on the 29th, which looped southwest of Iceland on the 30th before moving toward Great Britain and weakening on July 1.
|
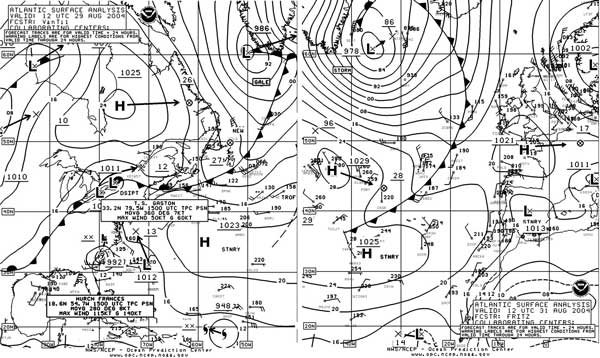
North Atlantic Storm of August 30-31: This developing storm took a more northern track typical of late summer as shown in Figure 10. After leaving the Labrador coast early on August 28, the system redeveloped on the east side of Greenland at 0000 UTC on the 31st, becoming the storm shown in the second part of Figure 10. The Atlantic Peace (DEOT) encountered storm-force northerly winds near 62N 40W from 0000 UTC August 30 through 0600 UTC August 31, peaking at 58 KT at 0000 UTC on the 31st. These observations agree well with a QuikSCAT image showing 50 to 60 Kt winds west and northwest of the storm center (Figure 11). As the system drifted east at month's end, the Nuka Arctica (OXYH2) reported northwest winds of 45 Kt near 59N 45W at 1800 UTC August 31.
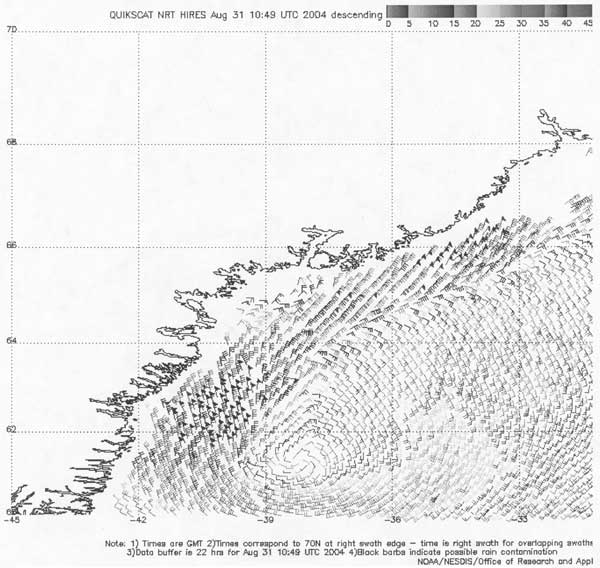 |
Figure 11. QuikSCAT scatterometer image of satellite-sensed winds valid approximately 0600 UTC August 31, 2004. The valid time of the pass is about six hours prior to the valid time of the second analysis in Figure 10. Image is courtesy of NOAA/NESDIS/Office of Research and Applications |
Page last modified: