Weather Fax Charts versus Electronically Derived GRIBs
In recent years, the maritime community has taken to the latest trend of weather information of electronically produced weather, most notably the software generated GRIB(s) an acronym for Gridded Binary Data files. There are advantages to this form of weather information but there must be a cautious approach as well, especially if used as a sole source of weather information. Lets focus on the facts that every mariner needs to know concerning the traditional Fax Charts (Weather Faxes) versus GRIB(s) and which one should be relied upon (or used jointly) for your marine weather analyses and forecast information:
Fax Charts are weather charts and other graphic images such as weather satellite imagery broadcast and received by many vessels at sea using a dedicated High Frequency (HF) signal, Single Sideband (SSB) via a shortwave receiver (referred to as Radiofax). The receiver is connected to an external facsimile recorder (e.g., Furuno) or a PC equipped with a Radio-Fax interface and application software system (e.g. Xxero).
What is not emphasized enough is that Fax Charts are created from human intelligence input by professional meteorologists from the worlds governmental meteorological agencies. These agencies have the industrial capabilities of high speed computers and the ability to share them with the worlds meteorological community and the world at large within the public domain. The exception is that government agencies will practice exclusion of such information in times of war.
Since the 1950s, Fax Charts were a mariners lifeline to global graphical weather information that is not only continuing today, but highly likely for some time well beyond 2010. Thousands of commercial ships are engaged in the global transit of the seven seas where serious engagement of international commerce is taking place and most of the ships rely on Fax Charts for their safety and strategic weather routing decisions.
In the US, the US Coast Guard (USCG) transmits these graphical weather Fax Charts via HF-SSB from its communication facilities at Marshfield, MA (near Boston) for the North Atlantic Ocean; Point Reyes, CA (North of San Francisco) for the North Pacific Ocean; Belle Chase, LA (near New Orleans) for the Gulf of Mexico, Caribbean, and the Tropical Atlantic Ocean South of 30 North; and Kodiak, AK covering the Gulf of Alaska and the Bering Sea. There is also a transmitting site operated by the US Navy located in Honolulu, HI that extends a fax service into the southern hemisphere to 25 South (unfortunately, not nearly far enough south as it should be (e.g., 50 South).
As already noted, the Fax Charts (or graphical weather charts) are not going to be replaced any time soon. This is evidenced by the fact that the USCG is committed to upgrading its old technology transmitters from its communication stations throughout the mainland US and Alaska to the tune of 38 million dollars. Also, voice broadcast from sources as from the USCG, NOAA Weather Radio (The voice of the NWS), and other non government sources will remain in operation for the foreseeable future. Fax Charts are also available from other transmission systems based on e-mail, satellite and the Internet.
GRIBs are an acronym for Gridded Binary Format. They are nothing more than a different communications format. The first usage was for computer generated model data. Today, GRIBs are use the same similar meteorological model data output (such as pressure and wind fields) which are communicated in a GRIB format. The NWS also will provide its forecast products in similar GRIB format for its forecast data. This is already beginning to occur. An example of this is The National Digital Forecast Database (NDFD), already available at local NWS field offices (see NDFD below).
There is also unfortunately, a misconception of the basic fact of human interface surrounding GRIBs. They are purely unfettered by any human interface to change its solution and thus constitute only a singular solution to the weather forecast (of which there are many). Therefore, depending on a specific weather pattern or one that is not stable, GRIBs can be wrong! NWS and other professional forecasters are well aware of this when they deliberate their own forecasts. Thus, they look at a number of global and regional computerized forecast models before deciding on their own forecasts. NWS forecasters take custody of these analyses and forecasts by placing their names on their products. This is a VERY important distinction that must be made and understood, as sometime the actual source of GRIBs are masked by a companys signature label versus which forecast model that the GRIB data was derived from.
The other misconception concerning GRIBs is the frequency of available downloads. There is the impression of frequent 6 hourly weather forecast updates, when in fact there are only two major global weather model outputs daily. These two a day model runs are based on the data collection process of surface and upper air weather information where an instrument called a Radiosonde (or Rawinsonde) is carried aloft by a helium filled balloon to send back information on temperature, moisture (dew point), pressure/altitude, by means of a small expendable radio transmitter at 0000/1200 Universal Time Coordinated (UTC), Greenwich Meantime Time (GMT) or Zulu (Z), all are based at the same referenced time standard throughout the world representing the time at the Prime Meridian. Radiosondes can be tracked by radar, radio direction finding, or navigation systems (such as the satellite based Global Positioning System (GPS) in order to obtain wind data (wind direction and speed at various levels). Therefore, the 6 hourly GRIB downloads are nothing more than advancing the time stamp by 6 hours from either the 0000 or 1200 UTC model outputs in GRIB format, and are not output from any new forecast models. This is deceivable and disingenuous to an unsuspecting user.
The positive side to the use of GRIBs is that they offer continuity of their individual solutions in as little as 3 hourly time sequences from the initial analysis (or interim 6 hourly forecasts.. such as the case of interim downloads from either 06 UTC or 18 UTC through 5 days or 120 hours) sometimes more into the future. In stable weather patterns, this has obvious advantages over the Fax Charts which have 24 to as much as 48 hour gaps of weather information in between the Valid Date and Times of their forecasts. GRIBs are also easily received and downloadable in a compressed format at sea (only in a matter of a few seconds) In comparison with the older HF-SSB technology which takes some 10 minutes to download a single weather chart via a facsimile recording machine or by computer and modem recorder. This makes GRIBS very attractive and convenient from a time and motion point of view.
On the other hand, creative vendors have been able to compress the HF-SSB fax chart reception to as little as 22 seconds. This is a far cry from the 10 minute downloads needed when receiving the same aforementioned Fax Charts via the older technology of taking a HF-SSB signal through the older fax chart paper version received fax charts as done on many thousands of commercial ships at sea (e.g. from Furuno fax machines).
The use of GRIBs as the sole source of weather information at sea is not only irresponsible but can be dangerous, especially in unstable or volatile weather patterns. NWS and other professional forecasters are again well aware of this fact, and thus make important adjustments to the critical decisions that go into their warning and forecast products that are communicated through HS-SSB technology, GMDSS and NAVTEX text products, and voice broadcast.
As previously noted, the NWS already has made similar gridded forecasts available on its web site from local forecast offices around the county. The NWS calls it The National Digital Forecast Database (NDFD). The NWS NDFD provides access to gridded forecasts of sensible weather elements (e.g. wind & wave heights) throughout the US coastal field offices for users to create a wide range of text, graphic, gridded, and image products of their own. You can link to any NWS Forecast Office site from marine weather links from the National Weather Services NDFD site (http://www.weather.gov/forecasts/graphical/sectors/ ).
Look for this format to be extended to beyond the coastal ranges of the NWS field office with coastal and inland waters marine forecast responsibilities, to the larger forecast domains from the Ocean Prediction Center (OPC) (http://www.opc.ncep.noaa.gov/) and the Tropical Prediction Centers (TPC) Tropical Analysis and Forecast Branch (TAFB) (http://www.nhc.noaa.gov/marine_forecasts.shtml ). Both of these sites can be also directly linked via the National Centers of Environmental Prediction (NCEP which has oversight of 6 other centers as well as a Central Operations field office that sustains and executes the operational suite of numerical analyses and forecast models and prepares other NCEP products for dissemination):(http://www.ncep.noaa.gov/ ).
Any NWS field office as well as any national center under NCEP is also conveniently hyperlinked directly from the NWS via their main marine weather link:(http://www.nws.noaa.gov/om/marine/home.htm ).
Archive NWS weather charts (analyses and forecasts) can be obtained through the following NOAA/NWS link: (http://nomads.ncdc.noaa.gov/ncep/NCEP ).
Finally, even though I left government service at the end of July, 2006, to run my own education and training based company, I have resisted the luring temptation that many amateur weather hobbyist have reverted to; their own weather model interpretation or reliance on GRIB solutions. I summarize below why:
- Professional forecasters have the necessary tools at their disposal to make not only comparisons of the different global and regional weather model outputs (see Figure 1), but the ability to integrate blended solutions.
- There are solid and reliable inter-office high speed network discussions taking place throughout the country via dedicated phone and chat-lines to coordinate and share thoughts and ideas of the current and future trends of a given weather pattern or major weather event in play. This coordinated effort ensures the best possible analyses and forecasts of both major and less significant weather systems in general, on land and at sea.
- Most importantly, such human intelligence derived analyses and forecasts via text or graphics should be regarded as the gold standard with which other sources of non human interfaced weather data (such as GRIB files) should be compared. Pure public domain weather models and GRIBs, therefore, represent a supplementary source of weather information and I encourage its use. The more information a mariner can refer to, the better off he/she will be when making his/her own independent assessment of the environment he/she will sail in.
Coupled with consistent and dedicated on scene weather observation (comparing actual observed weather conditions with human interfaced analyses and forecasts see discussion below and note Figures 2 and 3), this balanced approach will give mariners a high probability of navigating the coastal, offshore, and high seas with confidence and safety.
To assist this balanced approach of collecting and evaluating multiple sources of weather information (which by the way also includes voice generated VHF broadcasts from the USCG voice and NOAA Weather Radio, Bounder WWV, and other sources of weather information such as Fax Charts & GRIBs), along with a documentation and verification process, I have designed a spreadsheet document to track vessel movement vis a vis weather forecasts from 24-36-48-72 & 96 hours and then comparing them with the most current verifiable surface weather analysis and observed weather conditions as experienced and recorded on scene. This enables a mariner to have documented and verifiable track record of weather forecast biases (high or low), which can be further refined by the mariner who then becomes his or her on scene forecaster. This is the way it should be in the year 2010 and beyond; call it self reliance based on the most reliable and accurate forecast as derived from human intelligence: The Professional Meteorologist and the Professional Mariner (see Figure 4).
Regardless of your sources of weather information, hopefully it will be multi-sourced ,, any mariner can not only document weather forecasts in a consolidated and organized manner, but can see the biases in the forecast parameters of temperature, pressure, wind, clouds & weather, and can compare with the on scene weather observations for self reliance and tweaking their own weather forecasts.
As Benjamin Franklin in 1790 once quoted: Some People Are Weatherwise, Most Are Otherwise. Which one are you?
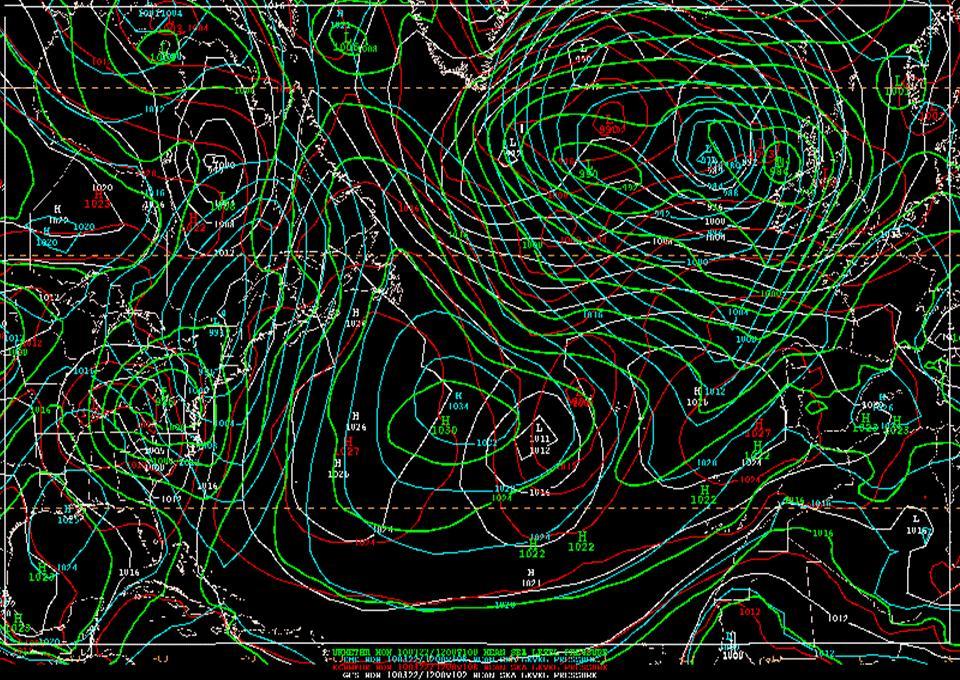
Figure 1: Represents a number of global weather model solutions in which GRIB files can be derived from.
Please note the differing solutions at the day 5 time frame (120 hours).
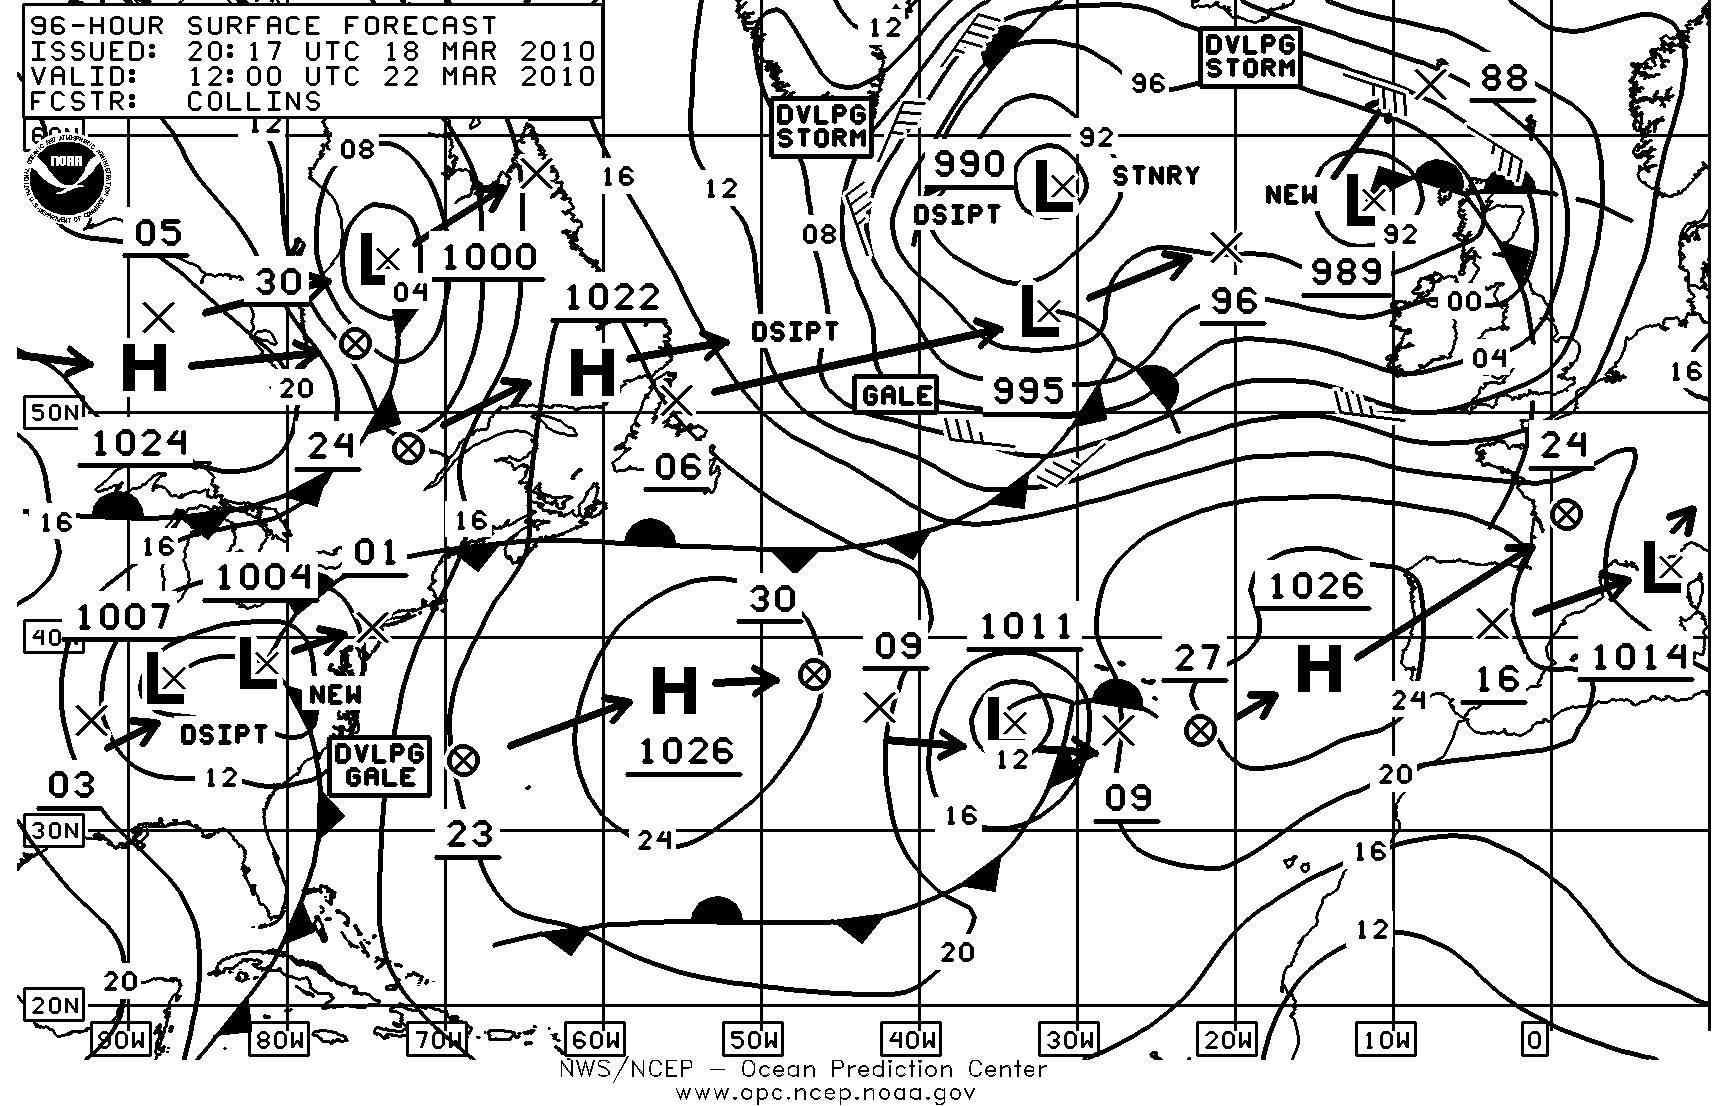
Figure 2: 96 hour surface pressure forecast from the Ocean Prediction Center.
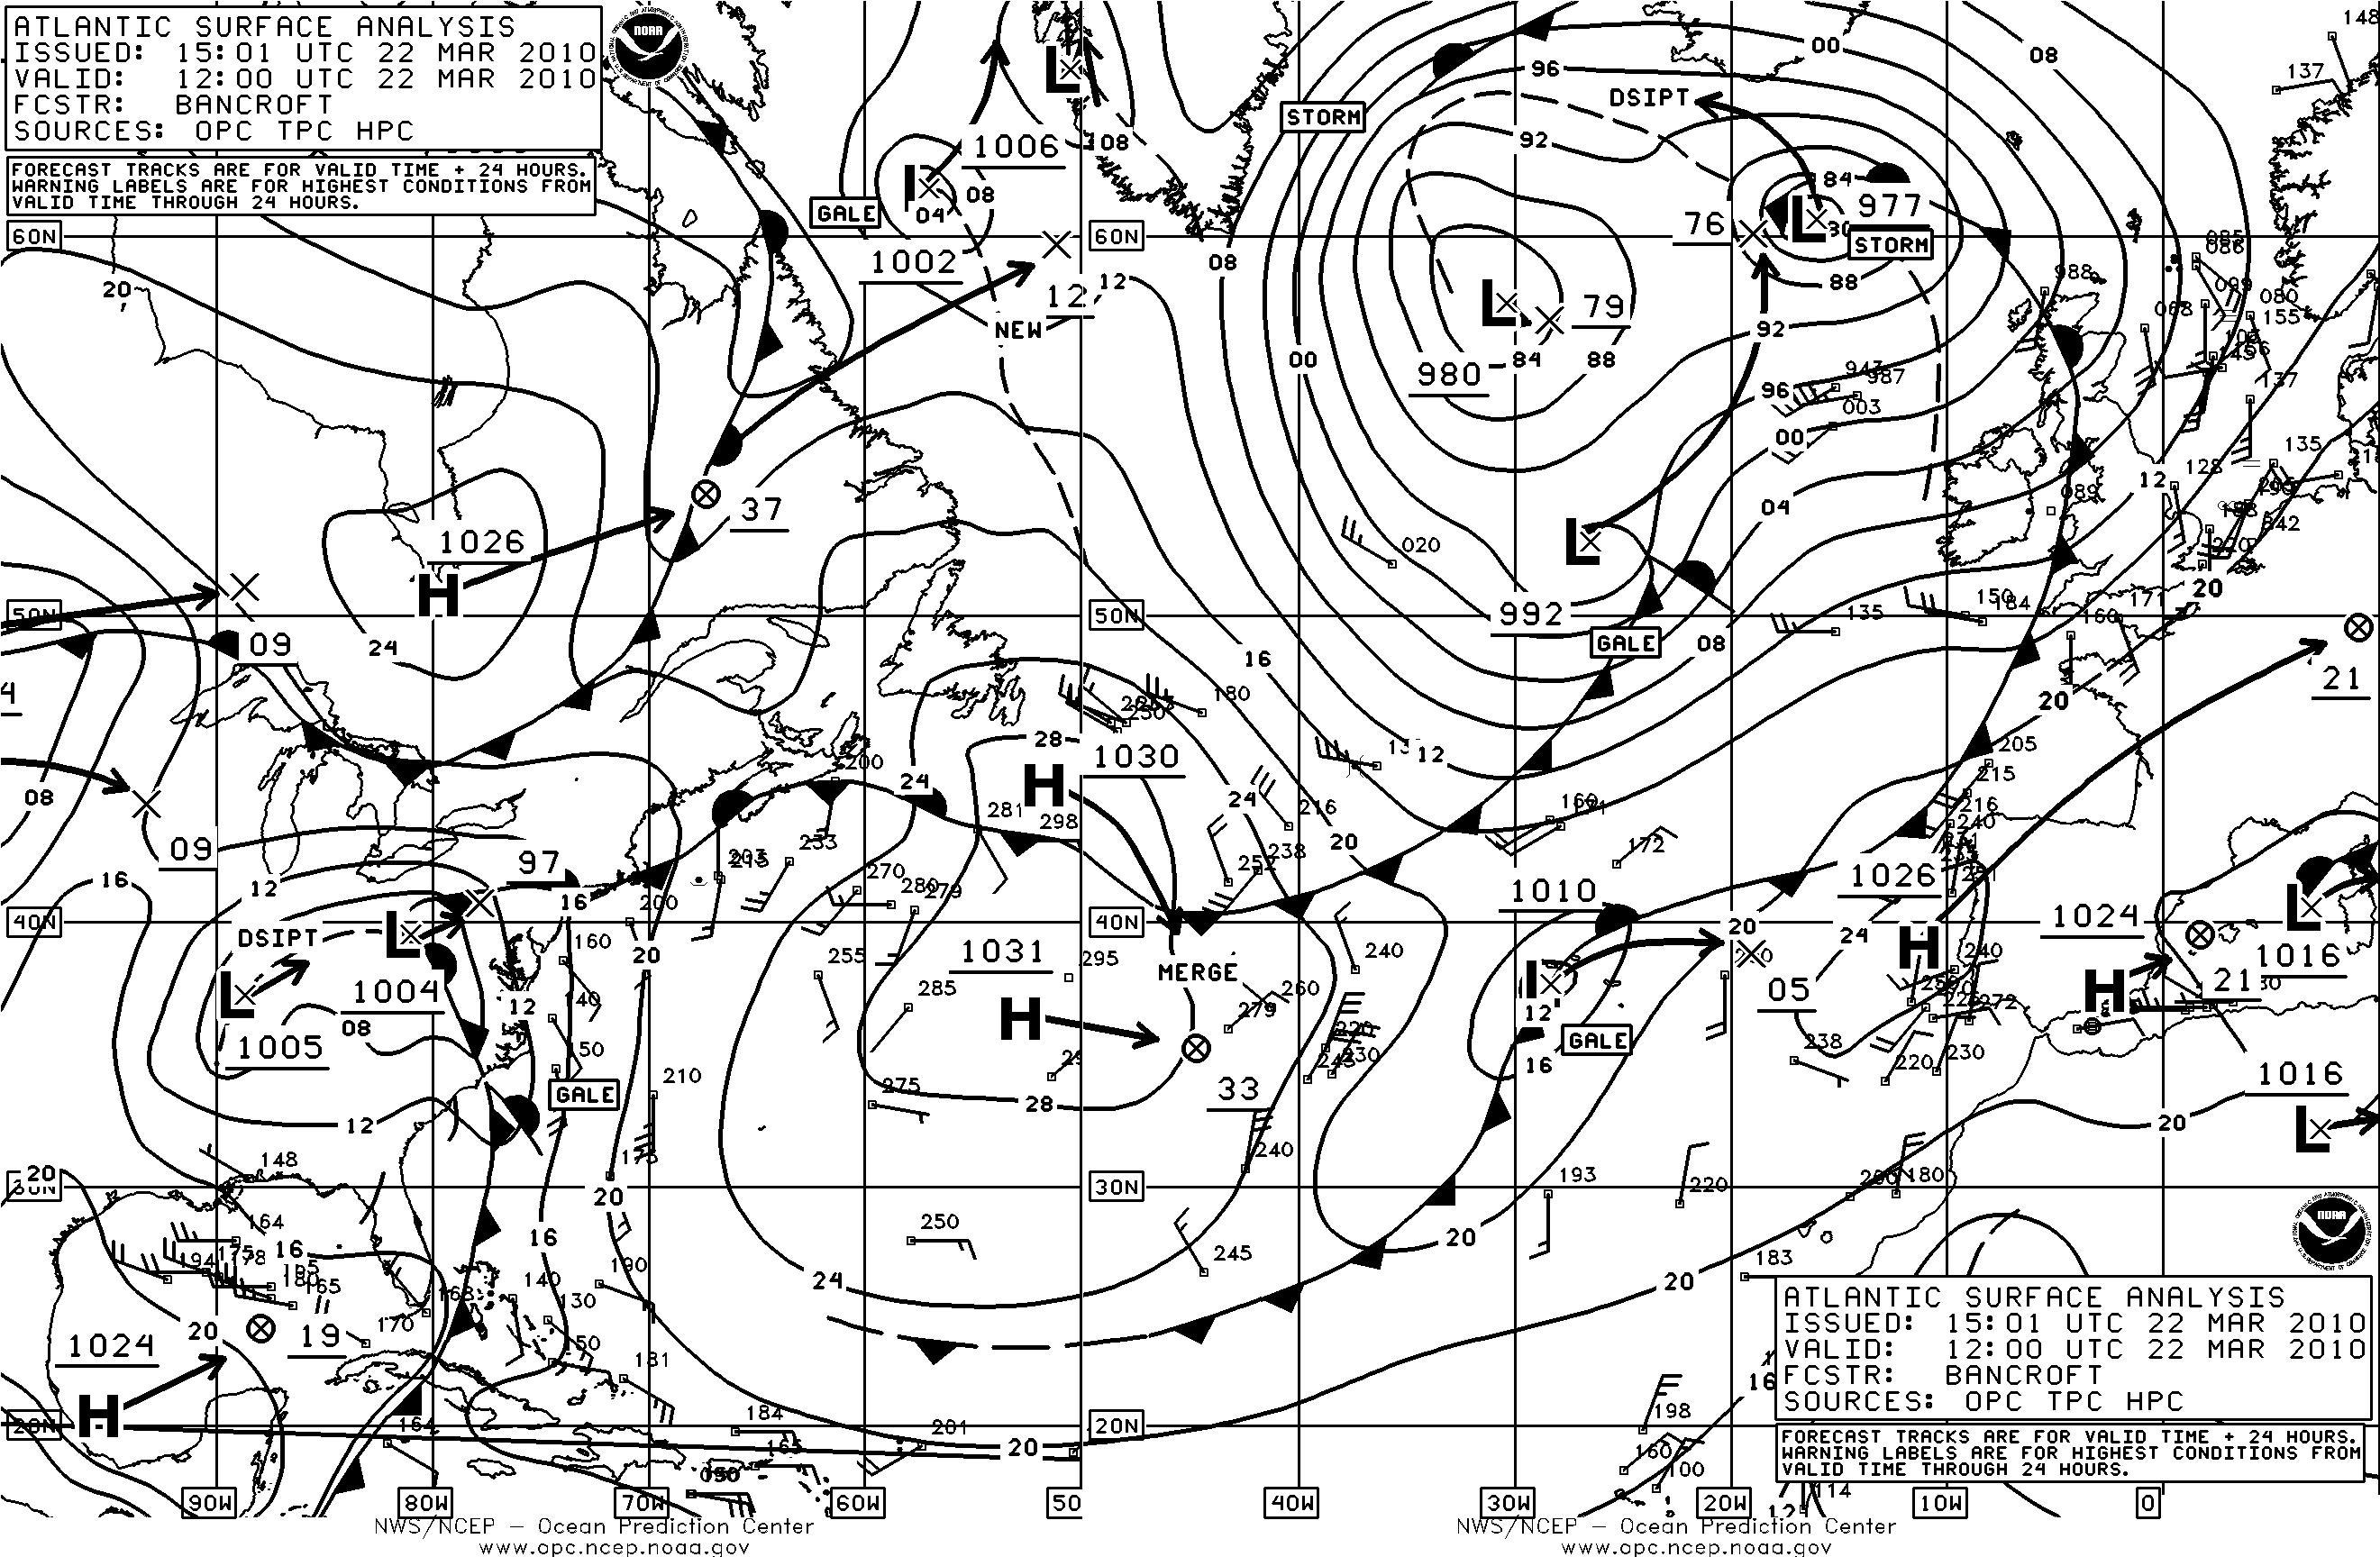
Figure 3: The verifying surface analysis four days (96 hours) later from figure 2.
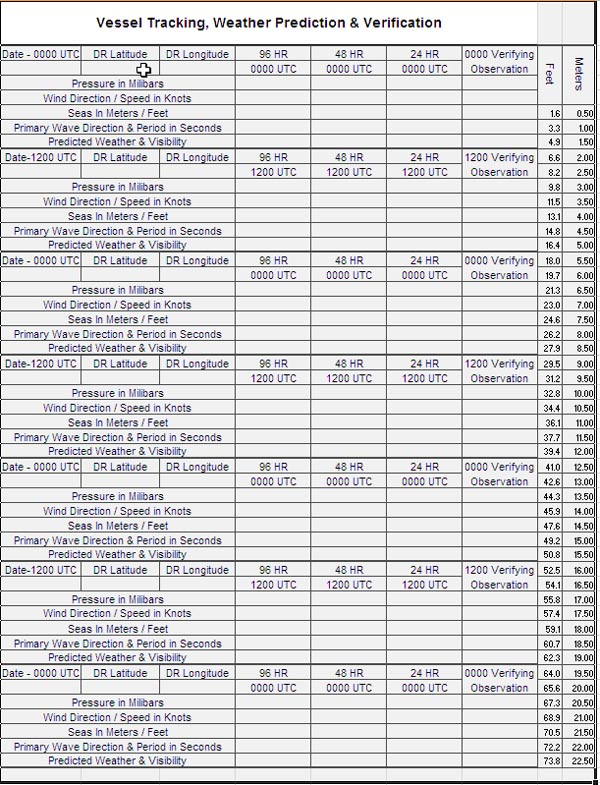
Figure 4: Vessel tracking, forecast documentation and verification spread sheet.
Editors Note:Lee Chesneau is a former NOAA/NWS senior marine forecasters who worked at the NWS Seattle- Tacoma Forecast Office for 5 years and the OPC for 18 years. He retired in July 2006 and now runs his own company Lee Chesneaus Marine Weather (www.marineweatherbylee.com), where he formally trains professional and recreational mariners on how to read NWS marine weather forecast products and how strategize avoiding heavy weather. Much of NWS weather information is contained on his webpage and links to other NOAA/NWS sites.
Back to top