Tropical Atlantic and Tropical East Pacific Areas January through April 2010
Jessica Schauer, Marshall Huffman and Scott Stripling
Tropical Analysis and
Forecast Branch
National Hurricane Center, Miami, Florida
NOAA National Center for Environmental Prediction
North Atlantic Ocean to 31N including the Caribbean Sea and the Gulf of Mexico
The National Hurricane Centers (NHC) Tropical Analysis and Forecast Branch (TAFB) issued 35 warnings in their Atlantic High Seas Area of Responsibility (AOR) and 21 warnings in their Pacific High Seas AOR during the period from 1 January to 30 April 2010. The 35 warnings issued in the Atlantic basin was the highest number of warnings ever issued by TAFB during a winter season. An active southern stream upper jet, a condition commonly associated with El Nino, characterized the winter 2010 season. The ensuing amplified weather pattern brought a higher than average number of cold fronts south of 31N into the TAFB AOR.
Atlantic Gale Warnings
| Onset | Region | Peak Wind Speed | Duration | Forcing |
|---|---|---|---|---|
| 0000 UTC 02 Jan | SW N Atlc | 40 kts | 36 hr | East of Cold Front |
| 0600 UTC 06 Jan | Central Atlc | 35 kts | 12 hr | Either Side of Cold Front |
| 0600 UTC 11 Jan | SW N Atlc | 35 kts | 24 hr | SW of Developing Low |
| 0600 UTC 17 Jan | SW N Atlc | 35 kts | 24 hr | East of Cold Front |
| 0000 UTC 23 Jan | SW N Atlc | 40 kts | 48 hr | West of Cold Front |
| 0600 UTC 25 Jan | SW N Atlc | 35 kts | 30 hr | East of Cold Front |
| 1200 UTC 26 Jan | Central Altc | 45 kts | 48 hr | S of Developing Low |
| 0600 UTC 30 Jan | Central Atlc | 40 kts | 36 hr | S of Developing Low |
| 0000 UTC 31 Jan | SW N Atlc | 35 kts | 18 hr | East of Cold Front |
| 1200 UTC 04 Feb | Central Altc | 35 kts | 42 hr | Either Side of Cold Front |
| 1200 UTC 05 Feb | SW N Atlc and Cntrl Atlc | 35 kts | 60 hr | East of Cold Front |
| 0600 UTC 10 Feb | SW N Atlc and Cnrtl Atlc | 40 kts | 78 hr | Either Side of Cold Front |
| 0000 UTC 13 Feb | SW N Atlc | 45 kts | 42 hr | S of Developing Low |
| 0600 UTC 17 Feb | SW N Atlc and Cntrl Atlc | 35 kts | 06 hr | East Side of Cold Front |
| 0600 UTC 19 Feb | Central Atlc | 40 kts | 12 hr | Either Side of Cold Front |
| 0600 UTC 25 Feb | Central Atlc | 35 kts | 30 hr | Either of Side Cold Front |
| 0000 UTC 28 Feb | SW N Atlc | 40 kts | 24 hr | Either of Side Cold Front |
| 1200 UTC 02 Mar | SW N Atlc and Cntrl Atlc | 35 kts | 48 hr | Either of Side Cold Front |
| 0000 UTC 13 Mar | SW N Atlc | 35 kts | 18 hr | East of Cold Front |
| 0600 UTC 29 Mar | SW N Atlc | 35 kts | 42 hr | East of Cold Front |
| 1200 UTC 24 Apr | Central Altc | 35 kts | 30 hr | S of Developing Low |
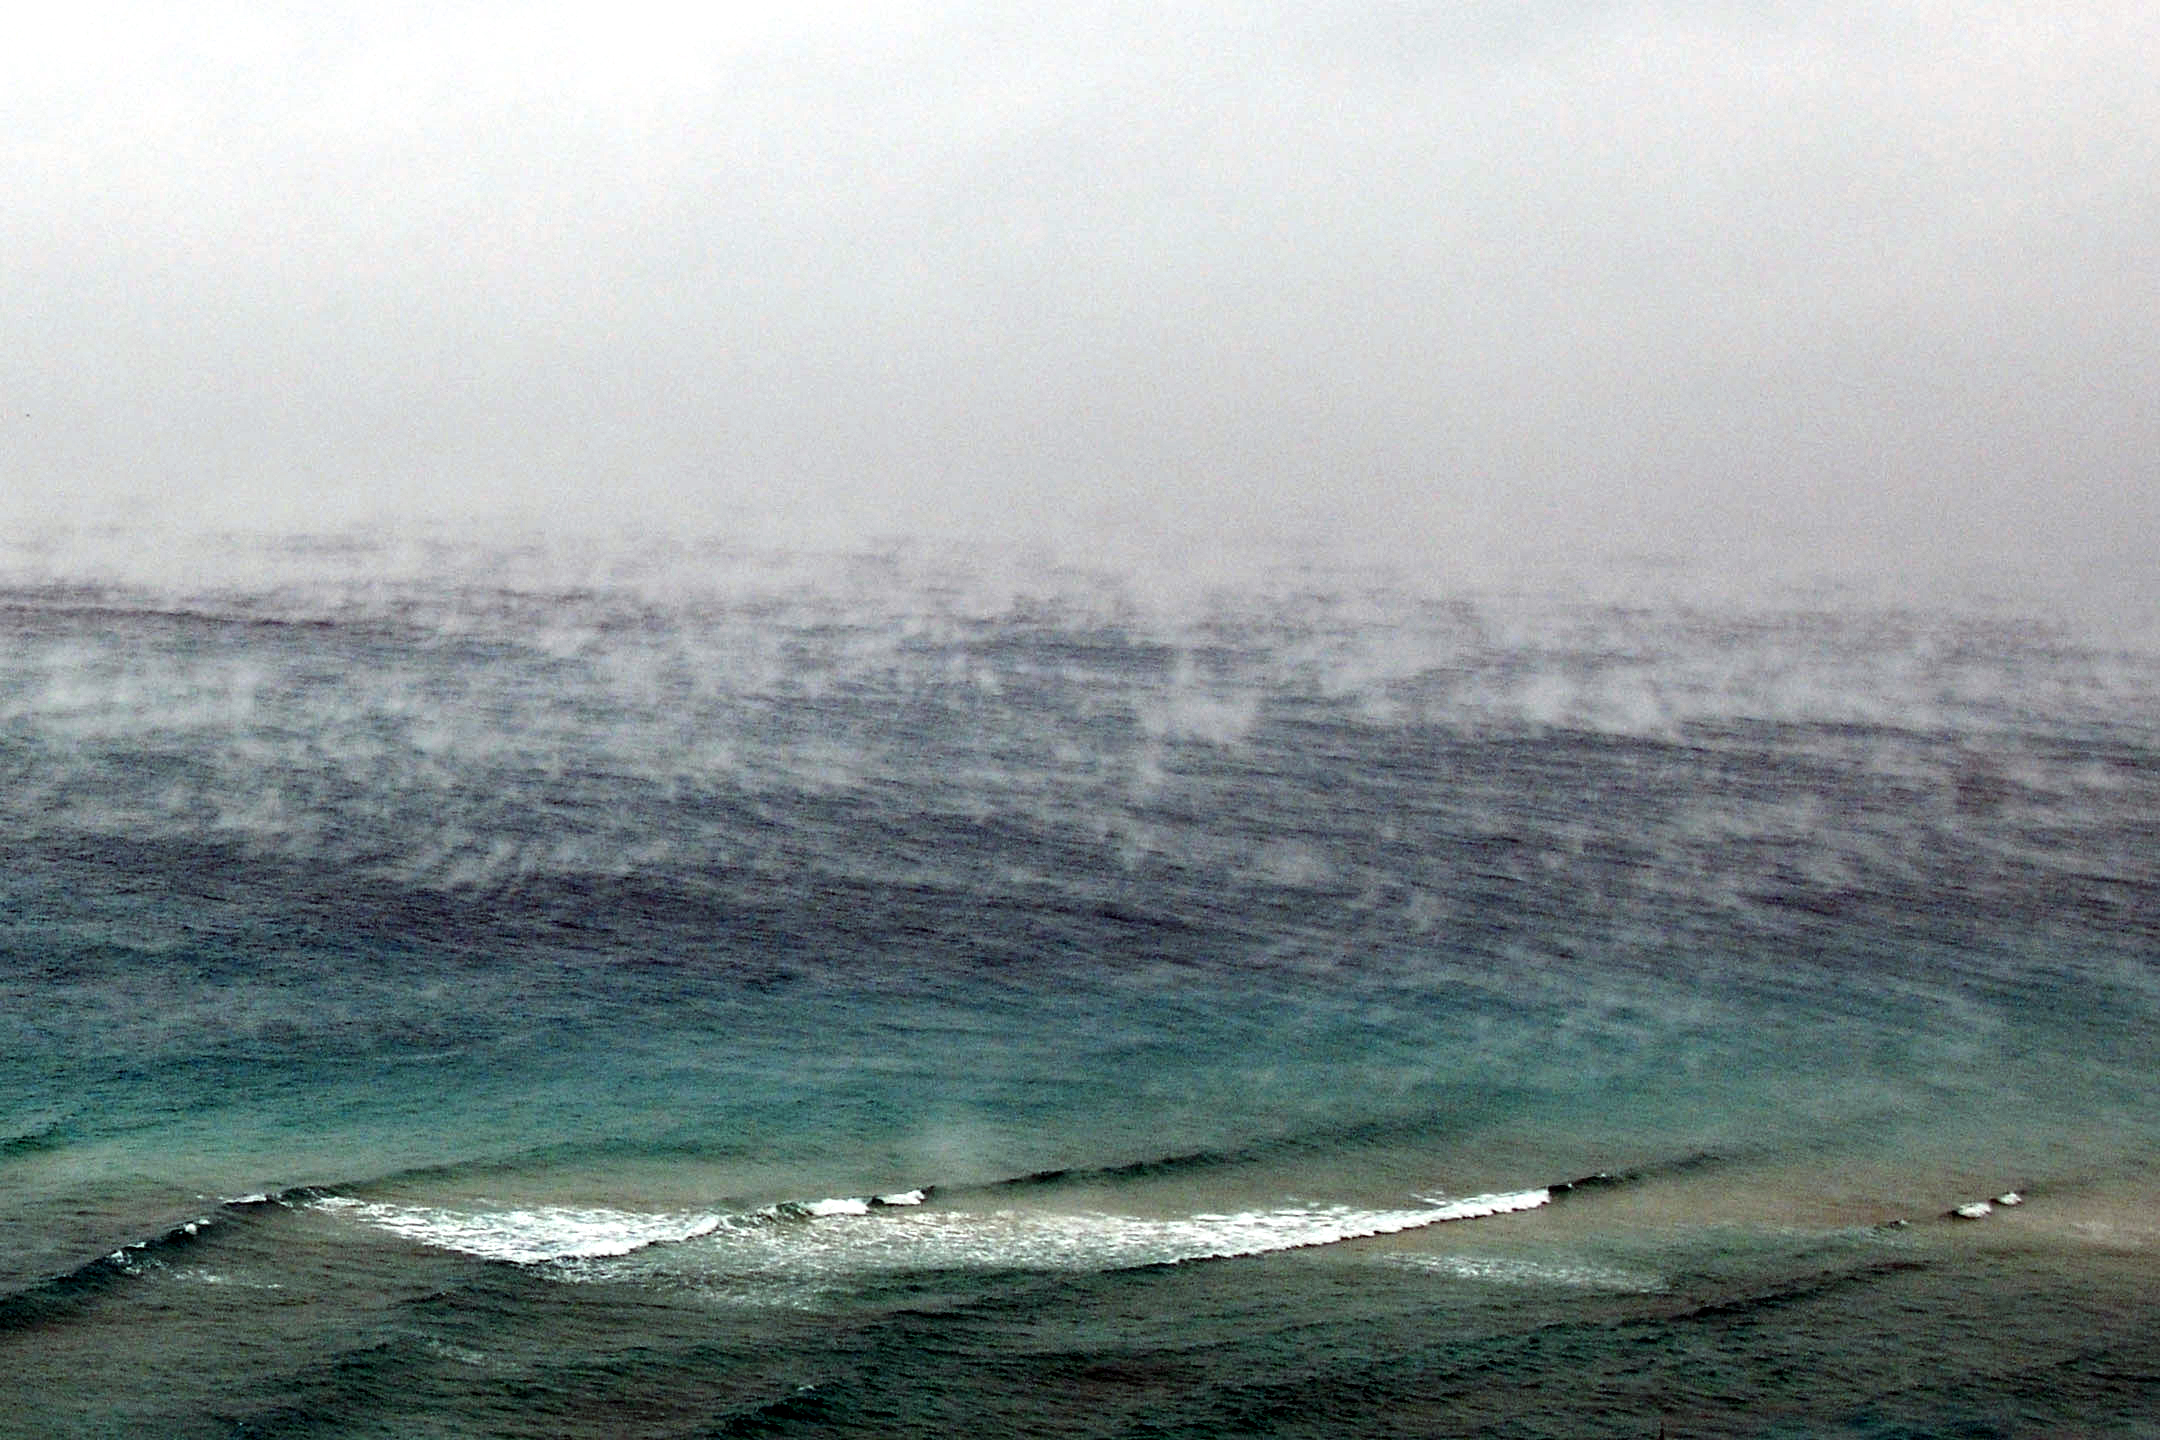
Figure 1. Steam fog along Miami Beach, Florida on 9 January 2010. Credit: Scott Stripling, NHC/TAFB

Figure 2. significant wave height analysis (in feet) from 0000 UTC 12 February 2010.
Six January cold fronts brought short-lived gale conditions to the southwest North Atlantic, with none of the events lasting more than two days. Five ships, the Costa Fortuna (IBNY), the Zuiderdam (PBIG), the Crown Princess (ZCDM6), the Carnival Pride (H3VU), and the Westerdam (PINX) reported gale conditions during two or more of these events. Warm water temperatures in the southwest North Atlantic in January resulted in an unstable boundary layer, which allowed winds at higher elevations to mix down to the surface. The warm water was a contributing factor to the large number of January gale warnings in the southwest North Atlantic. Meanwhile, air temperatures at the Miami International Airport (MIA) from January through March 2010 averaged 4-5° F below normal. The sharp contrast of the warm sea surface temperatures and unusually cold air lead to the development of very low cloud decks, rare steam fog, and light to moderate rain behind a cold frontal passage on 9 January, which produced periods of IFR conditions across the coastal waters of southeast Florida. Figure 1 shows an example of the steam fog along Miami Beach on 9 January. The lowest air temperature of the winter season, 35° F (1.7° C), was recorded at MIA the following morning 10 January.
By late January, the mean trough over the Atlantic began to shift east. The longer fetch over the North Atlantic allowed for large northwest swells to propagate into the TAFB AOR. Significant wave heights exceeded 20 ft (6 m) in the north central and northeast portions of the TAFB AOR during much of the period spanning 5-14 February when two hurricane force wind events moved through the North Atlantic. The significant wave height analysis shown in Figure 2 captures the largest swell event during the winter season, with seas upwards of 30 ft (9 m) north of 29N between 58W and 66W.
Both of these systems also produced gale force winds in the TAFB AOR. The first of these events began at 1200 UTC on 4 February, as a slow moving 964-hPa low centered near 38N54W brought a cold front into Central Atlantic forecast waters. Gale force winds were observed behind the front on 5 February by ships Maersk Georgia (WAHP) near 28N44W at 0600 UTC and MSC England (DEBN) near 26N47 at 1800 UTC. Gale winds were also seen by the ship Alliance Saint Louis (WGAE) near 29N35W ahead of the front in a strong pressure gradient between the front and a 1027 hPa high centered near 27N25W.
The second system that generated large swell in the TAFB AOR was associated with the longest gale warning period of the season in the Atlantic, persisting for 78 hours beginning 10 February at 0600 UTC. Gale force winds accompanied the cold front as it moved east, with gale conditions found north of 27N over the entire width of the TAFB AOR during the long warning period. The system continuously received reinforcing shots of Arctic air, allowing the cold front to remain strong and to develop small waves of low pressure along the front which enhanced the low level winds. The MetOp Advanced SCATterometer satellite (ASCAT) pass from approximately 1500 UTC on 10 February seen in Figure 3 reveals the large areal extent of the wind field in excess of 30 kts associated with this cold front early in the gale period (it should be noted that ASCAT has a low bias for wind speeds of around gale force and higher). Also, the wavy structure of the cold front can be seen in the eastern swath of this ASCAT pass. Winds were believed to be strongest at this time in between the ASCAT swath areas and north of the Horizon Producer (WJBJ) near 28N72W who was reporting northwest winds at 30 kts. The contrast of water temperatures in the upper 60s and low 70s F (approximately 20-22? C) and the cold air temperatures behind this front enhanced the stratocumulus cloud field west of the front.
Figure 3. Conditions in the western portion of the TAFB Atlantic AOR around 1500 UTC on 10 February 2010 including Geostationary Operational Environmental Satellite - East (GOES-E) visible satellite imagery, an ASCAT pass, and surface observation from ships and buoys.
The second longest Atlantic gale event began at 1200 UTC on 5 February over the southwest North Atlantic as the pressure gradient built between a 1003 hPa low pressure system over Mobile Bay, Alabama, and a surface ridge extending from 25N65W northwestward to a 1027 hPa high pressure center over Cape Hatteras, North Carolina. The first gale force wind observation within the southerly flow between the low and the ridge came at 1500 UTC on 5 Feb from the Kobe Express (DGSE) near 31N80W. Over the next 24 hours, the low moved from Mobile Bay, Alabama, to Cape Hatteras, North Carolina, as its central pressure dropped 17 hPa. A cold front extended from the low through the southwest North Atlantic, with gale conditions continuing ahead of the cold front as observed by the Samar (ZCDP8) near 25N75W at 1500 UTC on 6 February. Gale conditions diminished by 0000 UTC on 7 February.
The two strongest wind events in the Atlantic during the winter season occurred on the south side of deepening low-pressure systems centered south of 35N. Both events saw winds to 45 kts in the TAFB AOR. The first event occurred over in the far northeast portion of the TAFB AOR beginning 1200 UTC 26 January. Gale force winds were shown by ASCAT to persist on the west side of the slow moving cold front for two days. The second strong gale event occurred over the southwest North Atlantic from 0000 UTC 13 February to 1800 UTC 14 February. Ships Eurodam (PHOS) near 26N77W and Celebrity Solstice (9HRJ9) near 24N73W confirmed winds of 45 kts on 13 February at 0900 UTC and 1000 UTC, respectively.
After mid-February, the duration of gale events in the Atlantic shrank to less than two days and primarily occurred near cold fronts in the southwest North Atlantic, similar to earlier in the winter season. The main exception was a late season gale in the north-central and northeast portion of the TAFB AOR that occurred on the south side of a developing low-pressure system that brought northwest swell and seas to 25 ft (7.6 m) into the forecast area on 24-25 April.
Caribbean Sea Volcanic Ashfall Advisories
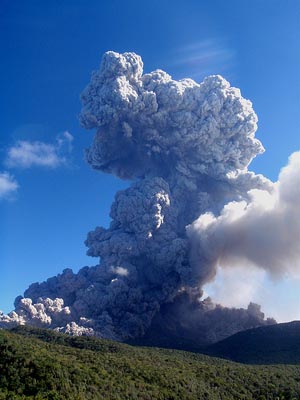
Figure 4. 8 January 2010 eruption of the Soufriere Hills volcano on Montserrat.
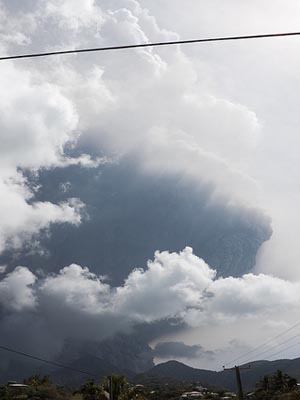
Figure 5. February 2010 eruption of the Soufriere Hills volcano on Montserrat.
The Soufriere Hills volcano on the Lesser Antilles island of Montserrat erupted at 1850 UTC on 8 January 2010 with a dense cloud of ash-laden gas exploding from the crater and rising high above the peak as shown in Figure 4. Thick volcanic ash reached the nearby coastal waters surrounding Montserrat and to the west-northwest of the volcano over the northeastern Caribbean Sea as reported by the Washington Volcanic Ash Advisory Center (VAAC). Reduced visibilities and light ashfall were the primary impacts in this event.
At 1715 UTC on 11 February 2010 another large eruption and dome collapse of Soufriere Hills (Figure 5) occurred with a dense ash cloud remaining in the vicinity of Montserrat and at low-levels surrounding Saint Kitts/Nevis and Antigua and Barbuda to the northeast. As the ash cloud gained altitude, low-level trade winds and upper level westerlies increased the coverage of light ash and reduced visibilities over much of the eastern Caribbean Sea north of 14N east of 64W and well eastward into the tropical North Atlantic.
For both of these events, TAFB noted the Volcanic Ash Advisories from the Washington VAAC within the Caribbean Offshore Waters forecast as well as the Atlantic High Seas product.
The first gale warning event of 2010 occurred in the southwest Caribbean along the eastern coastlines of Nicaragua and Costa Rica to the west of a strong cold front that extended from Hispaniola to western Panama. Figure 6 below shows the Unified Surface Analysis from 0000 UTC on 11 Jan. Minimal gale force winds were observed in the southwest Caribbean Sea. The Celebrity Equinox (9HXD9) reported 35 kts near 11.2N 82.5W between 0400 and 0800 UTC on 11 Jan. Also, a partial ASCAT pass showed winds reaching 30 kts off the coast of Nicaragua. As the cold front weakened over the next 24 hours across the western Caribbean Sea, convergent northerly and easterly winds fell below gale force by 0000 UTC on 12 Jan.
| Onset | Region | Peak Wind Speed | Duration | Forcing |
|---|---|---|---|---|
| 0000 UTC 11 Jan | Southwest Caribbean | 35 kts | 24 hr | West of Cold Front |
| 1800 UTC 15 Jan | Southwest Caribbean | 40 kts | 36 hr | Pressure Gradient |
| 0600 UTC 19 Jan | Southwest Caribbean | 35 kts | 72 hr | Pressure Gradient |
| 1200 UTC 28 Jan | Southwest Caribbean | 40 kts | 42 hr | Pressure Gradient |
Figure 6. The National Weather Service Unified Surface Analysis from 0000 UTC on 11 January 2010. Note the gale warning associated with the cold front along the eastern coast of Nicaragua and Costa Rica.
A few days later, as the aforementioned frontal boundary shifted eastward and positioned itself over the northeast Caribbean Sea, a relatively strong 1027 hPa surface high settled across the southwest North Atlantic producing enhanced easterly trade winds across the southwest Caribbean Sea. A gale warning was issued for an area of 30-40 kts of northeast winds within 240 nmi of the coast of northern Colombia. Two ships in the vicinity verified the warning: The Al Mareekh (HZGN) at 1800 UTC on 16 Jan was near 12.3N 78.0W and the Wehr Koblenz (V7DQ8) at 0300 UTC on 16 Jan was near 12.3N 74.4W. In addition, the edge of an ascending ASCAT pass across the warned area captured winds within the 30-35 kts range.
The longest warning period in the Caribbean Sea began at 0600 UTC 19 Jan and lasted for three days. Similar to the synoptic setup during the 15 Jan event, this gale period began with a 1021 hPa surface high centered over the northeast Gulf of Mexico that drifted eastward into the southwest North Atlantic. Once again, this provided an extended period of strong easterly trade winds in the range of 30-35 kts across the southwest Caribbean Sea south of 15N to the coast of Colombia between 70W and 77W. Figure 7 shows an example of the persistent surface pattern on the 0000 UTC 20 Jan NWS Unified Surface Analysis. The Coral Princess (ZCDF4), the Celebrity Millennium (9HJF9), and the MSC England (DEBN) reported 35 kts within the warning area.
Figure 7. The National Weather Service Unified Surface Analysis from 0000 UTC 20 January 2010. Note a persistent pattern of easterly trade winds across the Caribbean Sea between high pressure across the southwest North Atlantic and low pressure over northern Colombia.
The fourth and final Caribbean Sea gale warning issued by TAFB within the period occurred from 1200 UTC 28 Jan to 0600 UTC 30 Jan. Easterly trade winds again were strongest across central and southwest portions of the Caribbean Sea as a 1022-hPa surface high was positioned over the western Atlantic and remained centered west of 65W through the warning period. Four observing ships within the warned area, the Celebrity Constellation (9HJB9), the Celebrity Equinox (9HXD9), the Westerdam (PINX), and the MSC Carouge (DDJG2) reported winds of gale force.
| Onset | Region | Peak Wind Speed | Duration | Forcing |
|---|---|---|---|---|
| 1200 UTC 01 Jan | Western Gulf of Mexico | 35 kts | 12 hr | West of Cold Front |
| 0000 UTC 08 Jan | Western Gulf of Mexico | 40 kts | 48 hr | West of Cold Front |
| 0600 UTC 16 Jan | North-Central Gulf of Mexico | 40 kts | 18 hr | NE of Developing Low |
| 0600 UTC 30 Jan | Southwest Gulf of Mexico | 35 kts | 24 hr | West of Cold Front |
| 0600 UTC 05 Feb | Northeast Gulf of Mexico | 35 kts | 18 hr | SE of Developing Low |
| 1200 UTC 12 Feb | Northeast Gulf of Mexico | 40 kts | 12 hr | N of Developing Low |
| 0600 UTC 15 Feb | Northwest Gulf of Mexico | 35 kts | 24 hr | West of Cold Front |
| 0000 UTC 24 Feb | Southwest Gulf of Mexico | 40 kts | 36 hr | West of Cold Front |
| 0000 UTC 02 Mar | Northeast Gulf of Mexico | 35 kts | 12 hr | SE of Developing Low |
| 0000 UTC 21 Mar | Western Gulf of Mexico | 35 kts | 24 hr | West of Cold Front |
Two different synoptic patterns dominated many of the gale events across the Gulf of Mexico region during the winter of 2010. The first scenario, very common during the peak winter months, involved a cold front moving off the southeastern Texas coast and into the western Gulf of Mexico that produced gale-force northerly winds. One such event began 0000 UTC 8 Jan and lasted 48 hours, the longest Gulf of Mexico gale event of the four-month period. This event saw the strongest surface high pressure of the season, a 1038 hPa high centered near Corpus Christi, Texas, at 0600 UTC on 9 January. Several ships reported wind speeds in the 35 to 40 kts range within the warned area. Those ships were the Maersk Dartford (MRGU3), the Eagle Austin (S6TB), the British Osprey (MCCN6), and the Carnival Conquest (3FPQ9). Ultimately, this cold front moved eastward into the southwest North Atlantic with the surface ridge weakening over the next several days across the western Gulf of Mexico.
Another pattern that supported gale force winds featured cyclogenesis over the western Gulf of Mexico and subsequent tightening of the pressure gradient across the northeastern Gulf of Mexico in response to the developing low. One such gale force event began 0600 UTC 16 Jan and lasted 18 hours. The 1008 hPa surface low developed near Brownsville, Texas, and moved east-northeastward into the north-central Gulf of Mexico with gale-force winds located within the northeast quadrant of the low. Two ships, the Sea-land Eagle (WKAE) near 28.0N 86.4W at 0600 UTC on 16 Jan and the Norwegian Spirit (C6TQ6) near 25.8N 87.6W at 1500 UTC on 16 Jan reported wind speeds of 37 and 40 kts, respectively, during the event. Additionally, two surface observing sites reported gale force winds. The Louisiana State University - Coastal Studies Institute shore-based tower located near 28.9N 90.5W at 40.4 m above the surface reported wind speeds of 38-41 kts between 0400 UTC and 0600 UTC on 16 January and the Shell Oil Station Mars Tension Leg Platform (42363) near 28.2N 89.2W at an elevation of 122 m, reported similar wind speeds from 0730 UTC to 1330 UTC on 16 January. By the end of the winter season, four gale events in the north central and northeastern Gulf of Mexico were attributable to deepening low pressure systems with a similar synoptic pattern.
Tropical Eastern Pacific Gale and Storm Warnings
| Onset | Region | Peak Wind Speed | Duration | Forcing |
|---|---|---|---|---|
| 1800 UTC 01 Jan | Tehuantepec | 50 kts | 141 hr | |
| 1800 UTC 08 Jan | Tehuantepec | 55 kts | 138 hr | |
| 1800 UTC 10 Jan | Papagayo | 45 kts | 42 hr | Cold front |
| 0000 UTC 15 Jan | Gulf of California | 35 kts | 06 hr | Pres gradient |
| 0600 UTC 17 Jan | Tehuantepec | 35 kts | 12 hr | |
| 0600 UTC 19 Jan | NW AOR | 35 kts | 12 hr | Cold front |
| 0600 UTC 20 Jan | NW AOR | 45 kts | 72 hr | Cold front |
| 0600 UTC 26 Jan | Tehuantepec | 35 kts | 42 hr | |
| 0600 UTC 31 Jan | Tehuantepec | 40 kts | 36 hr | |
| 1800 UTC 03 Feb | NW AOR | 35 kts | 18 hr | Cold Front |
| 1800 UTC 09 Feb | ITCZ trough | 35 kts | 42 hr | Pres gradient |
| 0600 UTC 10 Feb | Tehuantepec | 45 kts | 24 hr | |
| 0000 UTC 13 Feb | Tehuantepec | 40 kts | 24 hr | |
| 0600 UTC 16 Feb | Tehuantepec | 40 kts | 54 hr | |
| 0000 UTC 25 Feb | Tehuantepec | 45 kts | 21 hr | |
| 1200 UTC 27 Feb | Tehuantepec | 50 kts | 30 hr | |
| 0000 UTC 03 Mar | Tehuantepec | 40 kts | 18 hr | |
| 0000 UTC 07 Mar | N AOR | 35 kts | 06 hr | Cold front |
| 0600 UTC 17 Mar | Tehuantepec | 45 kts | 42 hr | |
| 1800 UTC 21 Mar | Tehuantepec | 45 kts | 42 hr | |
| 0600 UTC 29 Mar | Tehuantepec | 45 kts | 30 hr | |
The evolution of the El Nino event across the eastern Pacific brought differing weather regimes to the AOR as the months progressed through the 2010 winter season. During January, a strong westerly upper level jet stream sank farther south than is typical during non El Nino years, creating a jet at mid latitudes (Figure 8), which brought frequent clipper like cold fronts sweeping eastward across northwest portions of the TAFB AOR (Figure 9). Gale force winds were associated with two of these cold frontal systems in mid January, and then another again on 3 February.
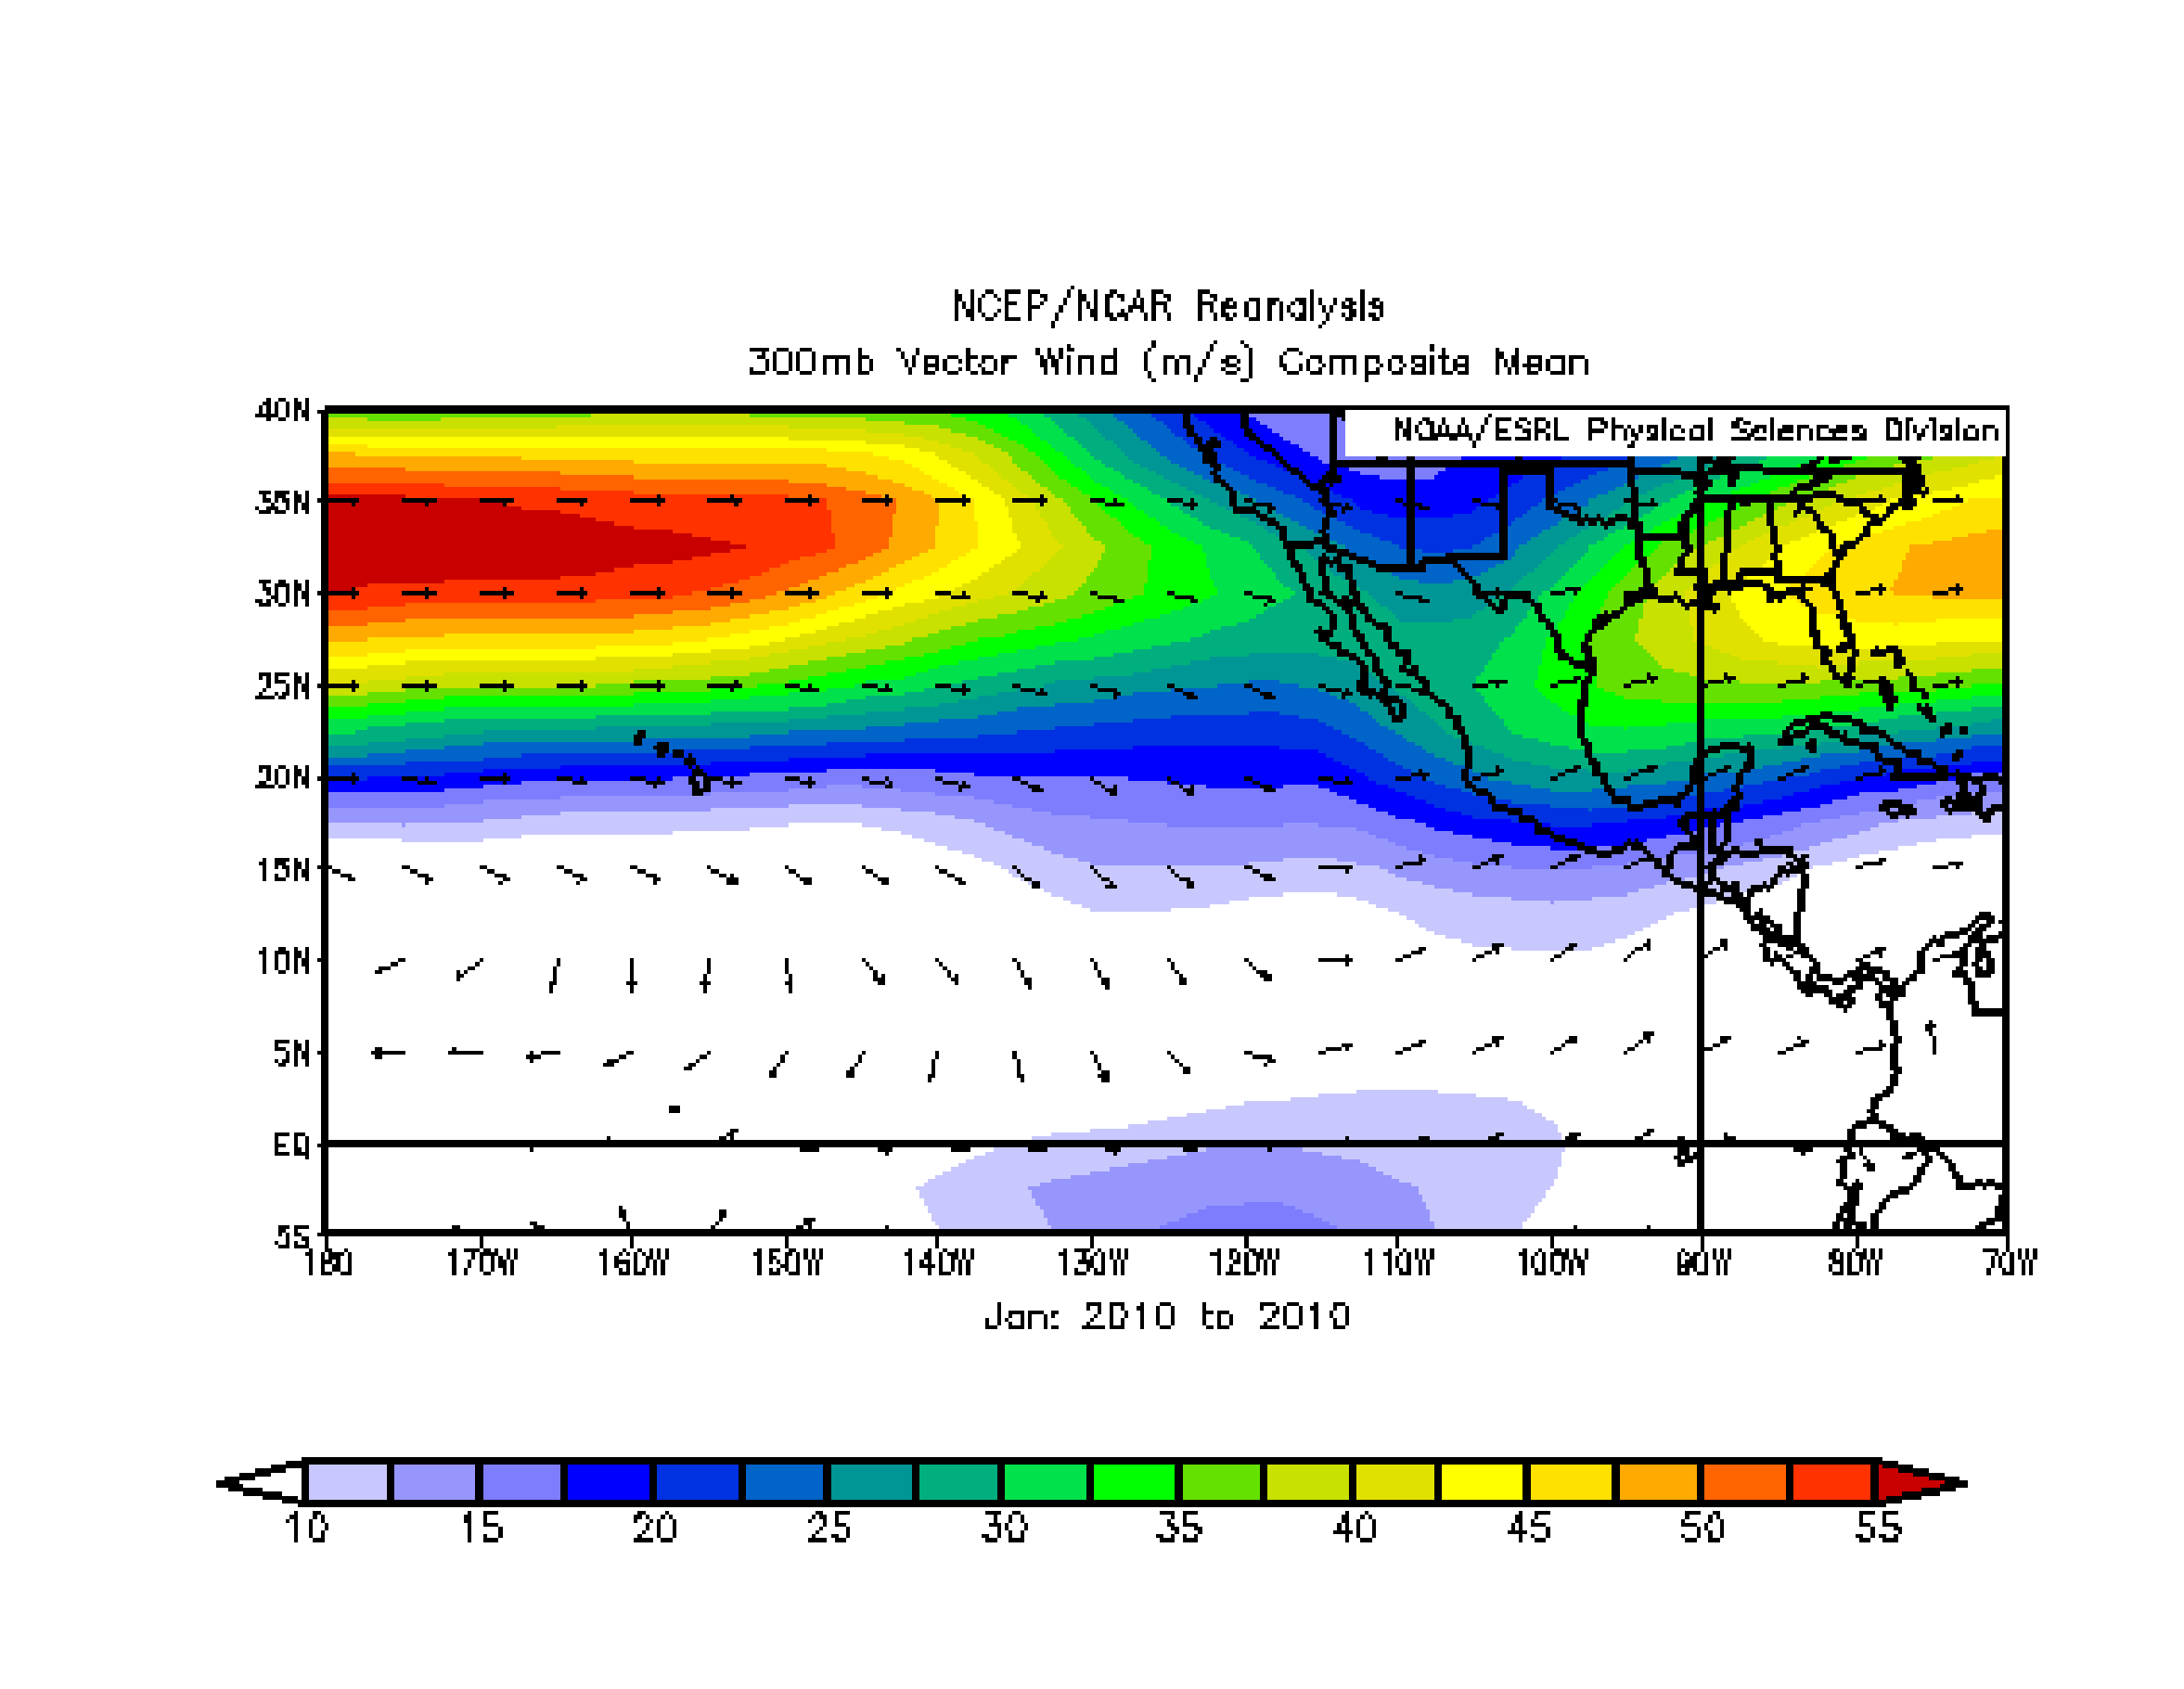
Figure 8. NCEP/NCAR Reanalysis of January 2010 mean 300 hPa winds. Note the strong westerly jetstream along 30-35N.
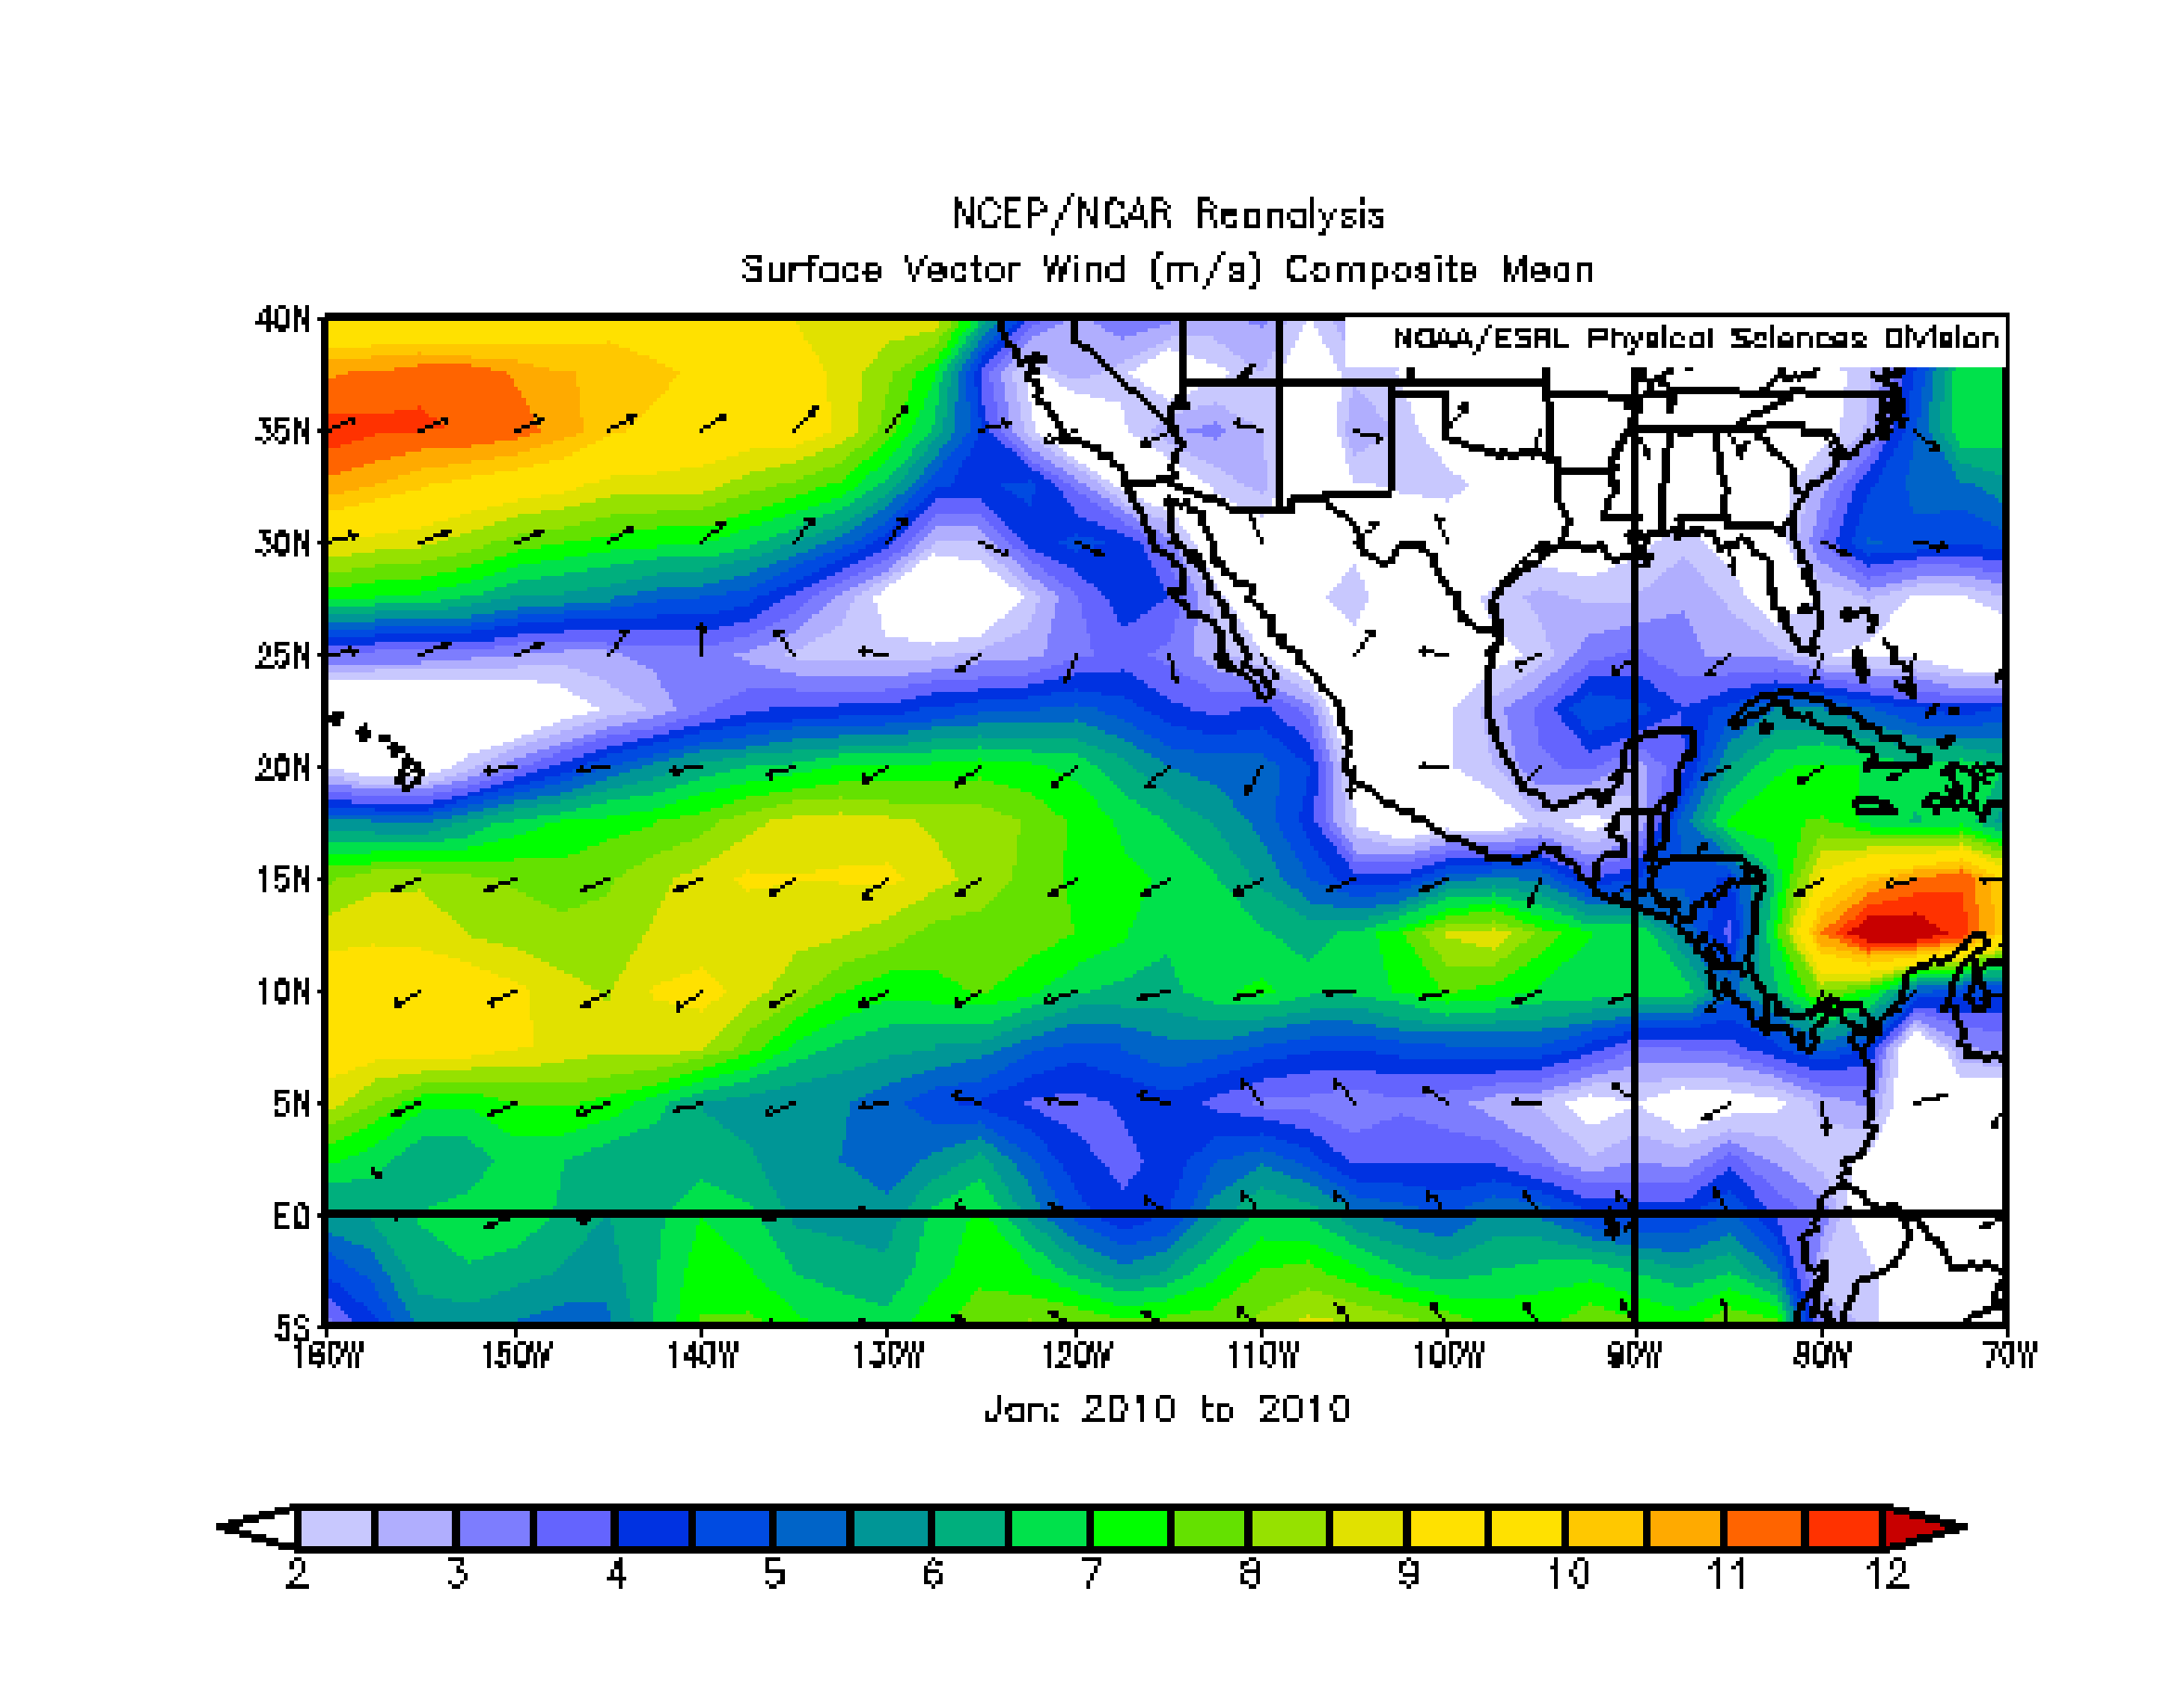
Figure 9. NCEP/NCAR Reanalysis of January 2010 mean surface winds. Note the fresh to strong W-SW winds along 35N almost directly coincident with the January jetstream.
Two long lived gap wind events through the Gulf of Tehuantepec kept gale force winds and higher going for almost two consecutive weeks from 1 through 14 January, with winds briefly reaching storm force twice during this period. During the first extended period of gales from 1 through 7 January, Stuttgart Express (DGBE) reported winds at 48 kts on Jan 6 at 1600 UTC. Maximum winds measured by ASCAT revealed only 45 kts. During the second extended Tehuantepec event, a 1534 UTC ASCAT pass on 10 January showed a significant area of 45 kts, (Figure 10) while later at 2100 and again at 2300 UTC Island Princess (ZCDG4) reported 64 kts. Based on recent history of this vessels wind observations, it appeared that these reports were likely around 10% high, and maximum analyzed winds were held at 55 kts. One very brief gale event occurred in the Gulf of California associated with a cold frontal passage on 15 January, while the lone gale event documented through the Gulf of Papagayo occurred from 10 through 14 January, with peak winds of 45 kts.
Figure 10. The National Weather Service Unified Surface Analysis from 1800 UTC on 10 January 2010, ship and buoy observations, and ASCAT passes between 1348 and 1712 UTC. Note the plume of strong winds flowing south and southwest out of Tehuantepec.
February saw a mean pattern shift to a strong southern stream upper level jet, typical of El Nino years, generally prevailing from southwest of Baja California northeastward across central Mexico and continuing northeastward across the Gulf of Mexico. This upper pattern helped to maintain a weak and narrow surface high pressure ridge across northwest portions of the AOR (Figure 11), which helped to initiate a series of 6 Tehuantepec gale events, typically lasting less than 48 hours, between 10 February and 3 March. The alignment of this high pressure ridge in February also maintained fresh northeasterly trade winds of 20-25 kts north of the ITCZ across southwest portions of the AOR. Several long lived perturbations developed along the ITCZ and moved westward during this time, with a 0600 UTC ASCAT pass on 9 Feb indicating minimal gales across northwest portions of a trough along 123W. Gales with this perturbation persisted through 1200 UTC on 11 February.
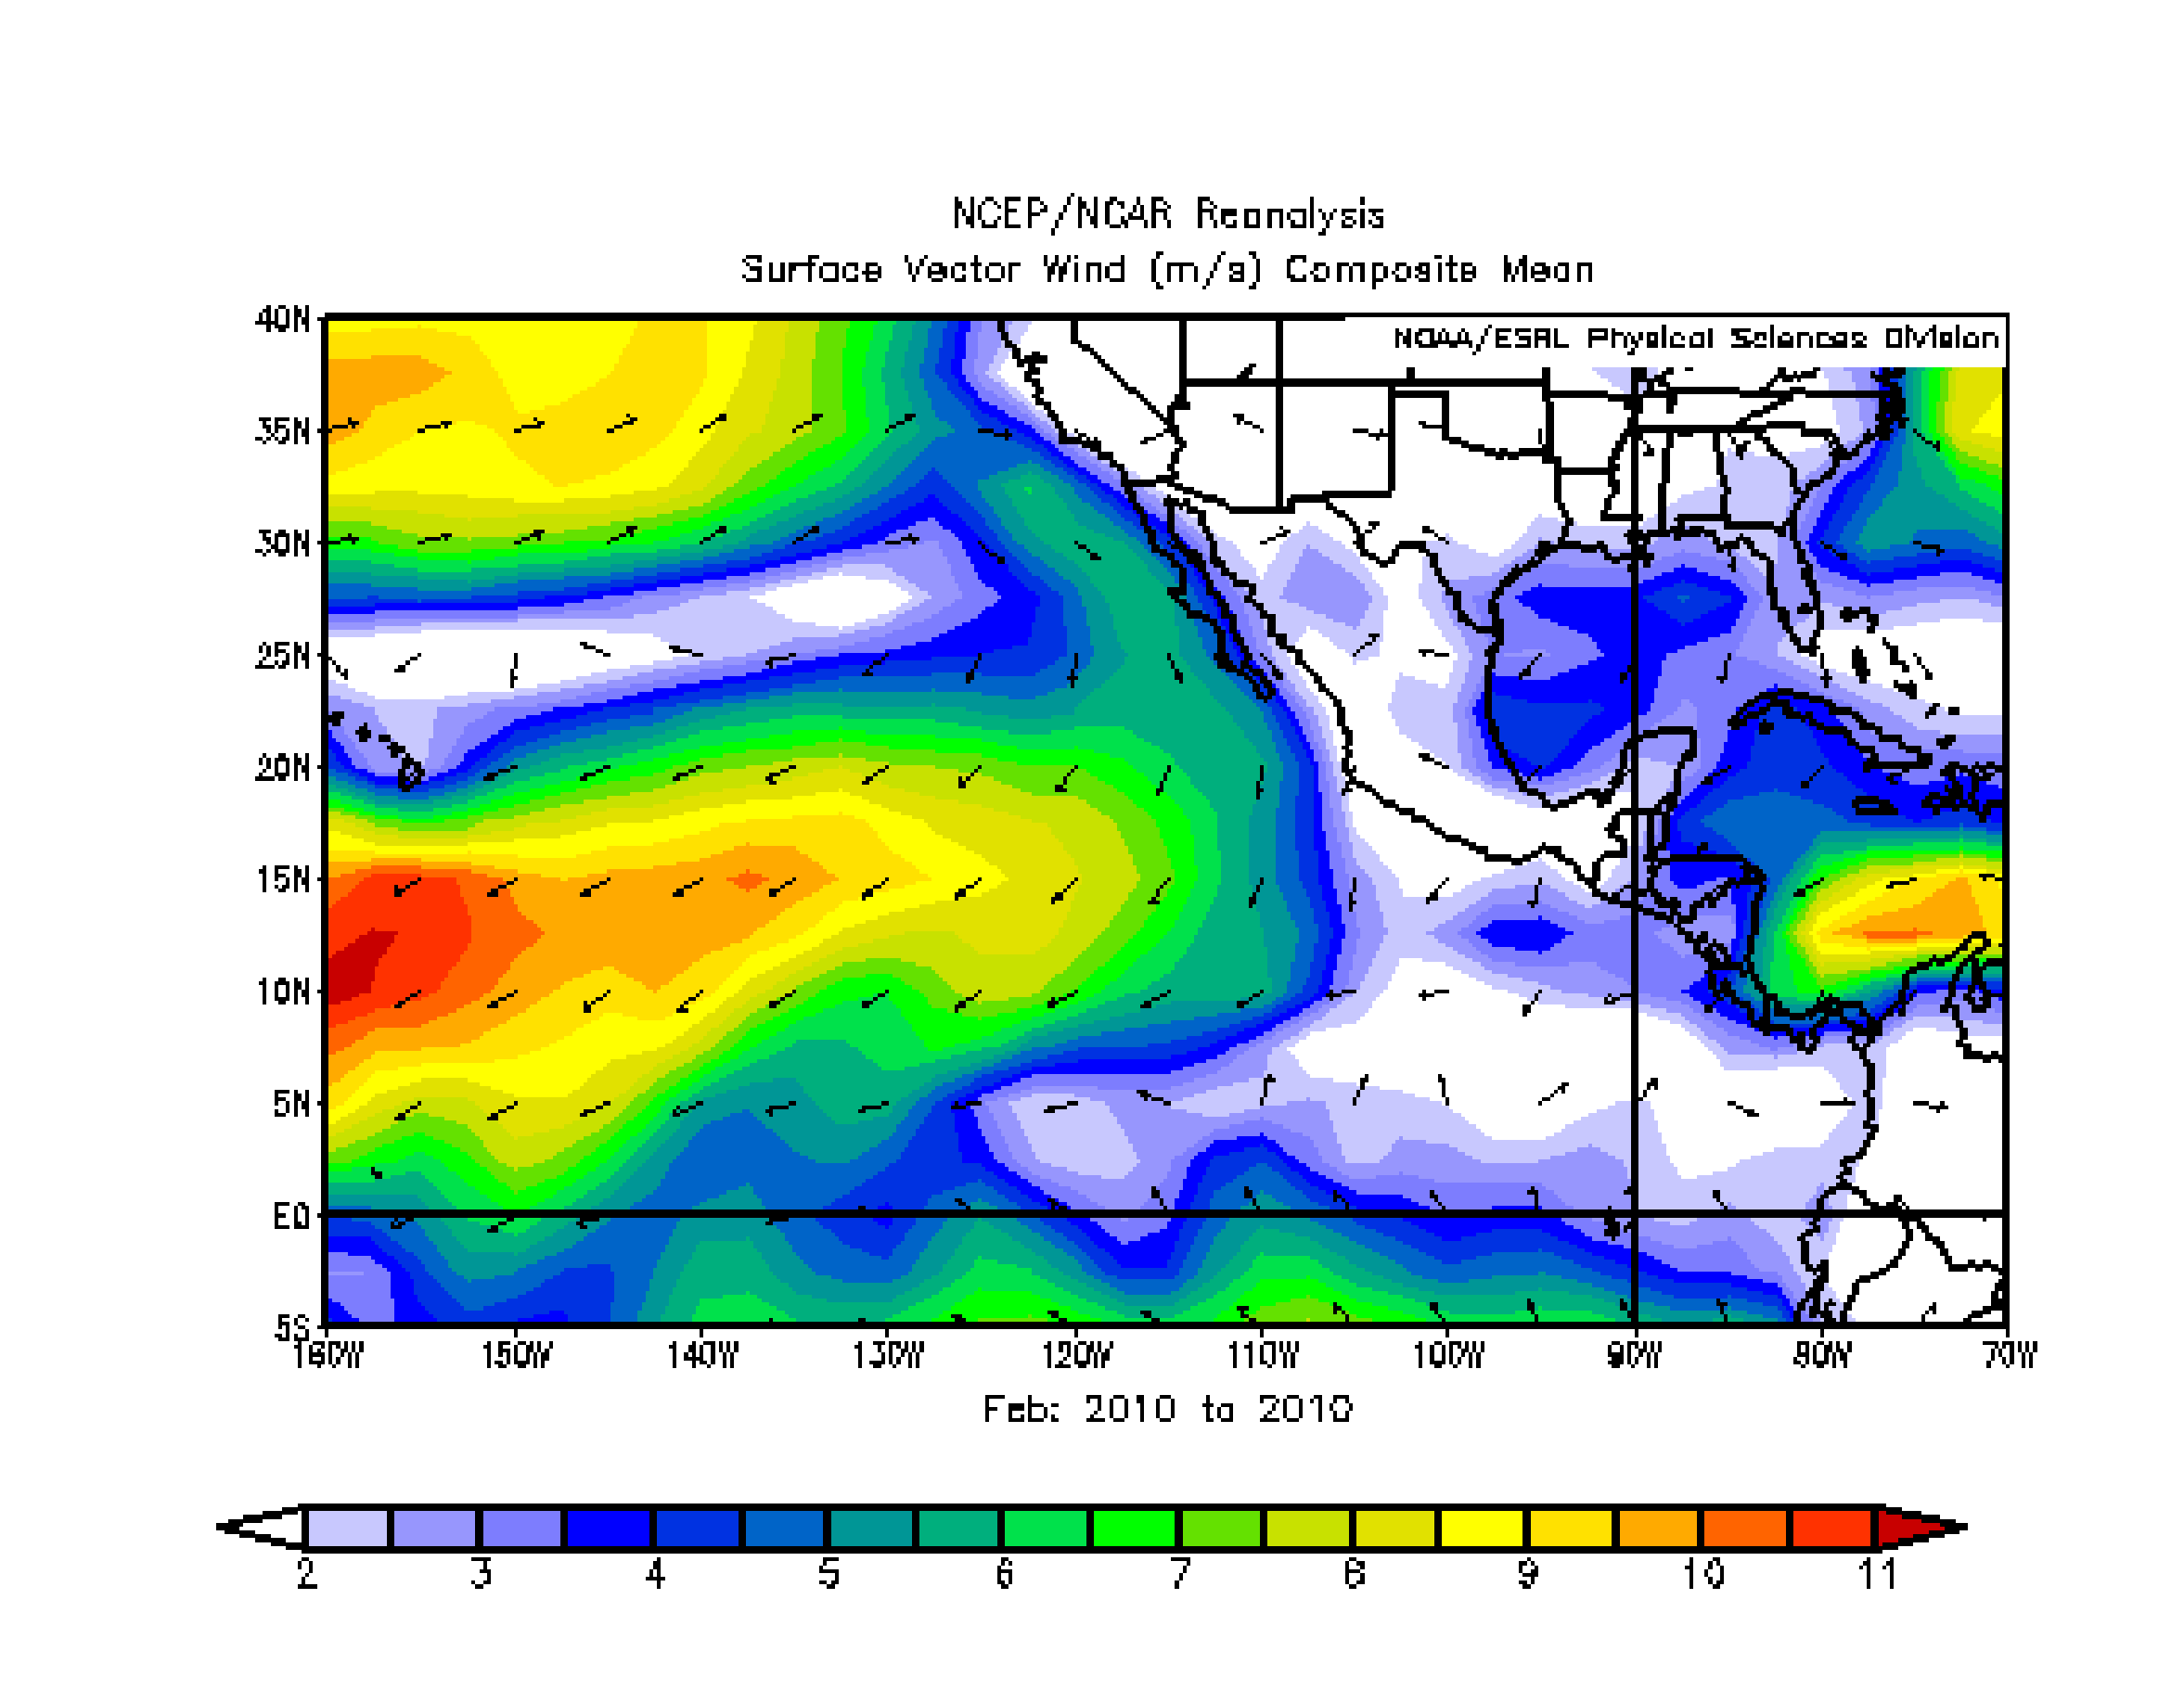
Figure 11. NCEP/NCAR Reanalysis of February 2010 mean surface winds. Note large area of fresh to strong northeast winds south of 20N and west of 115W.
El Nino moved into full maturation during March, with very warm SSTs across the tropical eastern Pacific helping to maintain large areas of strong thunderstorm activity. The southern stream upper jet became more west to east aligned, from the Hawaiian Islands east northeastward into the north half of Mexico and across the Gulf of Mexico. The resulting surface pressure pattern produced a weak ridge across northwest portions of the area, just north of 30N. This pattern allowed the fresh northeast trade winds to persist across SW sections of the AOR north of the ITCZ, and produced frequent episodes of fresh northwesterly winds along the coast of central California extending south to the west coast of the Baja Peninsula (Figure12). Cold frontal systems moving into the Gulf of Mexico during the latter half of the month induced three gale force gap wind events through Tehuantepec, all of which lasted less than 48 hours. Although there was little significant pattern change through mid April, there were no additional gale events during the entire month.
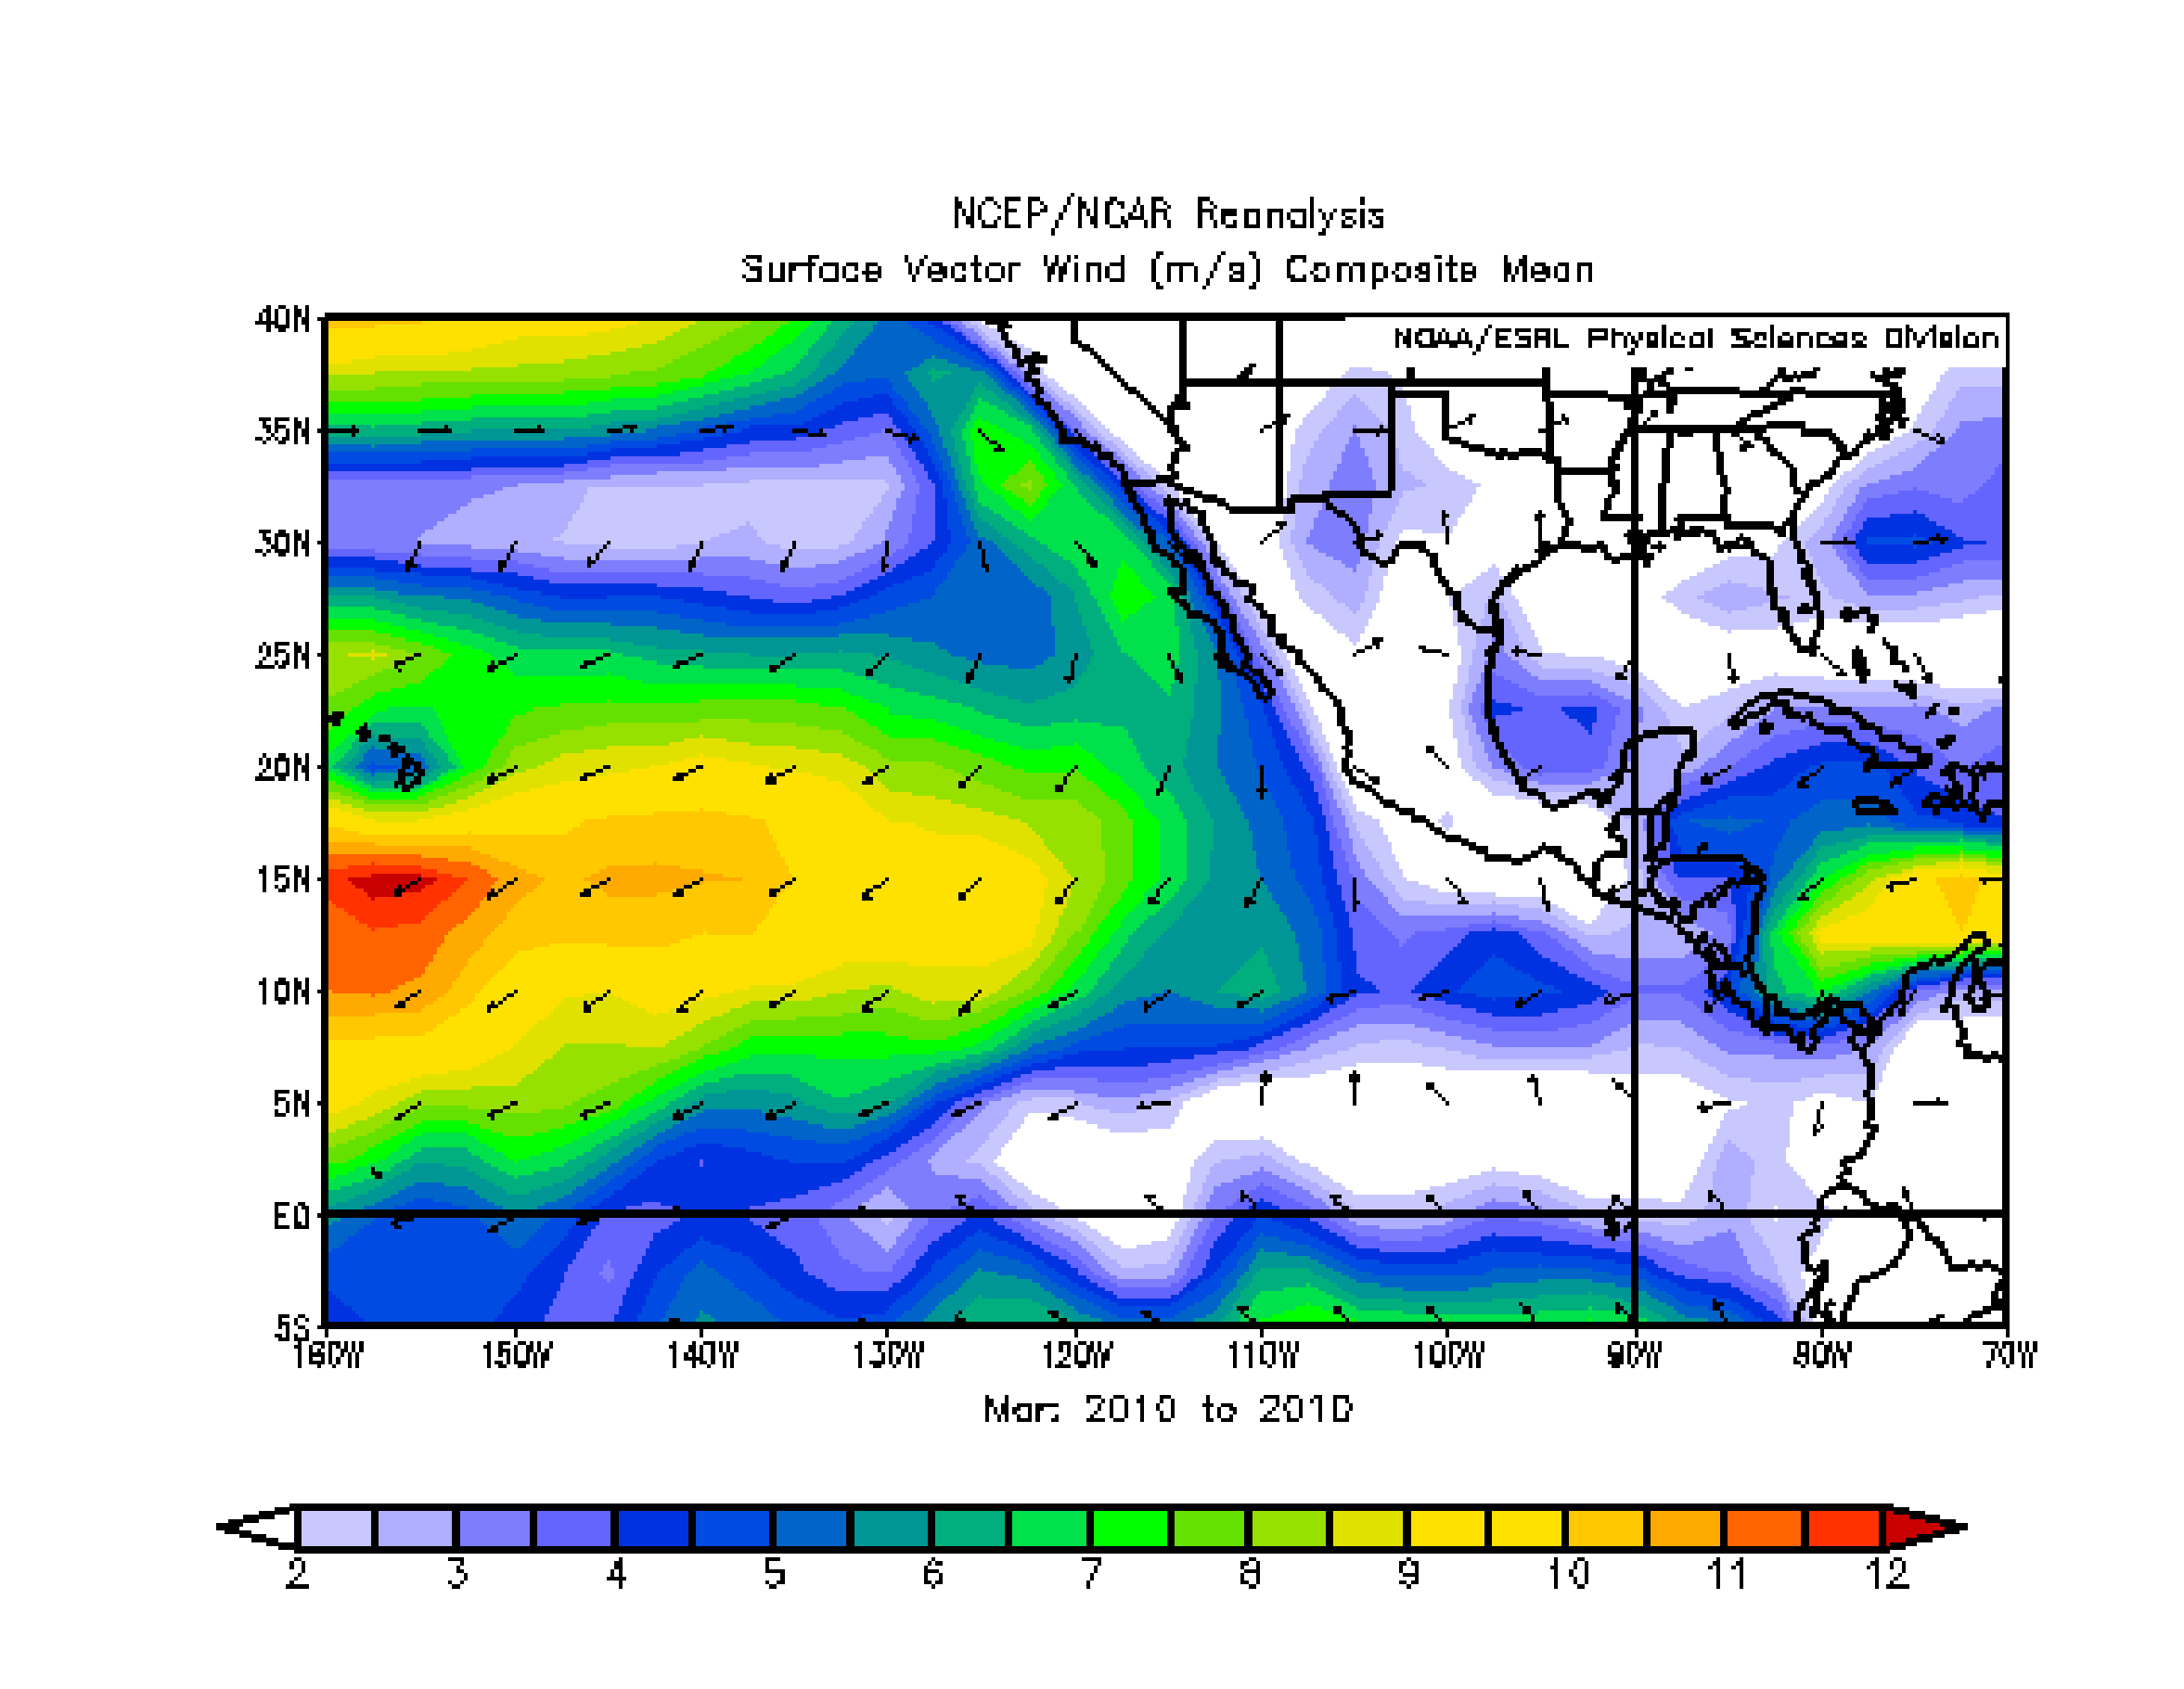
Figure 12. NCEP/NCAR Reanalysis of March 2010 mean surface winds. Note large area of fresh to strong northeast winds persisting south of 22N and west of 115W and the increase in northwest winds from along the central California to Baja California coasts.
Possible Impact on TAFB Storm Warnings Due to Loss of QuikSCAT
A 10 year climatology of Gulf of Tehuantepec gap wind events (Brennan et al. 2010 Wea. Forecasting ) indicates that an average winter season yields 6 to 8 storm force wind events. The 2010 winter season produced only 3 verified storm events in the Gulf of Tehuantepec, based strictly on ship observations. TAFB marine forecasters rely heavily on ship observations and scatterometer winds for forecast verification. Typically only one ASCAT pass can be expected across a region per day, as compared to two QuikSCAT passes per day. Additionally, the QuikSCAT footprint was considerably wider spatially than ASCAT. Was this reduced number of storm events in the Gulf of Tehuantepec during the winter of 2010 due to loss of reliable scatterometer data, a result of synoptic weather pattern changes, or some combination of both?
References
Brennan, M.J., H.D. Cobb, III, and R.D. Knabb, 2010: Observations of Gulf of Tehuantepec Gap Wind Event s f rom QuikSCAT: An Updated Event Climatology and Operational Model Evaluation. /Wea. Forecasting/, *25*, 666-678.
Back to top