Marine Weather Review North Atlantic Area January to April 2009
By George P. Bancroft NOAA National Center for Environmental Prediction
Introduction
The period from January into March was marked by frequent passage of intense cyclones tracking from the U.S. East Coast or Canadian Maritime Provinces in the general direction of northwestern Europe and Iceland, mainly avoiding the Davis Strait and the southeastern waters off Portugal and North Africa. January weather was a continuation of December 2008s busy pattern. If one includes the two hurricane force lows present at the start of January but which originated in late December there were twelve hurricane force cyclones in January alone. In a study done for the period October 2001 to April 2004 hurricane force cyclones were observed to have the highest frequency in the North Atlantic in January (Reference 1). The numbers of such cyclones dropped to 5 and 6 in February and March, respectively. The pattern was more variable in April as some cyclones turned north into the Davis Strait, stalled near Greenland or dropped southeast toward Europe. April produced two hurricane force lows, one of them a Greenland event and the second, at the end of the month, an intense North Atlantic cyclone. The more intense systems with central pressures below 950 hPa occurred in January, the stormiest month. Like in previous cases the North Atlantic produced more intense lows (in terms of central pressure) than the North Pacific, and also this four month period saw more hurricane force cyclones in the Atlantic than in the Pacific.
There was no tropical activity in the North Atlantic during this four month period. The Atlantic hurricane season officially begins June 1.
Significant Events of the Period
Western North Atlantic Storm, December 31-January 3: Figure 1 depicts two ongoing hurricane force systems at the start of January. The eastern system southeast of Newfoundland shown in the first part of Figure 1 originated in late December and is described in a preceding article (Reference 3). The other, a coastal redevelopment, deepened rapidly as it moved offshore with the central pressure dropping 29 hPa during this twenty four hour period. The maximum intensity, 964 hPa, was reached at 1800 UTC January 1, before the system turned north across Newfoundland and began to weaken. The buoy 44137 (42.2N 62W) reported west winds of 51 kts with gusts to 64 kts and seas 5.5 m (18 ft) at 1000 UTC on the 1st and highest significant wave height of 9.0 m (30 ft) ten hours later. The buoy 44024 (42.3N 66.0W) reported at 1100 UTC that day northwest winds of 37 kts and gusts to 76 kts with seas 6.0 m (20 ft) followed by highest seas 8.0 m (26 ft) six hours later. Buoy 44141 (43N 58W) reported southwest winds of 45 kts with gusts to 56 kts and seas 6.5 m (21 ft) at 1400 UTC on the 1st, followed four hours later by maximum seas of 9.0 ms (30 ft). Thebaud (CFO383, 43.9N 60.2W),a fixed platform, reported southwest winds of 49 kts with gusts to 63 kts and seas 6.5 m (21 ft) at 1800 UTC on the 1st followed three hours later by highest seas of 7.5 m (25 ft). The ship SFIR (42N 64W) encountered northwest winds of 55 kts at 1200 UTC on the 1st. The cyclone subsequently looped back to the southwest to the Gulf of St. Lawrence by the 4th before becoming absorbed by another cyclone passing near the island of Newfoundland by January 5.
North Atlantic Storm, January 8-11: The next storm moved northeast from the Gulf of Maine early on the 8th and moved out over the North Atlantic toward Iceland as a hurricane force low as depicted in Figure 2. The lowest central pressure was 956 hPa at 0000 UTC on the 10th when the center was at 60N 31W. QuikSCAT wind imagery revealed south to southwest winds to 65 kts ahead of the cyclones frontal system as it approached northern Great Britain and the Norwegian Sea. The cyclone quickly passed north of Iceland by the 11th. The most notable ship and buoy observations taken during this storm are listed in Table 1.
North Atlantic Storm, January 9-13: The next cyclone followed close behind its predecessor and appears in Figure 2, still inland over the eastern U.S. in the first part and passing over the Grand Banks in the second part. The cyclone developed hurricane force winds while passing southeast of Newfoundland at 0000 UTC on the 10th and maintained such winds out over the North Atlantic up until 0000 UTC on the 11th , when the cyclone passed near 53N 33W with a lowest pressure of 961 hPa. Winds in a swath south and southeast of the center reached 75 kts as observed by QuikSCAT imagery late on the 10th, similar to Figure 4 for a later event. The cyclone subsequently re-formed northeast in the Norwegian Sea on the 12th before going inland over Norway on the 13th. Selected ship, buoy and platform reports taken during the event are listed in Table 2.
Northeastern Atlantic Storm, January 13-16: Low pressure originating in the south central waters near 43N 47W early on the 13th rapidly developed while heading northeast and developed hurricane force winds by 1200 UTC on the 14th when the center passed near 52N 22W with a 970 hPa central pressure. High resolution QuikSCAT imagery revealed strongest winds up to 65 kts on the south and southwest sides of the storm center near this time. Some notable ship reports taken in this storm are listed in Table 3. The cyclone attained a maximum intensity of 965 hPa at 1800 UTC on the 14th while passing west of Ireland before turning north, with its strongest winds weakening to storm force on the 15th. It then passed north of Iceland on the 16th.
North Atlantic Storm, January 14-17: The rapid development of this cyclone over a thirty-six hour period is shown in Figure 3. Two lows, one inland and the other offshore, merged to form an intense 948 hPa low as shown in the second part of Figure 3. The most rapid deepening occurred in the twenty-four hour period ending at 0000 UTC on the 15th when the pressure fell 41 hPa. The lowest pressure was 947 hPa at 1200 UTC on the 16th as the system was turning east. Figure 4 is a scatterometer image taken earlier on the 15th when the cyclone was rapidly deepening, with maximum winds from the west to southwest up to 80 kts, plus east winds to 60 kts appearing north of the center. The ship VRXL7 (43N 58W) reported west winds of 50 kts and seas 11.5 m (37 ft) while the Atlantic Concert (SKOZ) at 44N 56W encountered west winds of 55 kts, at 0000 UTC on the 15th. The buoy 44251 (46.5N 53.4W) at 0200 UTC on the 15th reported west winds of 39 kts with gusts to 51 kts and seas 6.5 m (21 ft), and maximum seas 7.0 m (23 ft) six hours later. Hibernia Platform (VEP717, 46.7N 48.8W) reported west winds of 70 kts at 0300 UTC on the 15th preceded six hours earlier by south winds to 75 kts and seas 4.0 m (13 ft). The GSF Grand Banks (YJUF7, 46.8N 48W) at 0900 UTC on the 15th reported west winds of 50 kts and seas 8.0 m (27 ft) and at 2100 UTC on the 14th south winds of 60 kts. Figure 5 shows the cyclone weakening while moving along 57N but retaining hurricane force winds into January 17 before it became absorbed by the other hurricane force low passing north along 10N, to be described next.
| Observation | Position | Date/Time (UTC) | Wind | Seas (m/ft) |
|---|---|---|---|---|
| A8EH5 | 49N 37W | 09/1200 | W 50 | 7.5/25 |
| BATFR04 | 59N 3W | 10/1300 | S 50 | |
| OZ2048 | 60N 10W | 10/2100 | SW 50 | |
| Hibernia Platform (VEP717) | 46.7N 48.7W | 09/0300 | SW 50 | |
| Buoy 64045 | 59.2N 11.5W | 10/0200 10/1800 |
S 40 | 9.0/29 maximum 10.5/35 |
| Buoy 64046 | 60.6N 4.8W | 10/1100 10/1300 |
SW 40 | 8.5/28 maximum 9.5/31 |
| Buoy 63115 | 61.6N 1.3E | 10/1700 | SW 40 | 10.0/32 |
| Buoy 62159 | 60.5N 1.8E | 10/1200 | S 55 | 5.5/18 |
| Buoy 63118 | 59.3N 1.7E | 10/1200 | SW 65 | 8.5/28 |
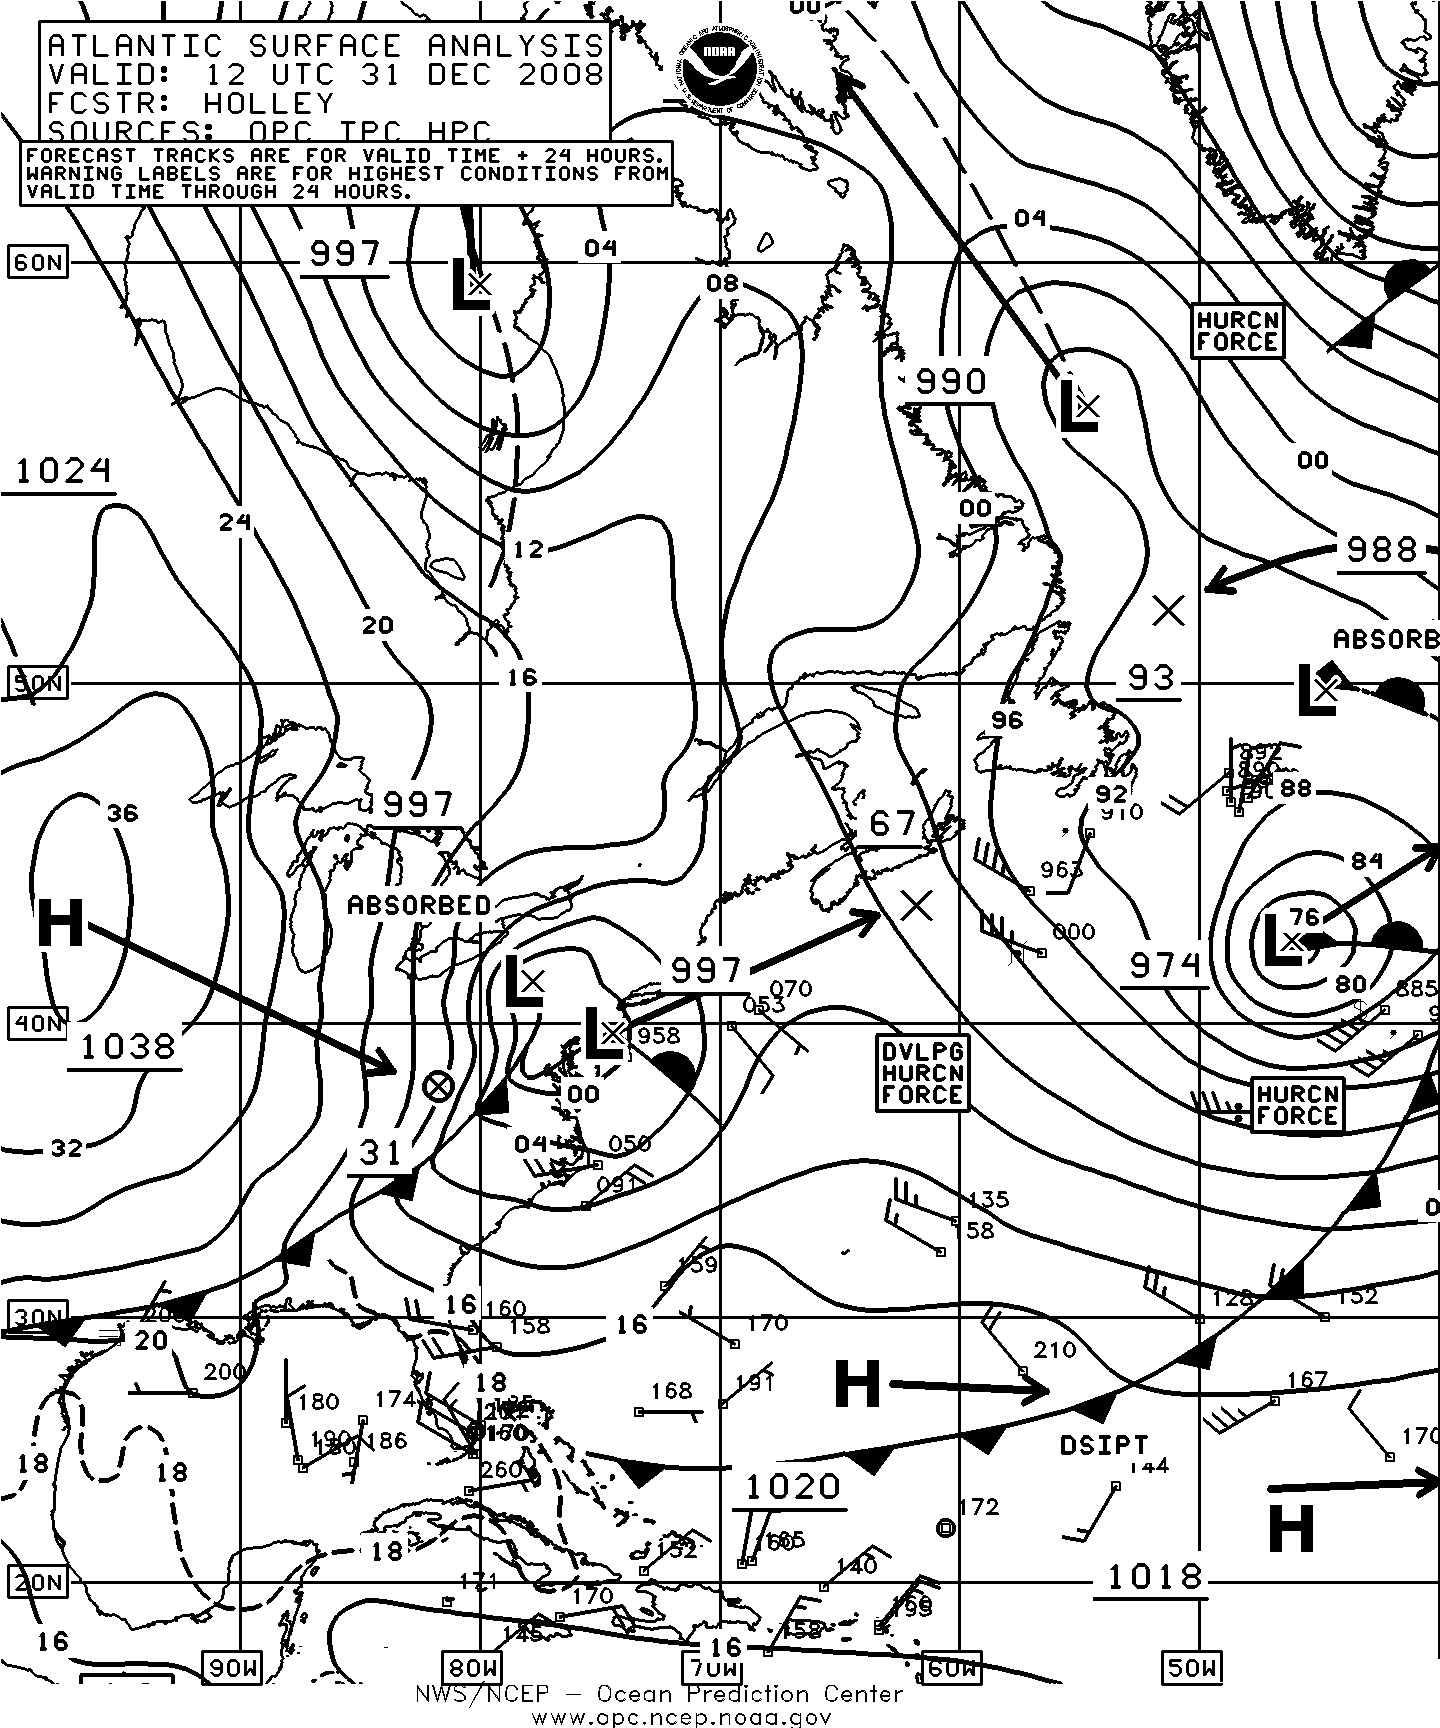
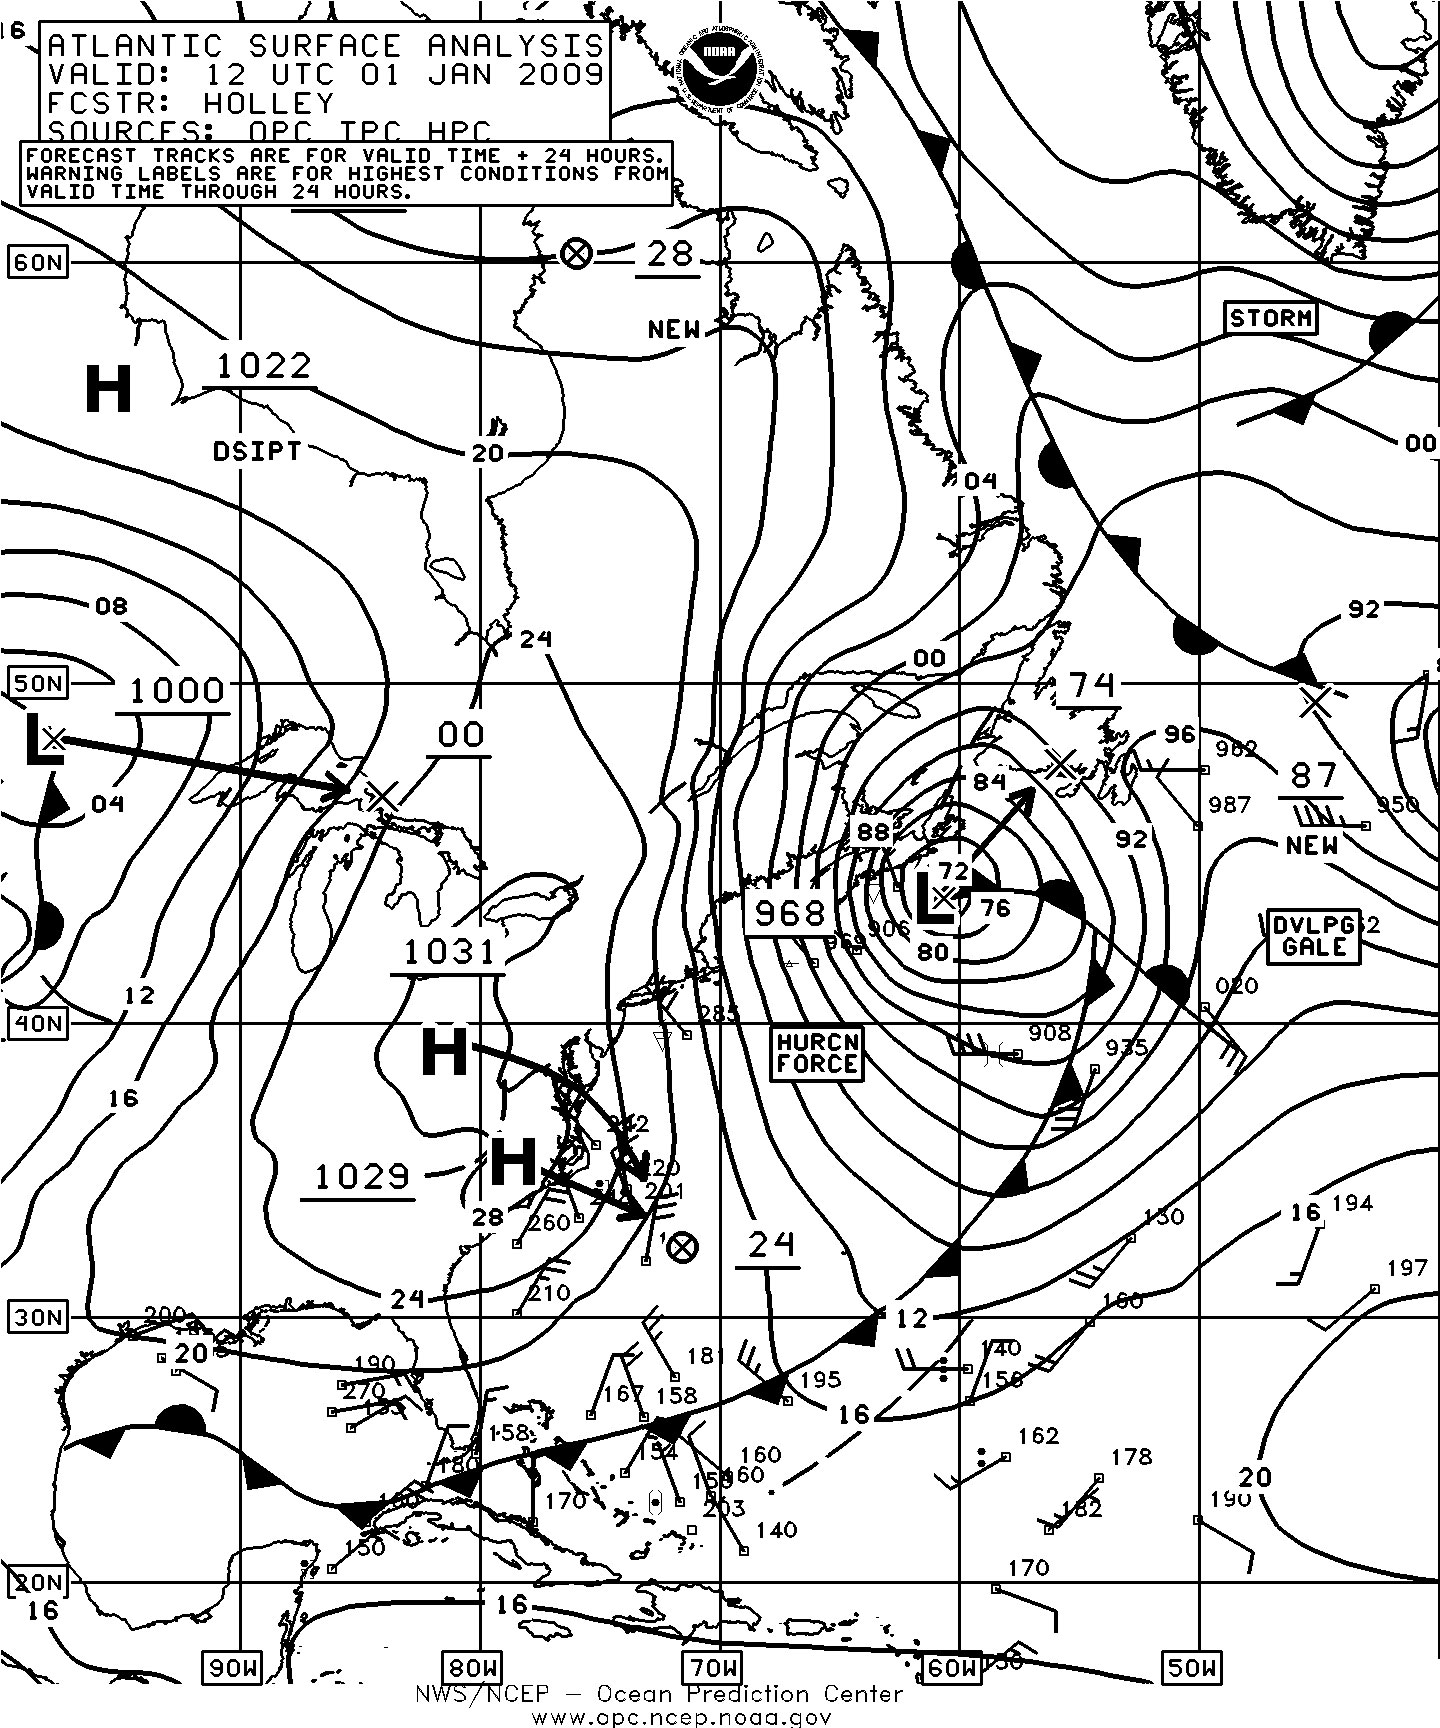
Figure 1. OPC North Atlantic Surface Analysis charts (Part 2 - west) valid 1200 UTC December 31, 2008 and 1200 UTC January 1, 2009 (Click to enlarge)
| Observation | Position | Date/Time (UTC) | Wind | Seas (m/ft) |
|---|---|---|---|---|
| WDC6925 | 39N 66W | 10/0600 | NW 50 | |
| SeaLand Performance (KRPD) | 48N 43W | 10/1200 | SW 55 | 8.5/28 |
| A8EH5 | 47N 41W | 10/1200 | SW 60 | 14.5/49 |
| A8FZ5 | 52N 30W 53N 32W |
10/1800 11/0600 |
SW 40 NW 40 |
9.0/30 10.5/35 |
| 3FUO7 | 48N 43W | 10/1800 | NW 40 | 9.5/31 |
| GSF Grand Banks (YJUF7) | 46.8N 48W | 10/0900 | NW 50 | |
| Buoy 44753 | 45N 45.6W | 10/1100 | W 50 | |
| Buoy 62081 | 51N 13.4W | 12/0200 | SW 20 | 10.0/33 |
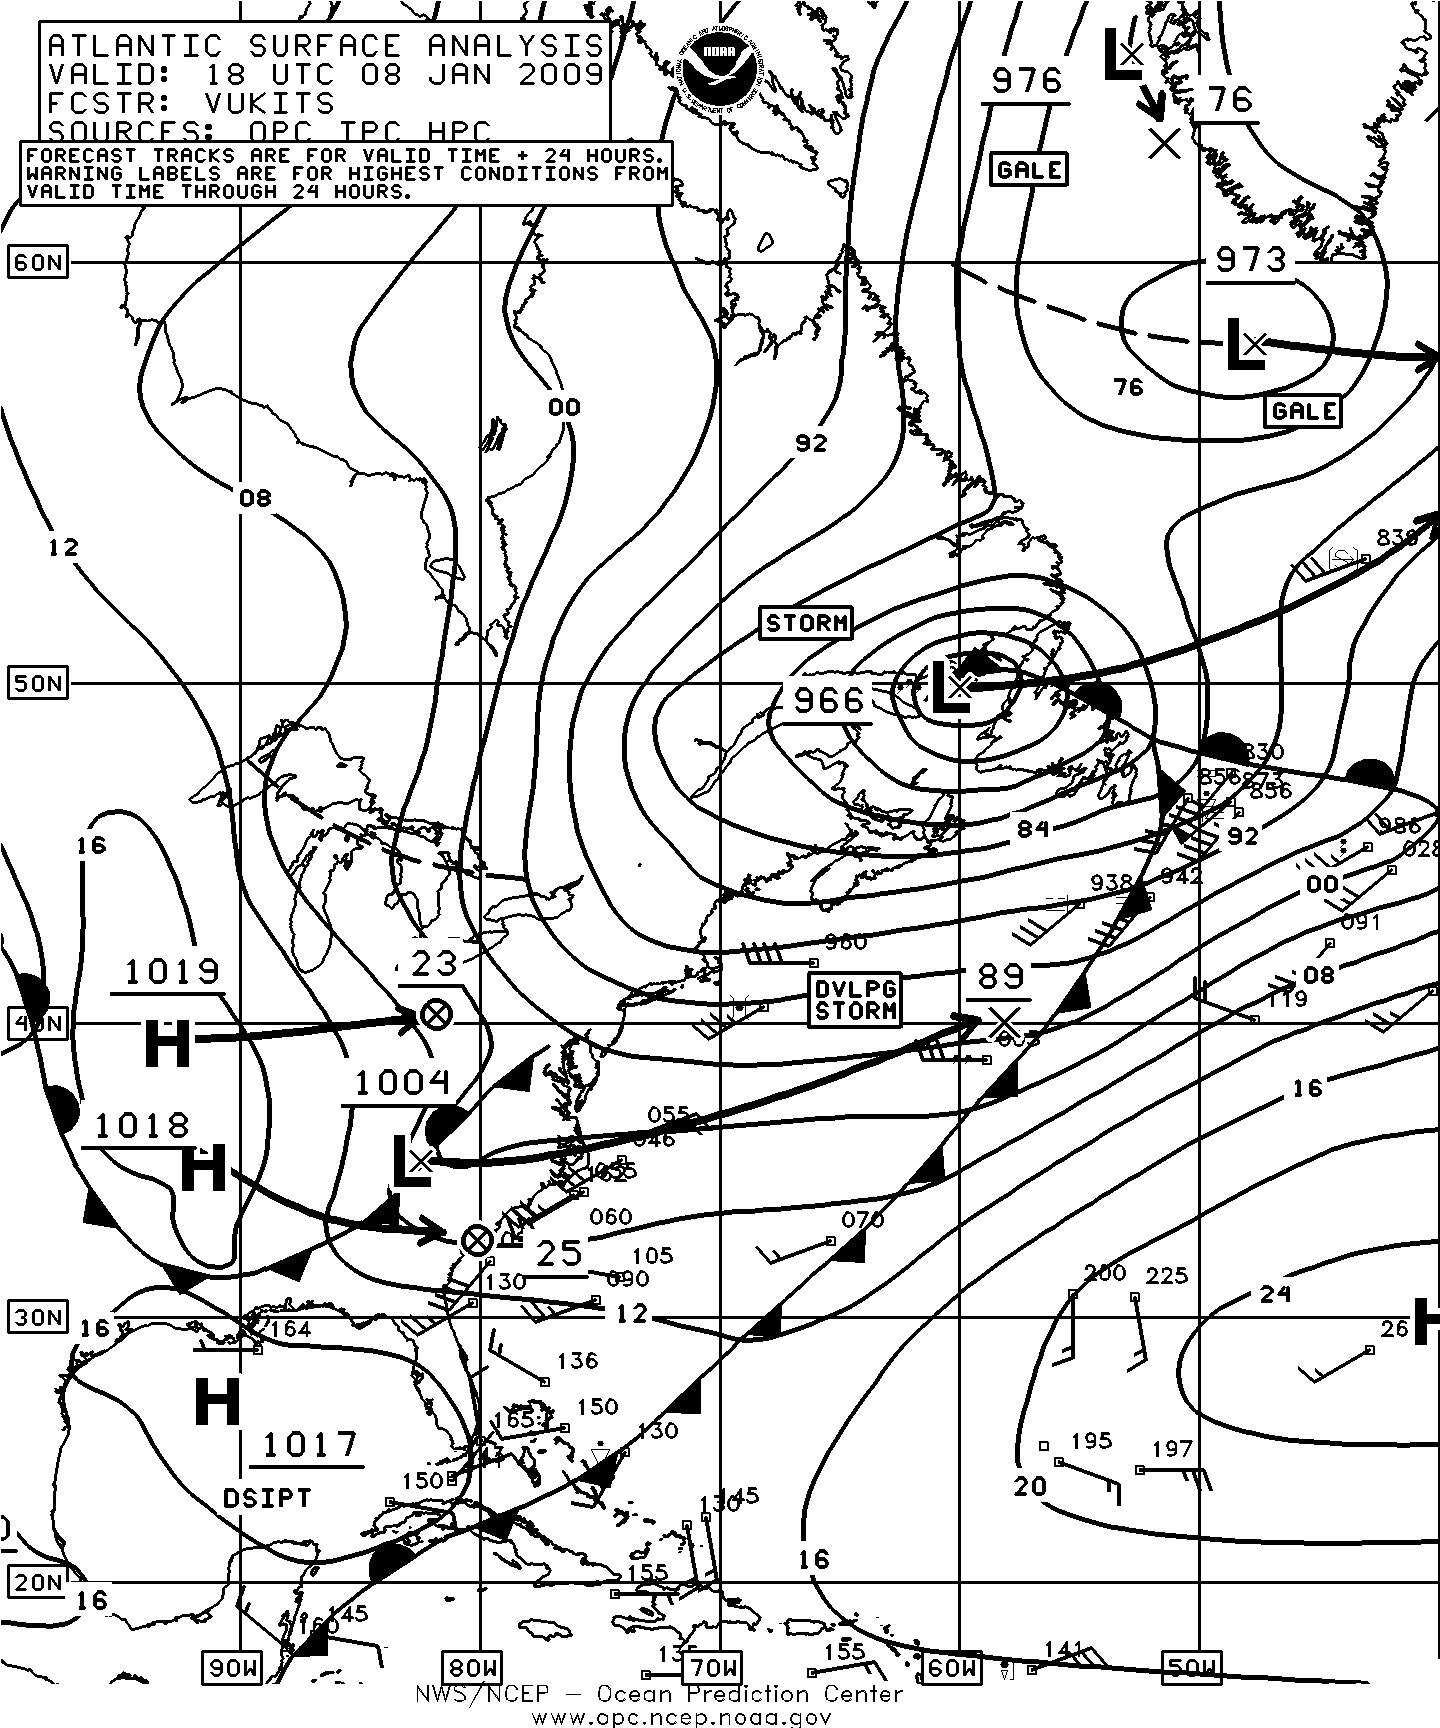
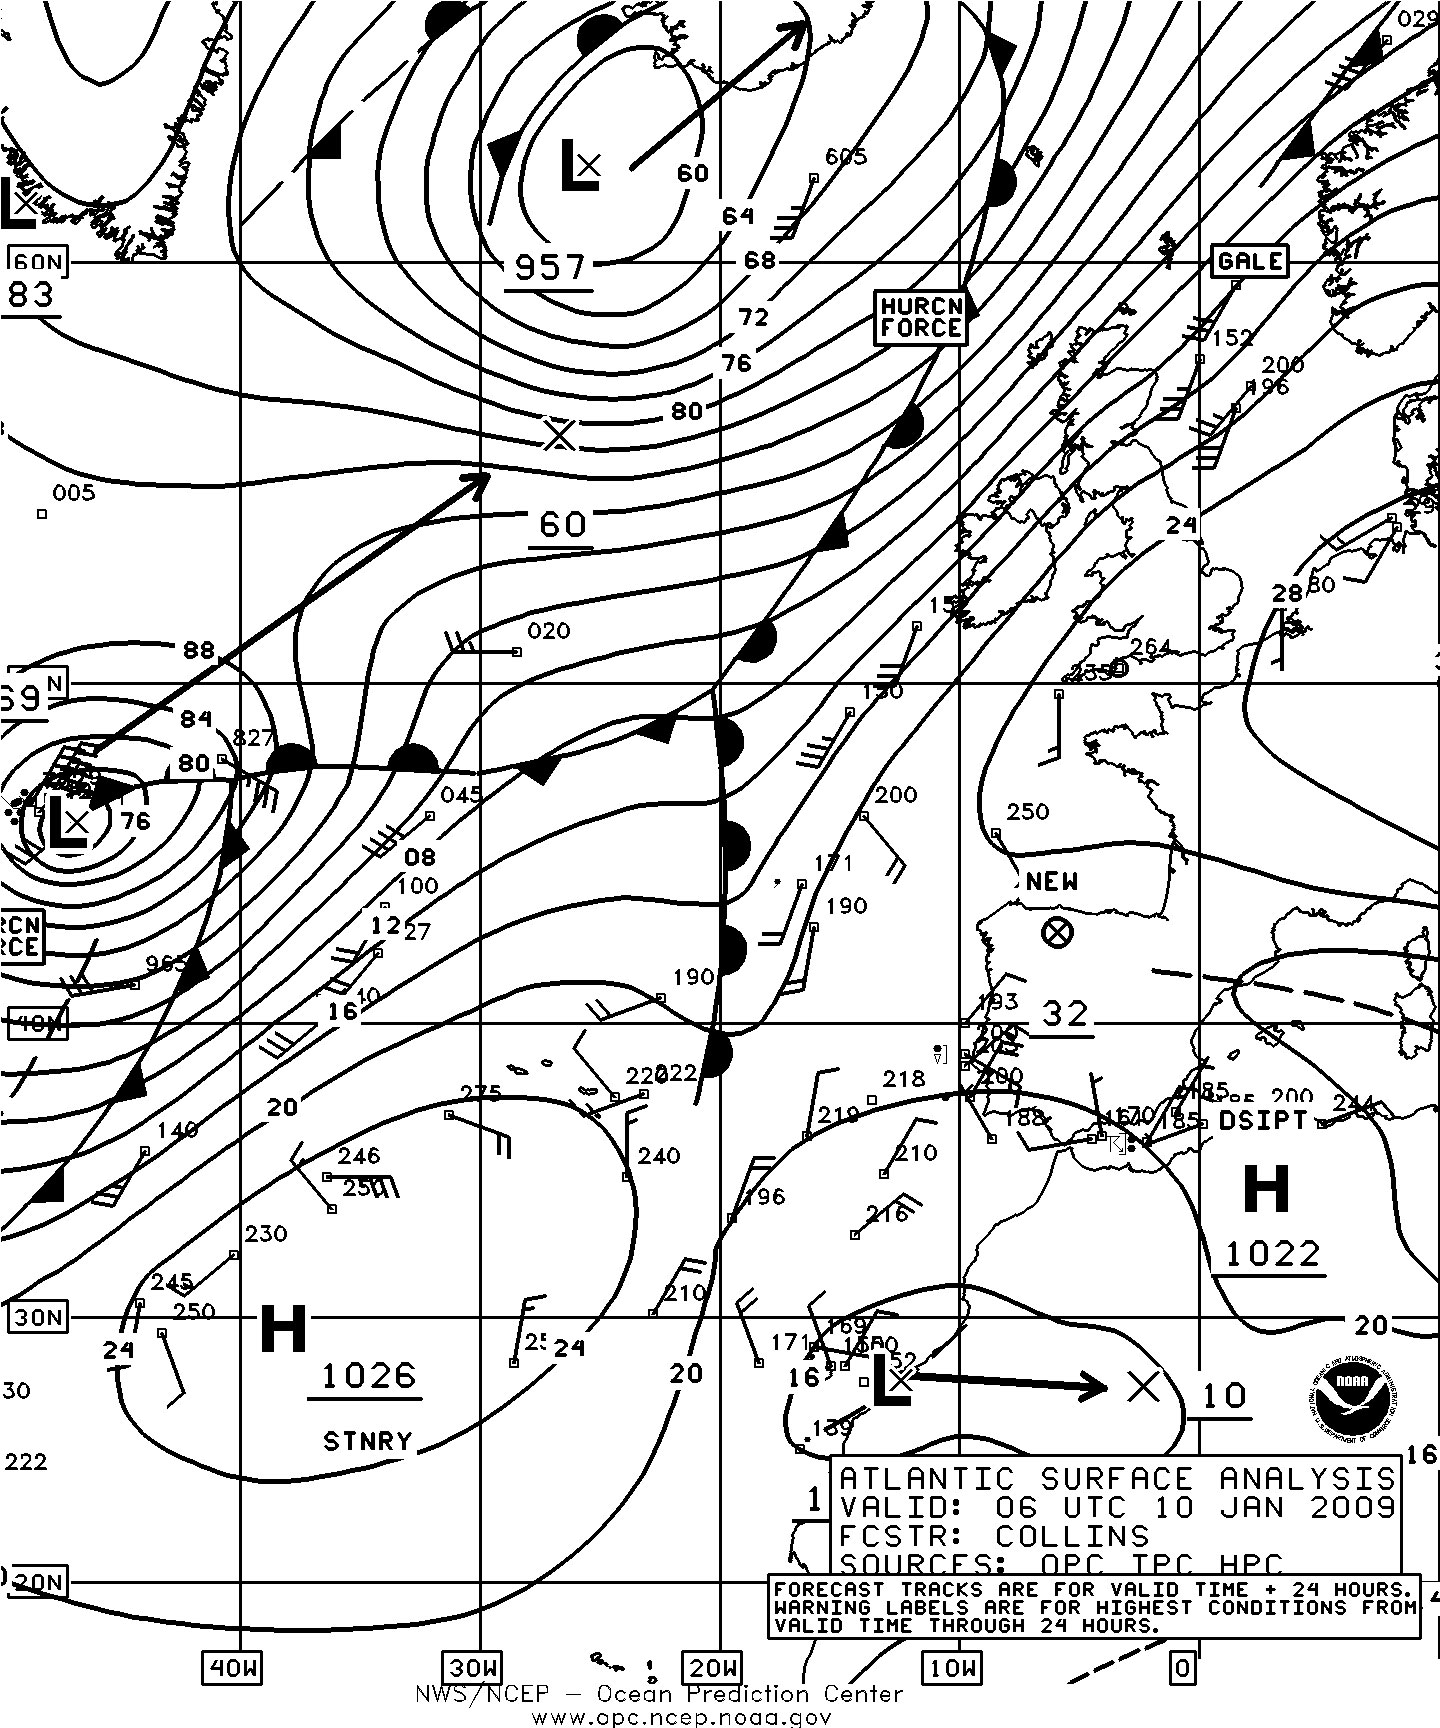
Figure 2. OPC North Atlantic Surface Analysis charts valid 1800 UTC January 8 (Part 2 west) and 0600 UTC January 10, 2009 (Part 1 east).(Click to enlarge)
Northeast Atlantic Storm, January 16-18: The period of most rapid development of the next major storm is shown in Figure 5. The cyclone passing well south of Greenland originated near the mid-Atlantic coast of the U.S. early on the 15th and is shown in Figure 5 deepening by 50 hPa in twenty-four hours, or more than 2 hPa per hour. QuikSCAT imagery in Figure 6 reveals hurricane force winds up to 75 kts in a swath southeast of the low center and extending to near the coast of Scotland. The cyclone continued to intensify while turning north, developing a central pressure of 942 hPa (27.82 inches) while passing east of Iceland on the 18th. The buoy 62023 (51.4N 7.9W) reported a south wind of 60 kts and seas 6.0 m (19 ft) at 1400 UTC on the 17th followed five hours later by a report of seas 7.5 m (25 ft). The buoy 62081 (51N 13.3W) at 1000 UTC on the 17th reported south winds of 46 kts and seas 8.5 m (28 ft) and maximum seas 11.5 m (38 ft) at 0600 UTC on the 18th.
Northeast Atlantic Storm, January 21-24: The intense 937 hPa low near Iceland shown in the first part of Figure 7 originated as a frontal wave of low pressure near 49N 35W at 0600 UTC on the 21st with a 985 hPa central pressure. Initial intensification in the following twenty-four hours was impressive, with the pressure falling 49 hPa leading to a hurricane force low near 60N 17W with a lowest central pressure of 936 hPa (27.64 inches) at 0600 UTC on the 22nd. This made it the deepest low of the four month period not only in the North Atlantic but in both the Atlantic and Pacific. OPC analysts classified it as a hurricane force low for the twenty-four hour period ending at 1800 UTC on the 22nd. Near the beginning of this period a high resolution QuikSCAT pass revealed a swath of west to northwest winds to 65 kts south and southwest of the low center (Reference 4). Although this was the deepest low in terms of central pressure it did not produce the strongest winds compared to some of the other hurricane force storms described in this article. At 0000 UTC on the 22nd the P&O Nedlloyd Marseille (MYSU5) near 55N 18W reported west winds of 50 kts and seas 5.5 m (18 ft). Seven hours later the ship VQHR9 (60N 0W) encountered south winds of 60 kts and seas 8.0 m (26 ft). The buoy 63118 (59.3N 1.8E) also reported 60 kts south winds at 0800 UTC on the 22nd. The buoy 63115 (61.6N 1.3E) reported seas as high as 11.5 m (38 ft) at 2200 UTC on the 22nd. Figure 7 shows this cyclone turning west and weakening. It was later absorbed by another strong system moving into the Labrador Sea on January 25.
| Observation | Position | Date/Time (UTC) | Wind | Seas (m/ft) |
|---|---|---|---|---|
| SCKB | 46N 24W 46N 25W 45N 26W |
13/1800 14/0000 14/0600 |
SW 55 SW 55 W 60 |
5.5/18 8.5/28 9.0/30 |
| DDIU | 42N 14W | 14/1500 | S 45 | 9.0/30 |
| OUJH2 | 47N 12W | 14/1800 | SW 35 | 10.0/33 |
| WDD3825 | 43N 18W | 14/2200 | NW 50 |
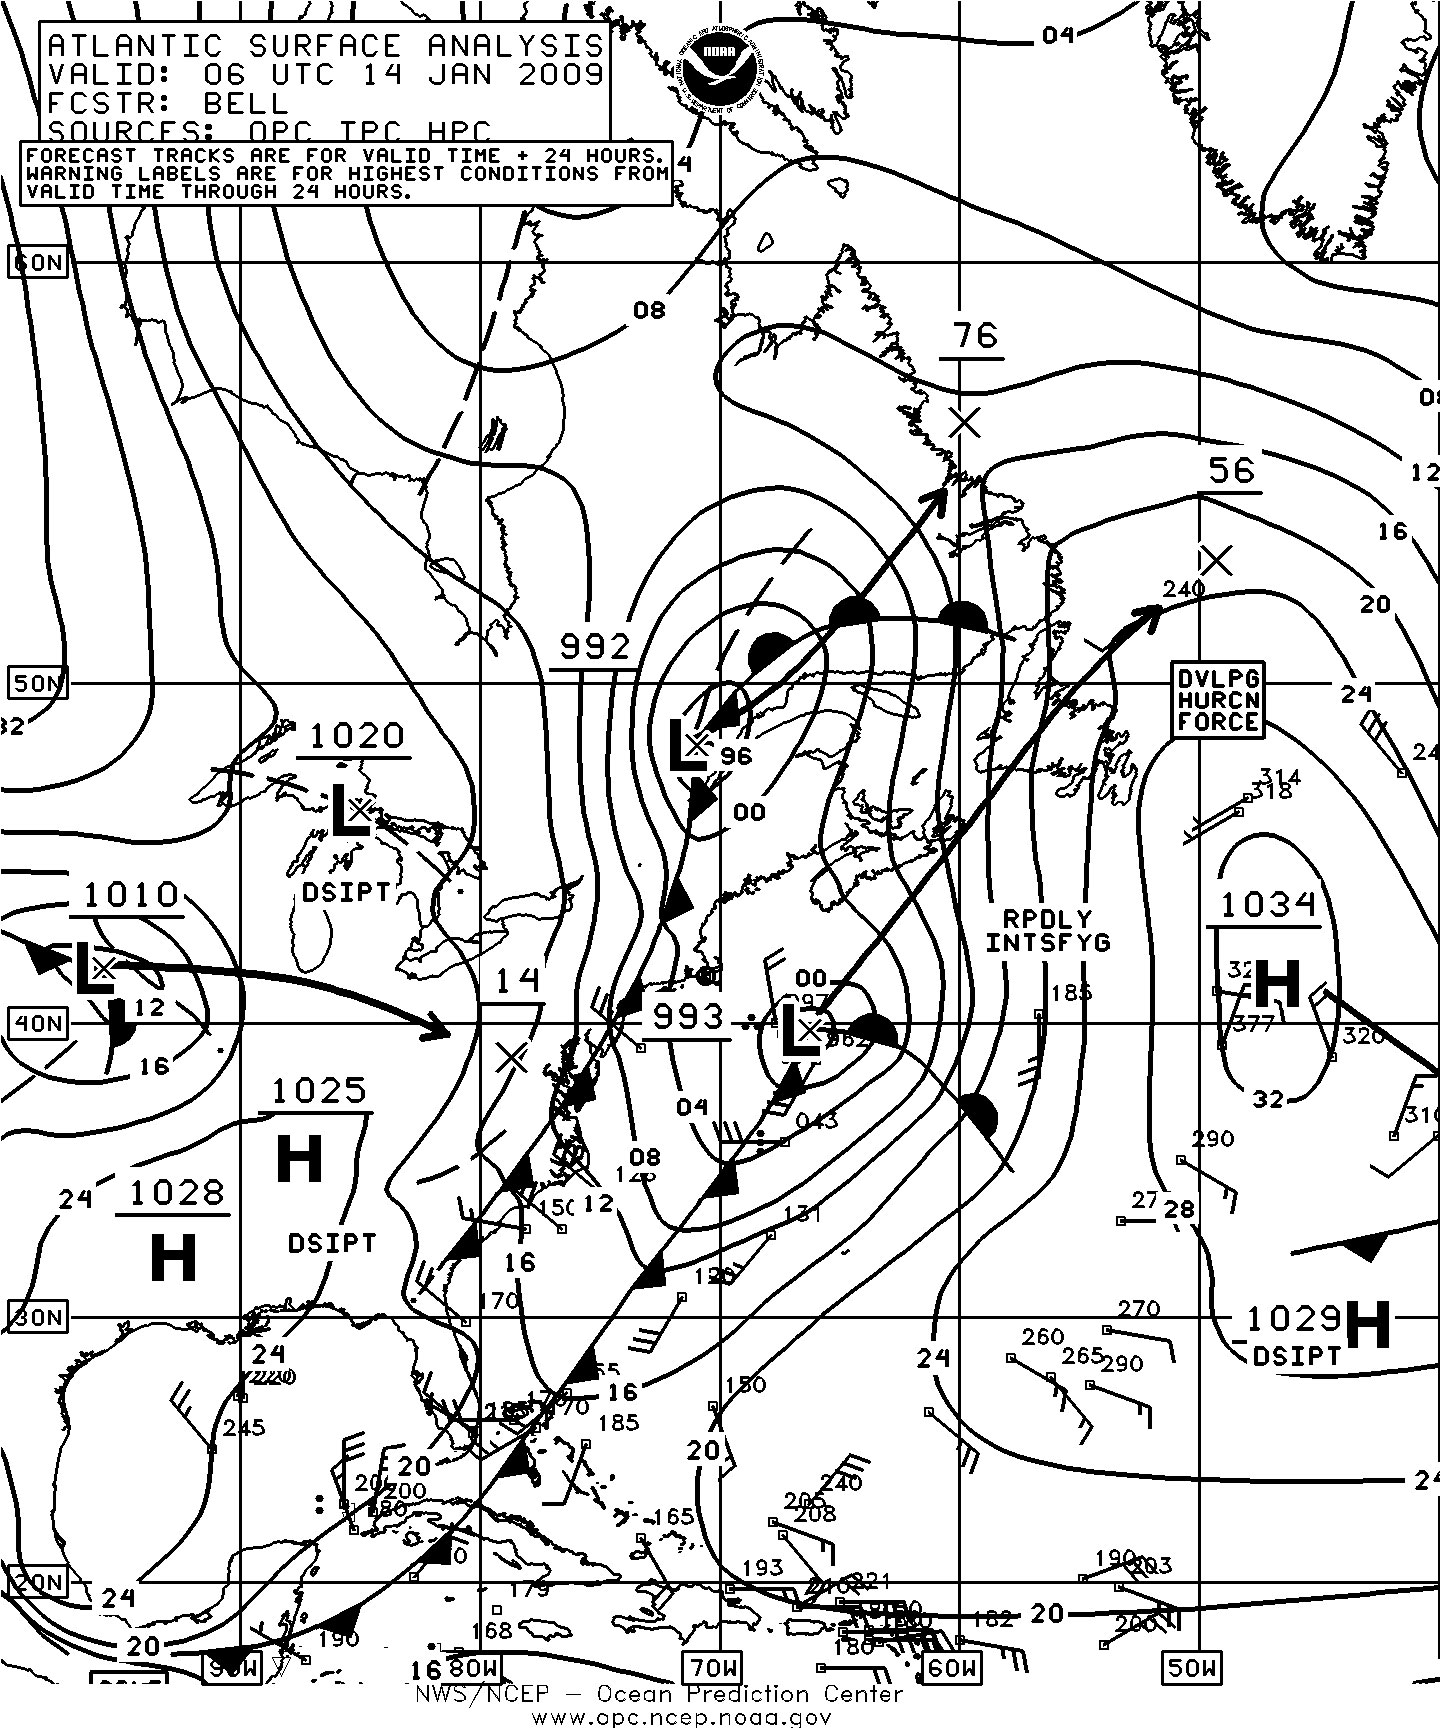
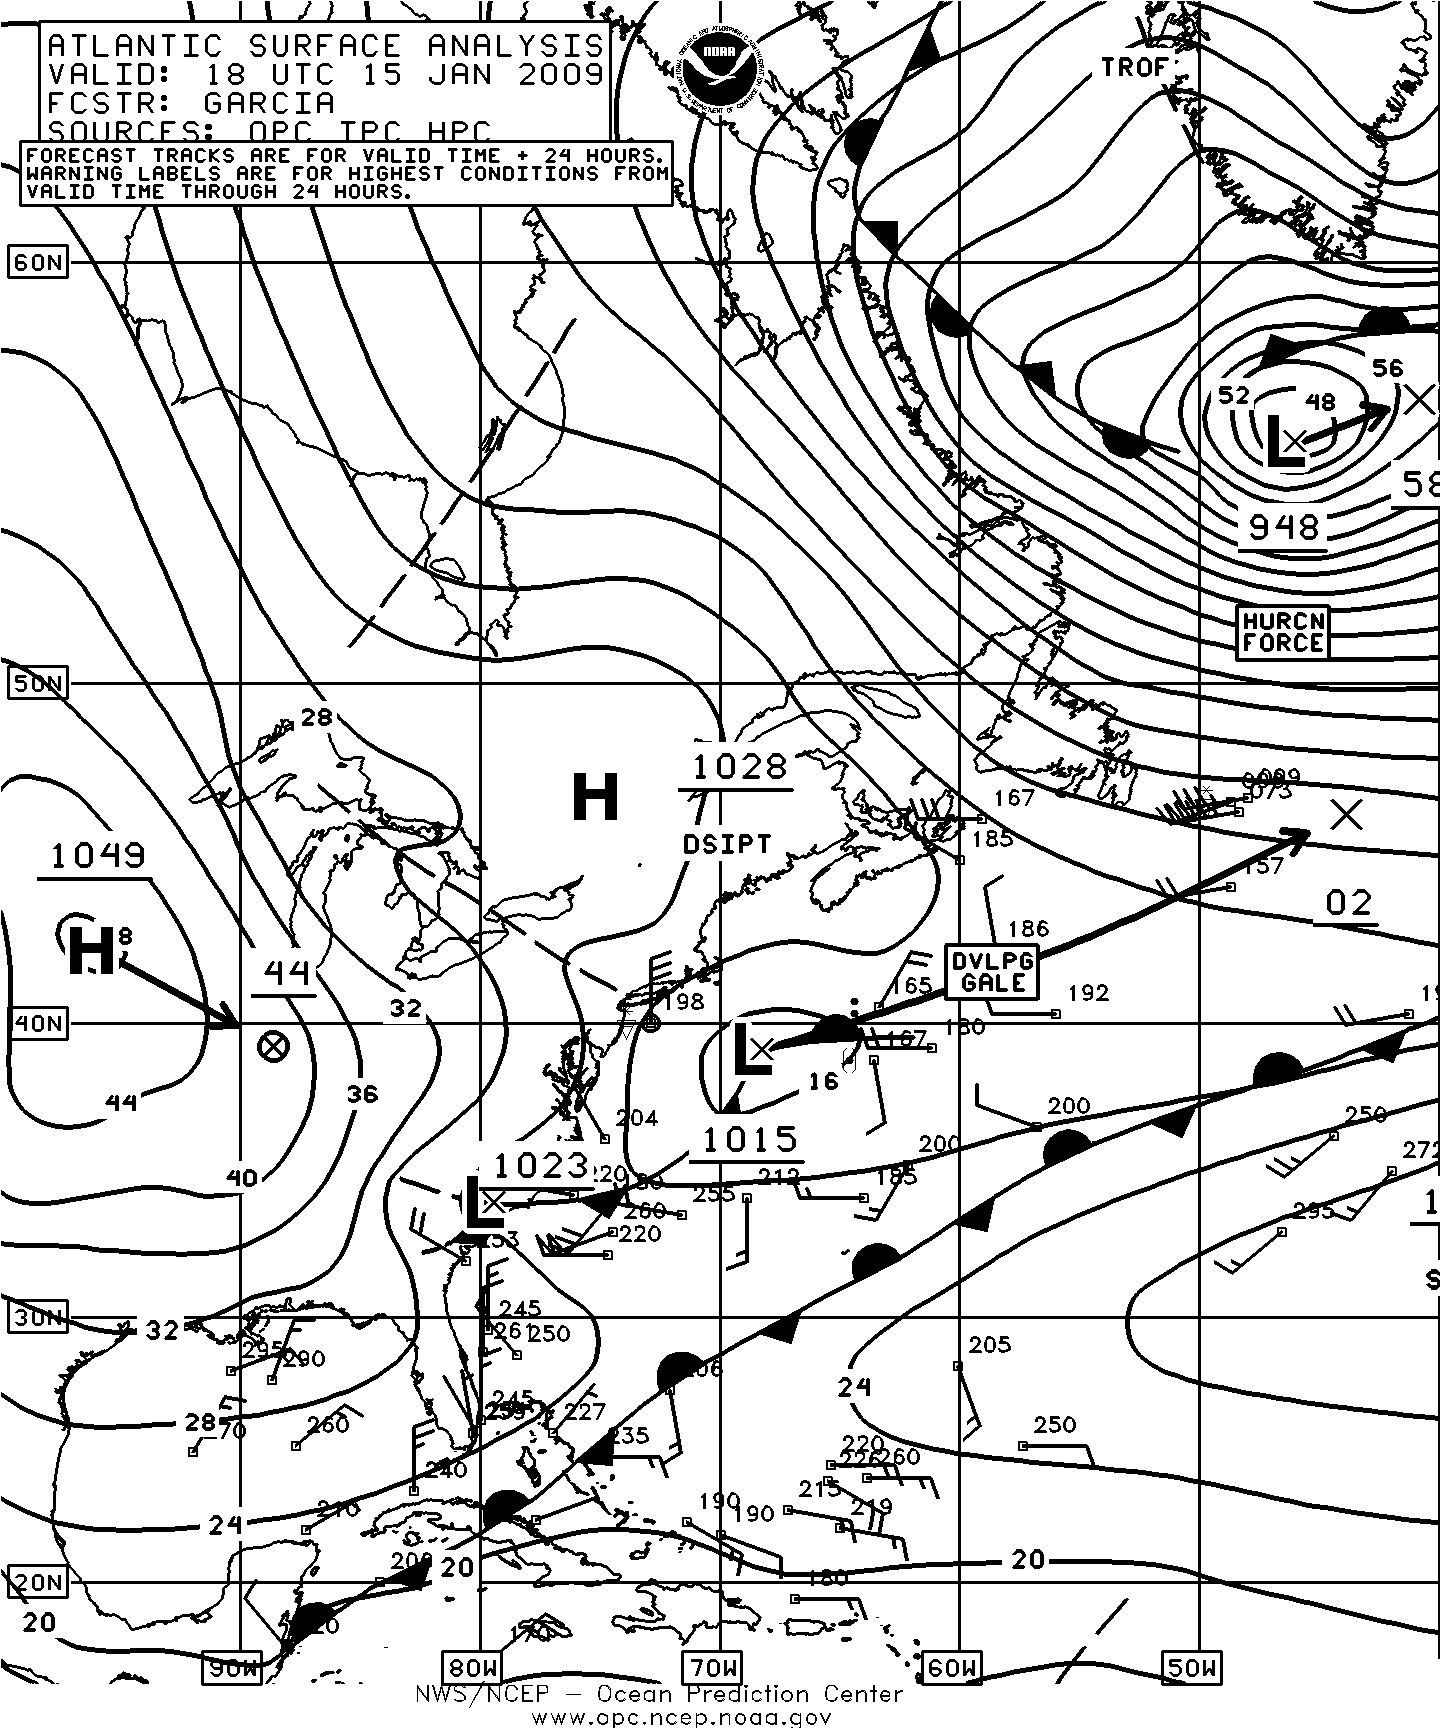
Figure 3. OPC North Atlantic Surface Analysis charts (Part 2) valid 0600 UTC January 16 and 1800 UTC January 15, 2009. (Click to enlarge)
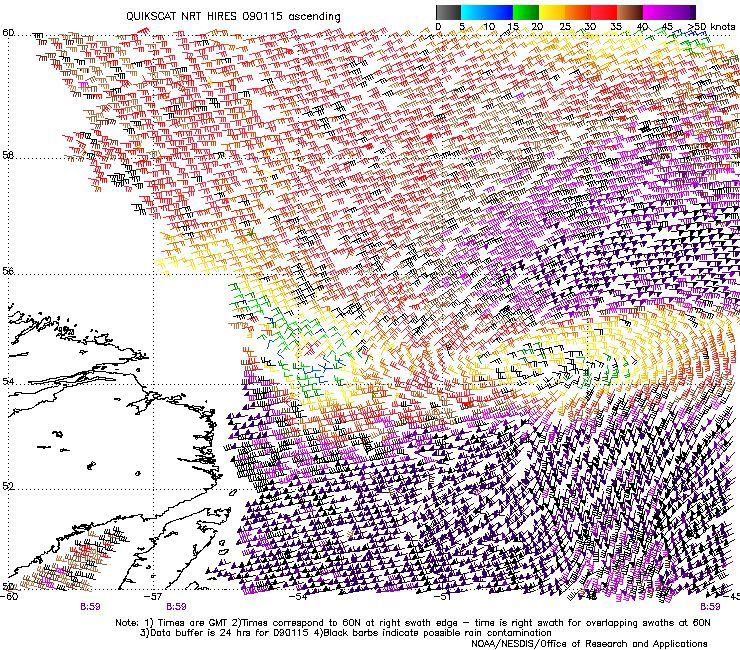
Figure 4. High resolution QuikSCAT scatterometer image of satellite-sensed winds around the hurricane force low in Figure 3 with the center near 54N 49W. The valid time of the pass is 0859 UTC January 15, 2009, or about nine hours prior to the valid time of the second part of Figure 3. The resolution of the image is 12.5 km versus 25 km in the standard version of the imagery. Image is courtesy of NOAA/NESDIS/ Office of Research and Applications. (Click to enlarge)
Eastern North Atlantic Storm, January 23-24: This short lived but very powerful and compact cyclone is shown in Figure 7 developing from a mid-ocean frontal wave of low pressure, with the central pressure dropping 40 hPa during this period. A 500 hPa analysis for 1200 UTC January 23 in the middle of the period of development suggested a strong westerly jet stream of at least 100 kts (at 500 hPa) and a strong short wave trough with negative tilt driving the rapid movement and intensification of this cyclone. More information on the use of the 500 hPa chart may be found in Reference 5. Figure 9 is a European satellite (infrared) image of the storm near maximum intensity revealing its compact, intense circulation with higher frontal cloud bands wrapping around a well defined center in the Bay of Biscay. Table 4 below lists ships reporting in the storm, including an 80 kts and a 99 kts report. These reports looked good since available high resolution QuikSCAT data showed winds of 95 kts in that area south of the cyclone. This cyclone, from the ship reports supported by QuikSCAT imagery, appeared to develop winds comparable to those of the low end of Category 3 on the Saffir-Simpson scale of hurricane intensity (Reference 6). The cyclone subsequently quickly moved inland over France and then redeveloped in the Mediterranean, where it produced hurricane force winds later on the 24th.
| Observation | Position | Date/Time (UTC) | Wind | Seas (m/ft) |
|---|---|---|---|---|
| Benguela Stream (PENR) | 45N 14W | 23/1500 | SW 55 | 7.5/24 |
| A8EY5 | 40N 17W | 23/1800 | W 40 | 10.0/33 |
| WDD4207 | 44.2N 7.5W 44.1N 7.4W | 23/2100 24/0200 | SW 80 W 99 | 14.5/47 |
| Duncan Island (C6JS) | 47N 9W | 24/0000 | NW 56 | |
| BATFR34 | 47N 6W | 24/0300 | SW 50 | |
| Egmondgracht (PDWG) | 45N 8W | 24/0600 | NW 55 | 13.0/42 |
| WDD4207 | 44N 7W | 24/0600 | W 60 | 6.5/22 |
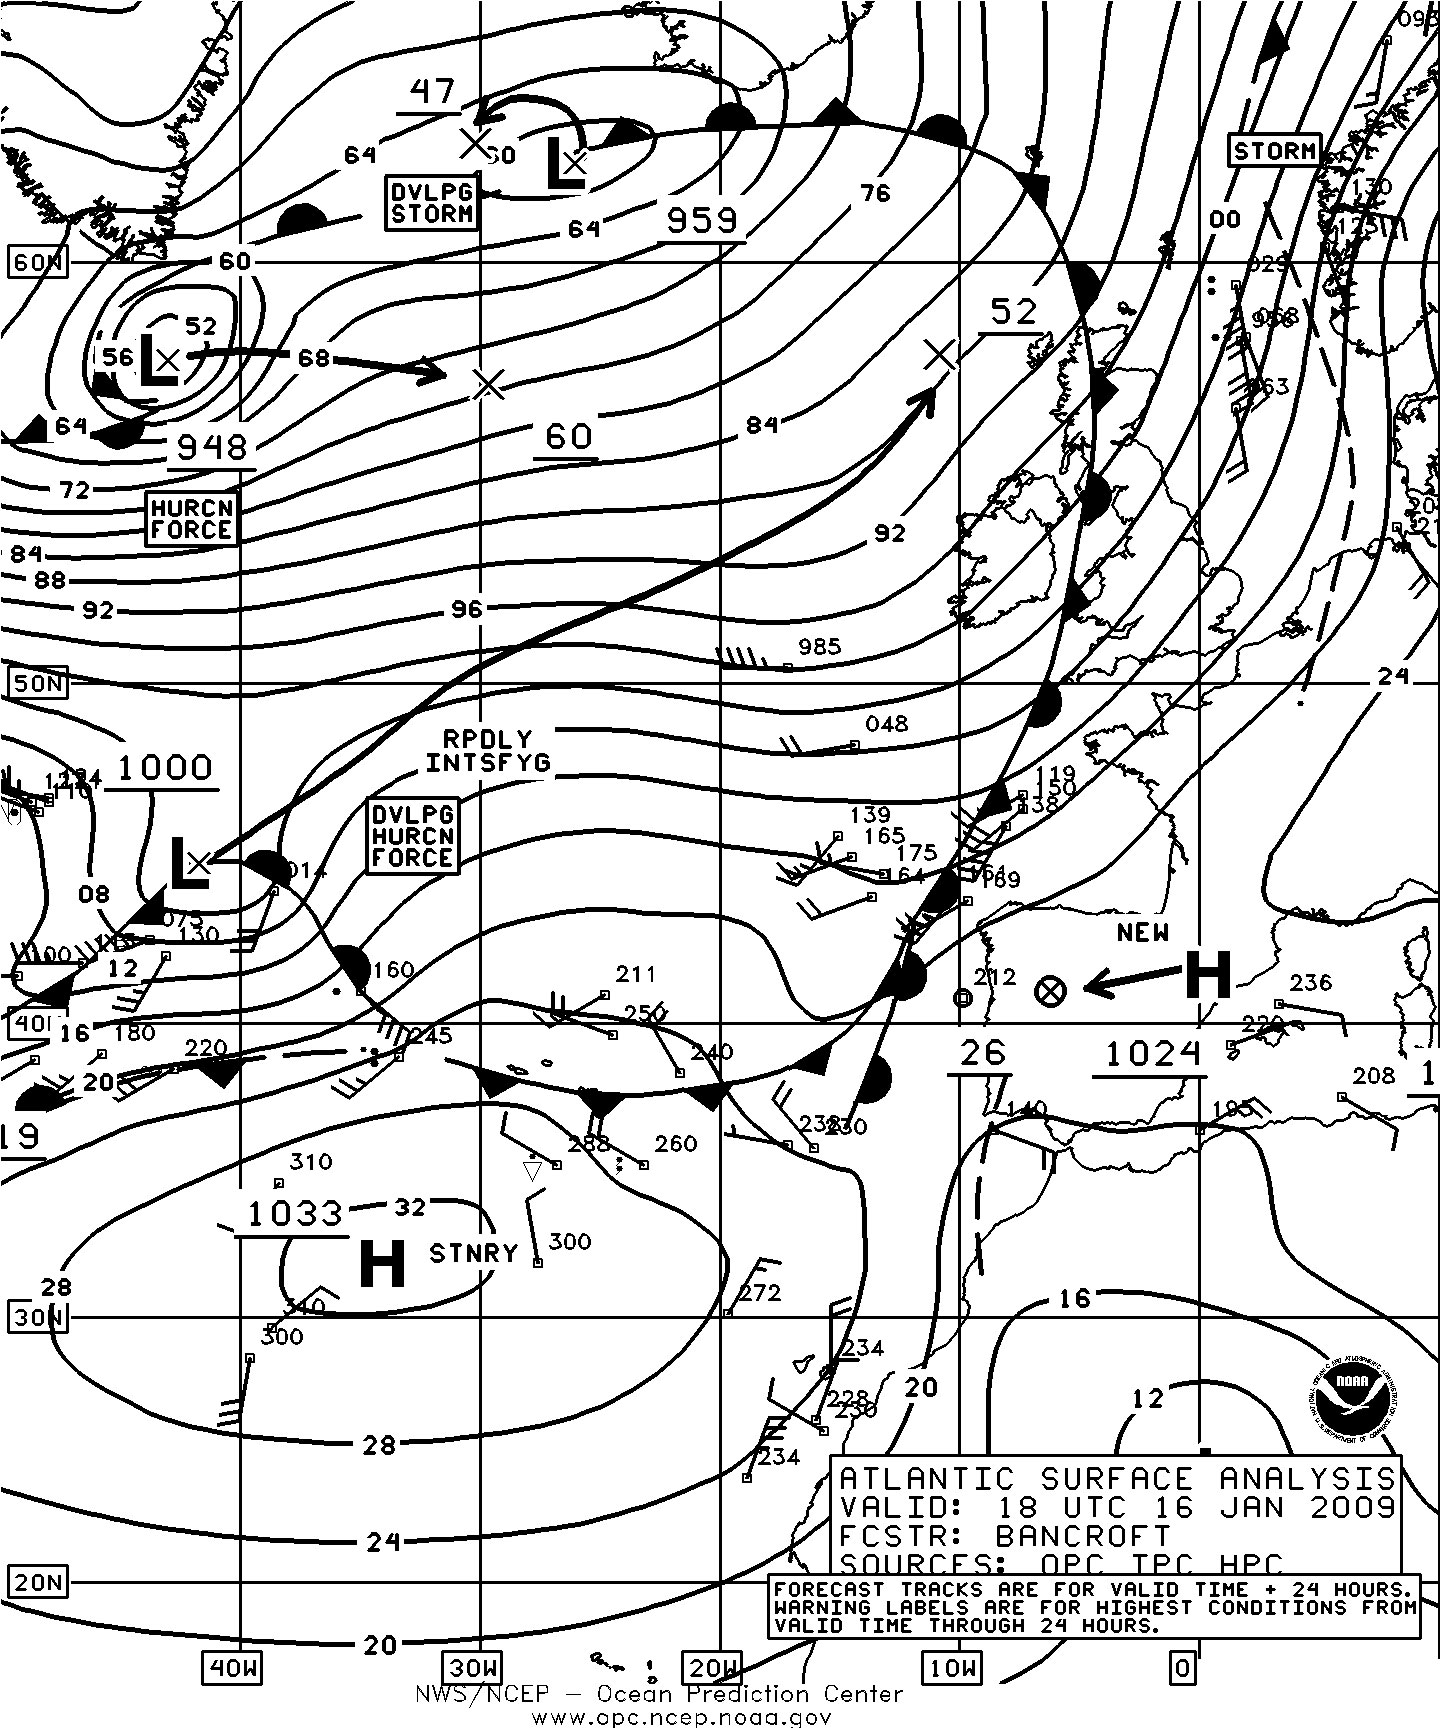
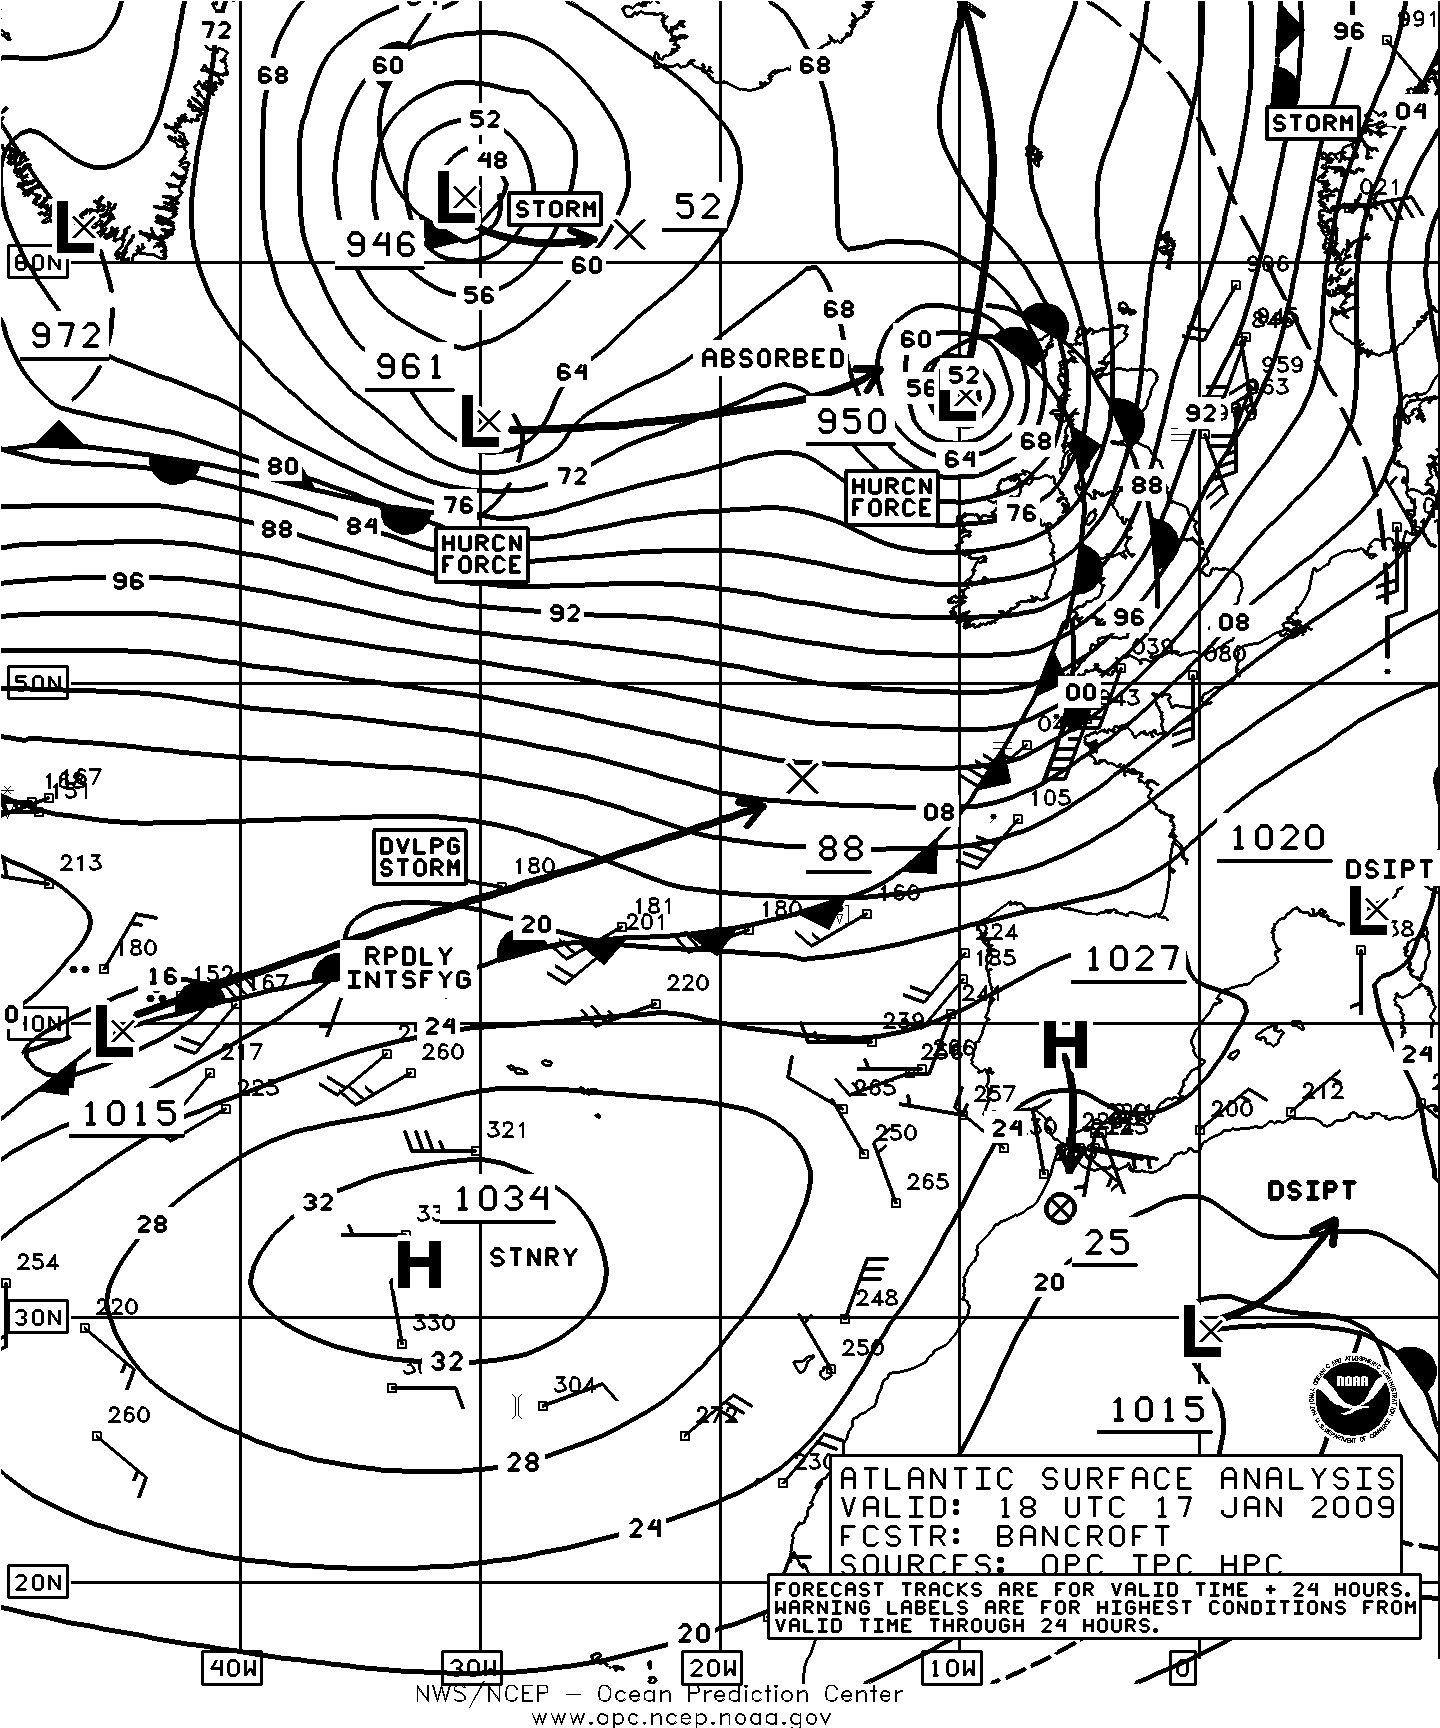
Figure 5. OPC North Atlantic Surface Analysis charts (Part 1) valid 1800 UTC January 16 and 17, 2009. (Click to enlarge)
North Atlantic Storms, January 23-25: Figure 7 displays the development of two other cyclones over the northern waters. The stronger system is the 976 hPa low in the second part of Figure 7 which came from the Canadian Maritime Provinces early on the 23rd. This cyclone intensified to 960 hPa as the center passed near 54N 16W at 0000 UTC on the 25th, where it briefly developed winds to 65 kts on the west and southwest sides in scatterometer data. Also the front shown east of Greenland in the second part of Figure 7 spawned a short lived low pressure center which dropped southeast in the rear of the stronger system. This became a 964 hPa cyclone near 59N 31W at 1800 UTC on the 24th with a small area of 65 kts northwest winds west of the center, before becoming absorbed by the larger system to the southeast late on the 24th. The merged system then weakened over Great Britain on the 25th.
| Observation | Position | Date/Time (UTC) | Wind | Seas (m/ft) |
|---|---|---|---|---|
| KABP | 40N 56W | 01/1300 | NW 45 | 10.5/35 |
| SBLW | 50N 45W | 02/0600 | W 60 | |
| V7RD6 | 51N 47W 51N 46W |
02/0800 02/1200 |
NW 70 W 70 |
15.5/51 |
| BATEU06 | 48N 36W | 02/0900 | SW 50 | |
| VRVQ9 | 54N 45W 52N 49W 51N 50W |
02/1200 02/1500 02/2100 |
NW 45 W 60 W 50 |
8.5/28 |
| Buoy 44639 | 41.4N 51.8W | 01/1200 | NW 45 | |
| Hibernia Platform (VEP717) | 46.7N 48.7W | 01/2100 02/0000 |
W 50 W 65 |
|
| Henry Goodrich (HP6038) | 48.2N 46.1W | 02/1200 02/1500 |
W 60 W 55 |
10.0/32 10.5/34 |
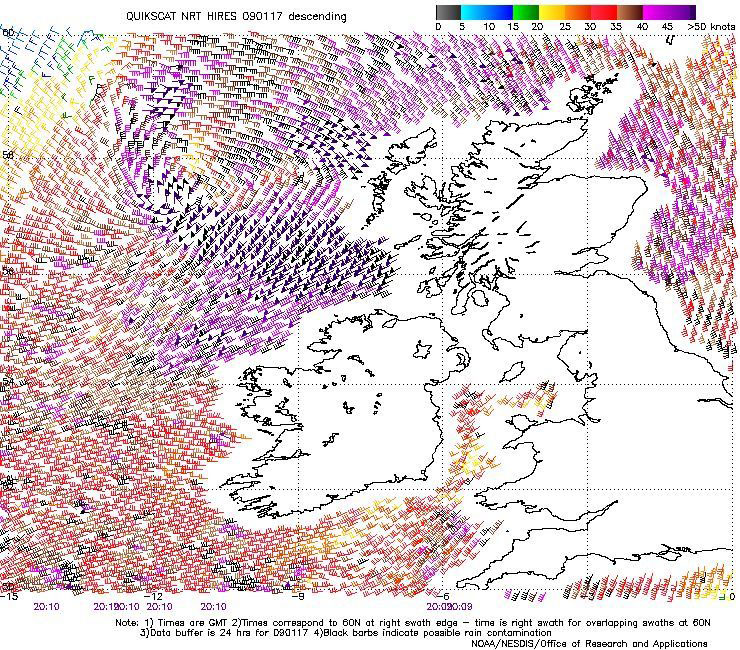
Figure 6. High resolution QuikSCAT scatterometer image of satellite sensed winds around the eastern hurricane force low shown in Figure 5. The valid time of the pass is 2010 UTC January 17, 2009, or about two hours later than the valid time of the second part of Figure 5. The center of the storm is near 57N 11W northwest of Ireland. Image is courtesy of NOAA/NESDIS/ Office of Research and Applications. (Click to enlarge)
Northwestern Atlantic Storm, January 24-27: This cyclone developed while passing northeast through the Canadian Maritime Provinces and into the Labrador Sea and developed a lowest central pressure of 952 hPa near 58N 47W at 0000 UTC on the 26th. The central pressure fell 32 hPa in the twenty-four hour period ending at 1200 UTC on the 15th. Hurricane force winds developed south and west of the low by 1800 UTC on the 25th and lasted until early on the 26th, when the cyclone stalled near the southern tip of Greenland and began to weaken. This cyclone was similar in intensity and winds to the mid-January event, initially. The mid-January storm maintained its hurricane force winds longer as it turned east across the North Atlantic, while this cyclone weakened to a gale while stalled on the 27th before becoming absorbed by a low passing to the south on the 30th.
| Observation | Position | Date/Time (UTC) | Wind | Seas (m/ft) |
|---|---|---|---|---|
| BATFR28 | 47N 3W 47N 3W 46.5N 3.6W |
09/1700 09/2000 09/2200 |
SW 50 SW 55 SW 65 |
|
| BATFR34 | 47.7N 6W | 09/2200 | SE 75 | |
| PCZM | 47N 8W | 09/1800 | NW 50 | |
| BATEU06 | 50N 1W | 10/0400 | NW 50 | |
| Buoy 62507 | 46N 4W | 09/1800 | SW 50 | |
| Buoy 62001 | 45.4N 4.9W | 09/2200 09/2300 |
W 40 | 9.0/30 10.0/33 |
North Atlantic Storm, February 1-3: This cyclone organized south of the island of Newfoundland near 41N late on January 31 and rapidly intensified while passing east of the island on February 1 and developed hurricane force winds later that day. The central pressure fell 32 hPa in the twenty-four hour period ending at 1800 UTC on the 1st. The cyclone developed a central pressure of 957 hPa while passing near 52N 43W at 0600 UTC on the 2nd. In its wake several ships and platforms reported storm force or higher winds and are included in Table 5. The cyclone then turned north and began to weaken, with its winds dropping to gale force early on the 3rd, and then dissipated in the Davis Strait or became absorbed by another cyclone moving into that area by the 5th.
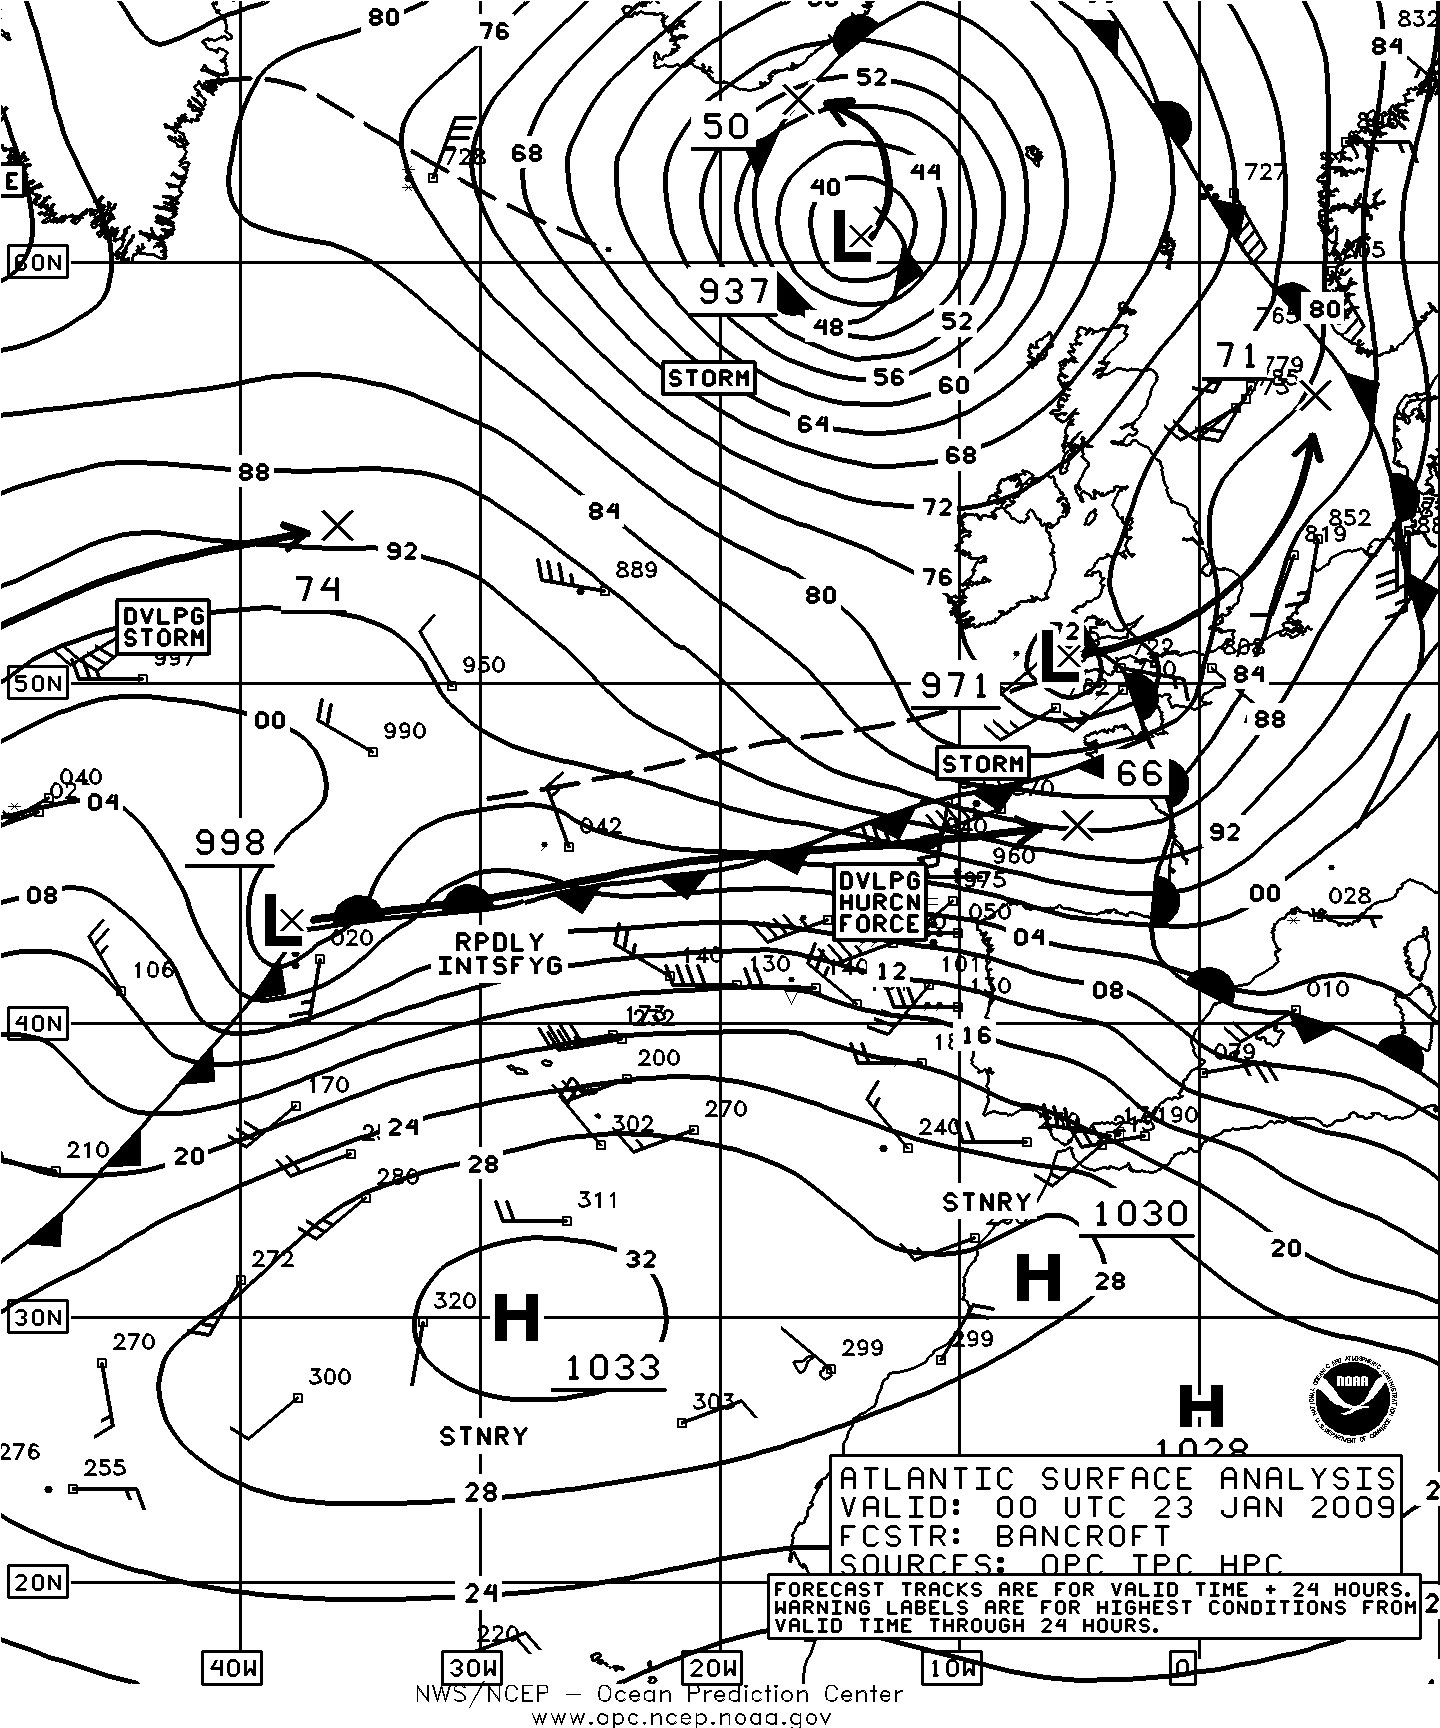
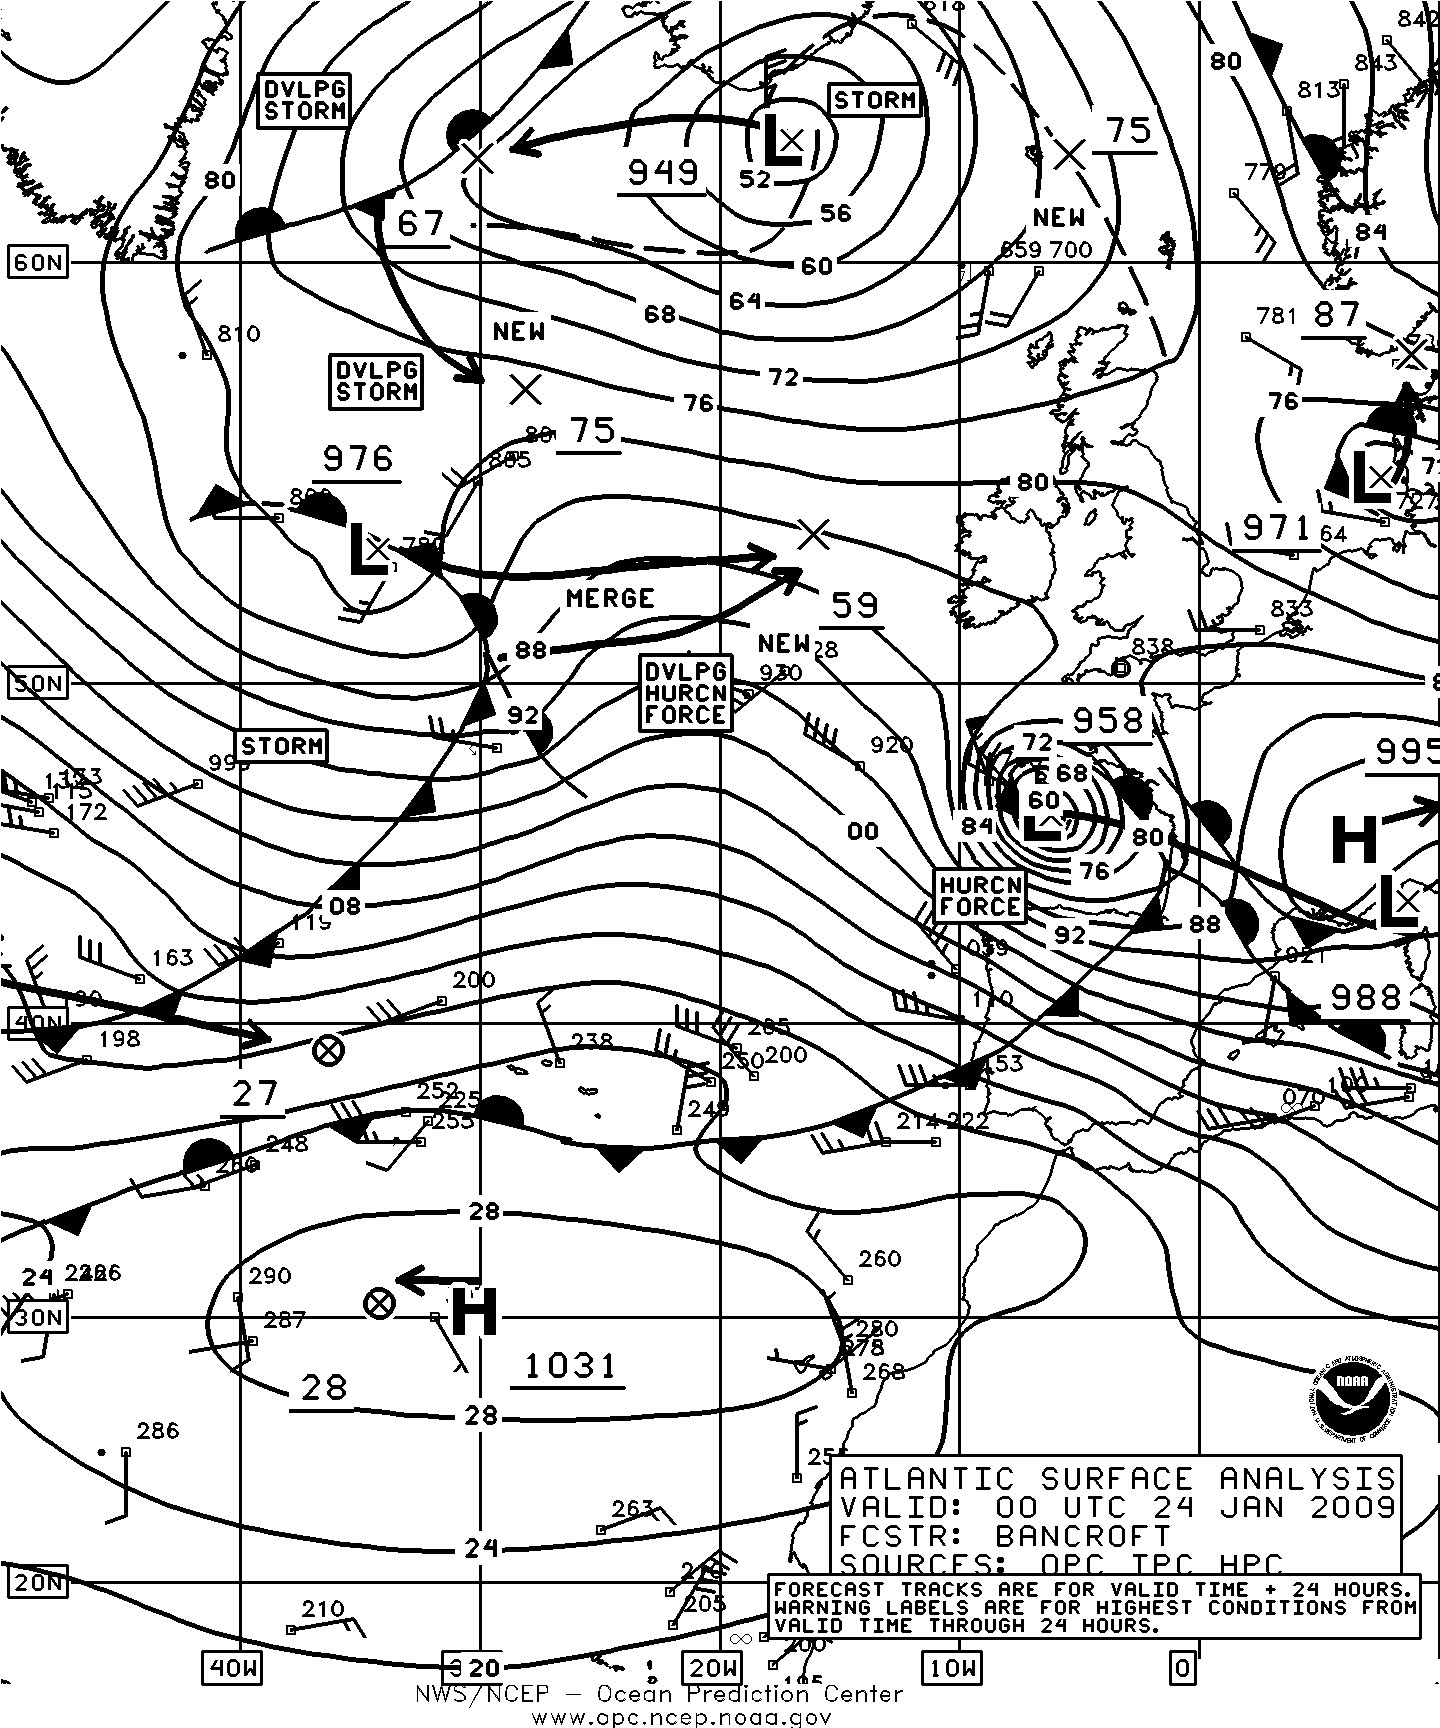
Figure 7. OPC North Atlantic Surface Analysis charts (Part 1) valid 0000 UTC January 23 and 24, 2009. (Click to enlarge)
| Observation | Position | Date/Time (UTC) | Wind | Seas (m/ft) |
|---|---|---|---|---|
| WDC6736 | 36N 65W | 17/0900 | N 45 | 4.5/14 |
| Sea Parana (DPPH) | 45N 48W | 18/1200 | SE 55 | 10.0/33 |
| Buoy 44638 | 40N 52.7W 40N 52.6W 40.1N 52.0W |
17/1800 17/2000 18/1200 |
E 50 E 60 W 50 |
|
| Buoy 44639 | 42.0N 49.0W | 18/0900 | S 50 | |
| Hibernia Platform (VEP717) | 46.8N 48.7W | 18/0600 18/0900 |
NE 55 NE 55 |
2.5/8 3.0/10 |
| GSF Grand Banks (YJUF7) | 46.8N 48W | 18/0900 19/0300 |
E 50 S 45 |
4.5/14 6.5/22 |
| Terra Nova (VCXF) | 46.4N 48.4W | 18/0900 18/1200 19/0300 |
E 55 6.0/19 SW 35 |
5.0/16 8.0/26 |
North Atlantic Storm, February 4-7: The February to March late winter period featured more cyclones initially tracking through the southwestern waters south of the Canadian Maritime Provinces and developing hurricane force winds there before moving out over the North Atlantic. The first of these moved off the mid-Atlantic coast of the U.S. early on the 4th and quickly developed hurricane force winds twenty-four hours later, with the center reaching 39N 65W with a 989 hPa central pressure at 0600 UTC on the 5th. The cyclone moved northeast across the island of Newfoundland late that day and then intensified further out over the North Atlantic as a hurricane force low with a central pressure as low as 960 hPa just south of Greenland later on February 6. At 0600 UTC on the 5th the ship WDD4207 reported northwest winds of 66 kts. The Snoekgracht (PCHF) near 50N 38W reported seas 8.5 m (28 ft) along with 40 kts west winds at 0600 UTC on the 7th, followed six hours by a report of west winds 50 kts near 50N 39W. The fixed oil platform Hibernia (46.7N 48.7W) reported southwest winds of 65 kts at 0300 UTC on the 6th. The buoy 44638 (40.5N 59.8W) reported southwest winds of 50 kts at 0900 UTC on the 5th. The cyclone subsequently stalled south of Greenland with its winds weakening to gale force on the 7th before becoming absorbed by a new storm developing on a front to the southeast by the 8th.
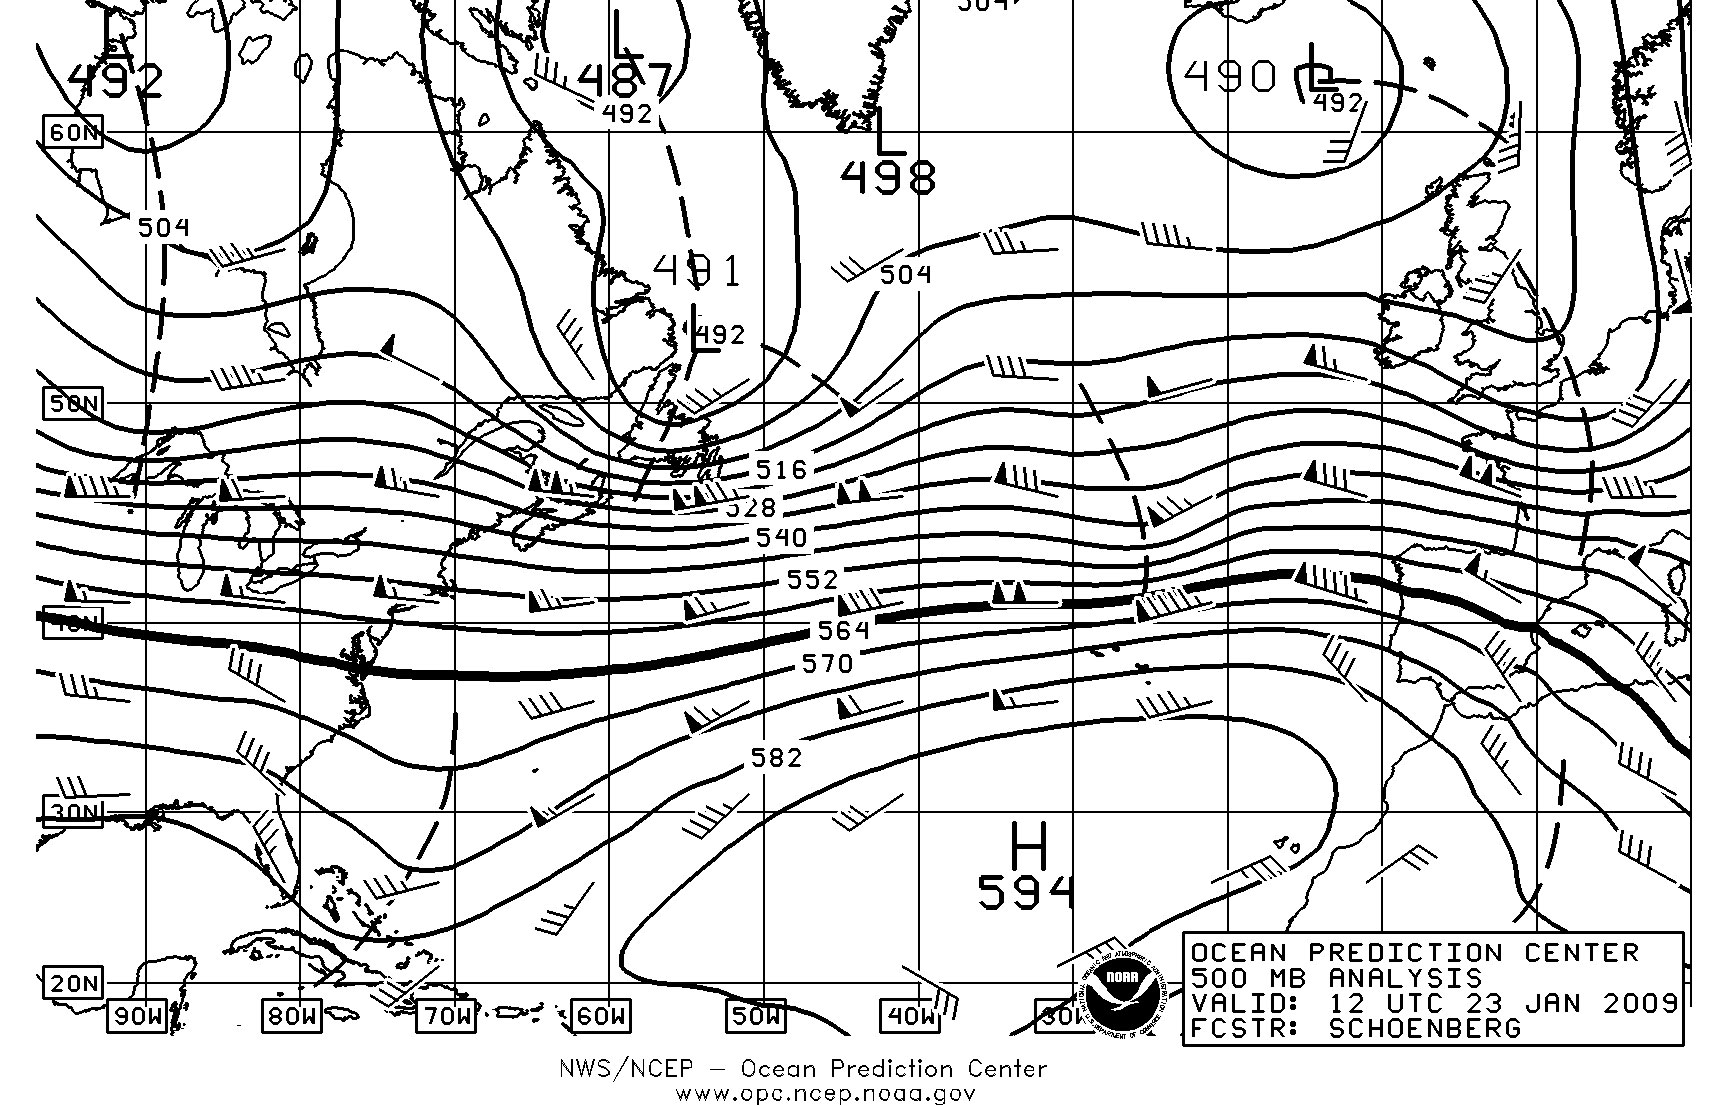
Figure 8. OPC North Atlantic 500 hPa analysis valid 1200 UTC January 23, 2009, during the period of rapid intensification of the storm moving into the Bay of Biscay shown in the second part of Figure 7. The chart is computer-generated with short wave troughs manually added as dashed lines. (Click to enlarge)
| Observation | Position | Date/Time (UTC) | Wind | Seas (m/ft) |
|---|---|---|---|---|
| WCZ5528 | 36N 62W | 24/1800 | W 45 | 6.5/21 |
| Enerchem Trader (CYCJ) | 43N 61W 43N 63W |
25/0600 25/1500 |
N 50 N 35 |
11.5/37 |
| Atlantic Concert (SKOZ) | 43N 59W | 25/0600 | NE 50 | |
| WDC6907 | 41N 62W | 25/1700 | N 50 | 9.5/31 |
| Buoy 44137 | 42.2N 62W | 25/0300 25/0500 |
NE 45 NE 40 |
9.0/30 |
| Buoy 44141 | 43N 58W | 25/0000 | NE 45 | 25/1000 6.5/21 7.5/25 |
| Buoy 44139 | 44.2N 57.1W | 25/0200 25/0800 |
NE 45 | 6.5/21 7.5/25 |
Eastern North Atlantic Storm, February 8-10: This cyclone tracked a bit north of the stronger January 23-24 event, originating as a frontal wave of low pressure near 39N 41W at 0000 UTC on the 8th and moving to northwestern France with a 975 hPa central pressure by 0000 UTC on the 10th before weakening inland. The cyclone briefly developed hurricane force winds in the Bay of Biscay late on the 9th. Some selected ship and buoy reports taken in this storm are listed in Table 6.
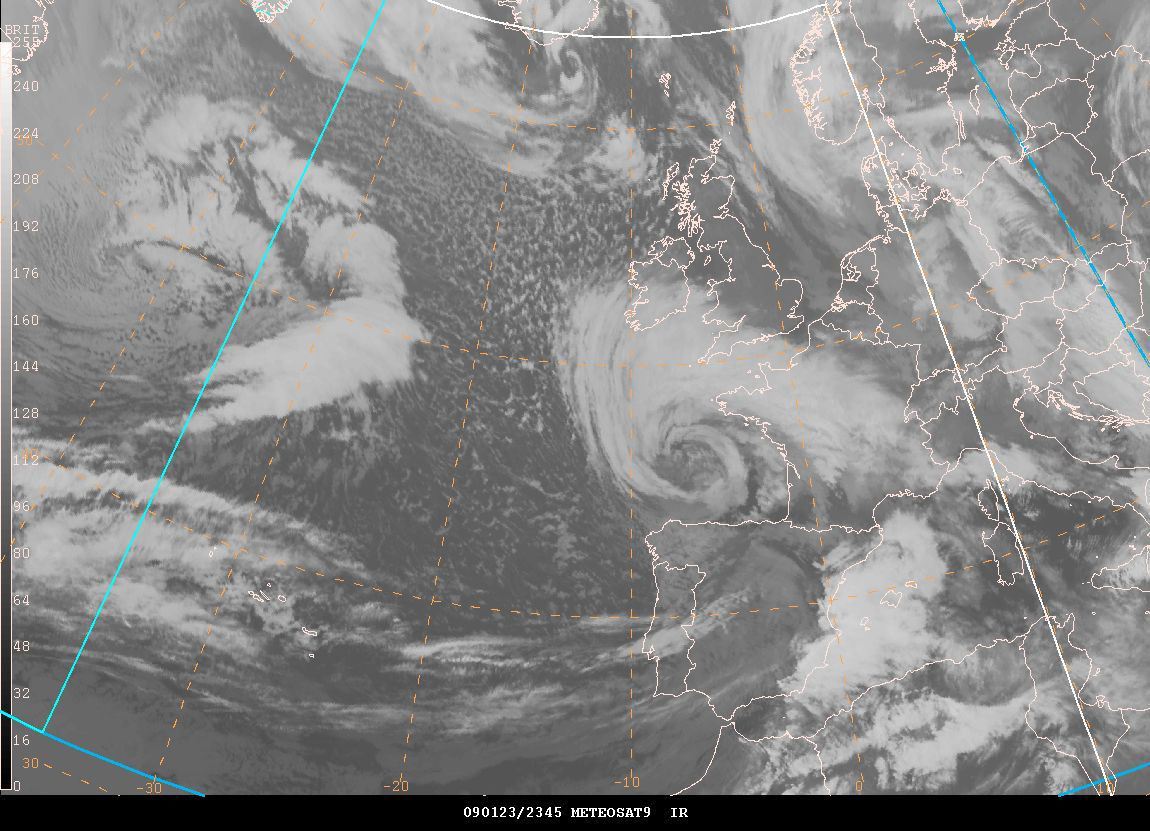
Figure 9. METEOSAT9 infrared satellite image valid 2345 UTC Jnnuary 23, 2009. The valid time of the image is approximately the valid time of the second part of Figure 7. Satellite senses temperature on a scale from black (warm) to white (cold) in this type of imagery. (Click to enlarge)
Eastern North Atlantic Storm, February 8-10: This cyclone tracked a bit north of the stronger January 23-24 event, originating as a frontal wave of low pressure near 39N 41W at 0000 UTC on the 8th and moving to northwestern France with a 975 hPa central pressure by 0000 UTC on the 10th before weakening inland. The cyclone briefly developed hurricane force winds in the Bay of Biscay late on the 9th. Some selected ship and buoy reports taken in this storm are listed in Table 6.
North Atlantic Storm, February 16-21: This cyclone developed quickly from a frontal wave of low pressure that moved northeast from the Florida peninsula early on the 16th. The intensification of this system into a hurricane force low over a twenty-four hour period is depicted in Figure 10, with the central pressure dropping an impressive 36 hPa in this period, unusual for this southern latitude. Figure 11 is a display of high resolution QuikSCAT data revealing winds to 75 kts south of the storm center and even at least as strong on the north side associated with the occluded front. There appear to be overlapping data from different passes on the right side of the image. Figure 12 contains Jason altimetry data remotely sensed by satellite, appearing in the form of a swath of numbers in while feet cutting through the storm. The sea heights are 6. m (20 ft) or higher with some values to 11.5 m (38 ft) on the south side of the storm near 32N and there is a 37 foot report near 39N which is north of the storm center. It should be noted that this is just a narrow swath and may not capture the highest conditions in the cyclone. Selected ship, buoy and platform reports are listed in Table 7. The cyclone attained a maximum intensity of 960 hPa while continuing on a northeastward track to near 42N 52W at 1200 UTC on the 18th then began weakened later that day with its top winds diminishing to gale force by the 20th over the north-central waters. The cyclone later re-intensified to a storm force low near Iceland on the 21st before weakening inland over Norway on the 22nd.
North Atlantic Storm, February 23-26: Low pressure over the Gulf of Maine with a 987 hPa central pressure early on February 23 moved over the Canadian Maritime Provinces that day and on the 24th. The cyclone weakened to a gale force low northeast of Newfoundland early on the 25th before re-intensifying to a 982 hPa storm force low 300 nm south of Greenland on the night of the 25th. It briefly developed hurricane force winds on the morning of the 26th before turning east and weakening to a gale late that day and then dissipating over the northeastern waters west of Scotland by the 28th.
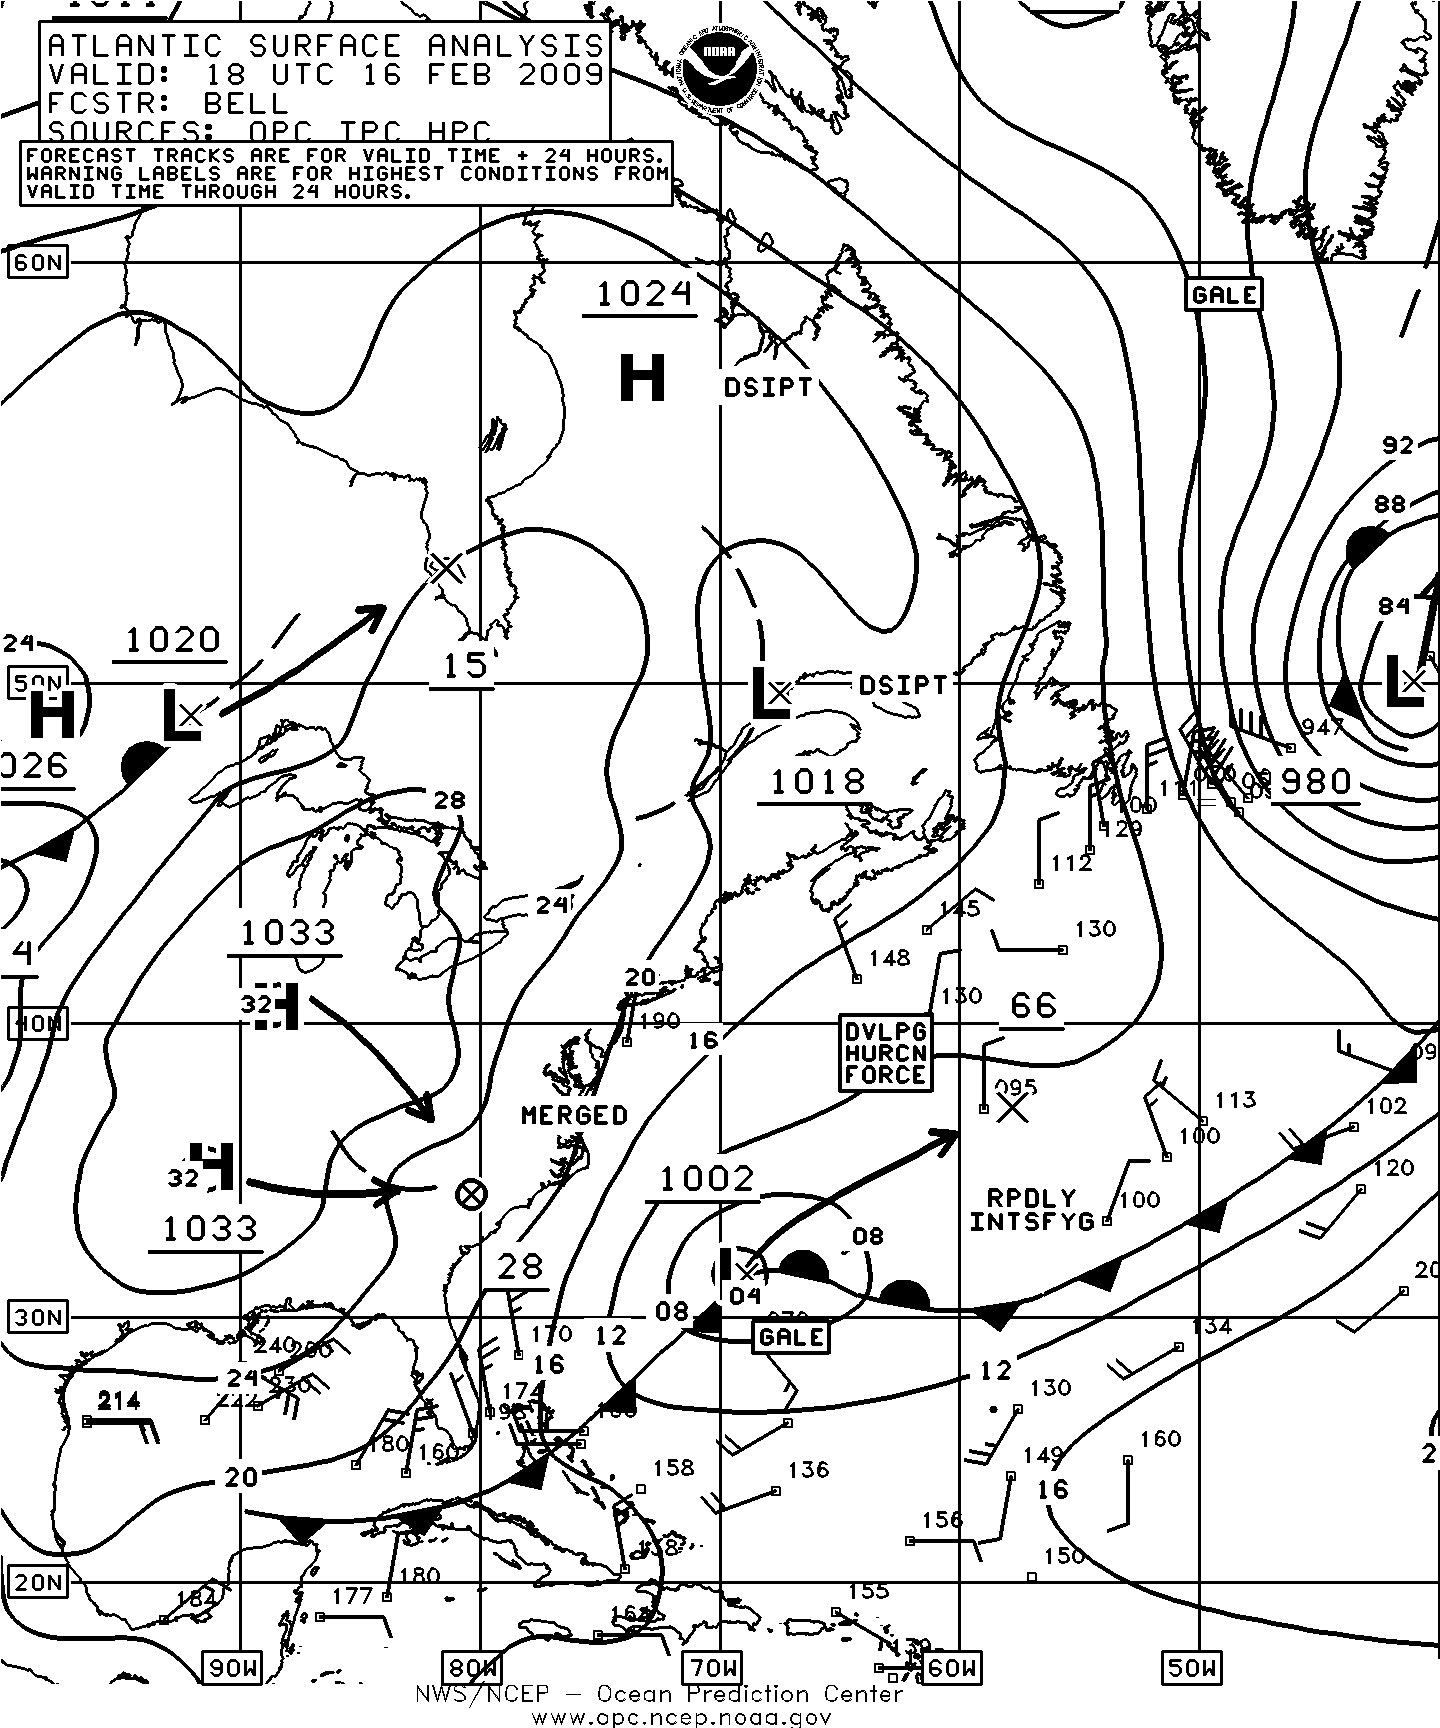
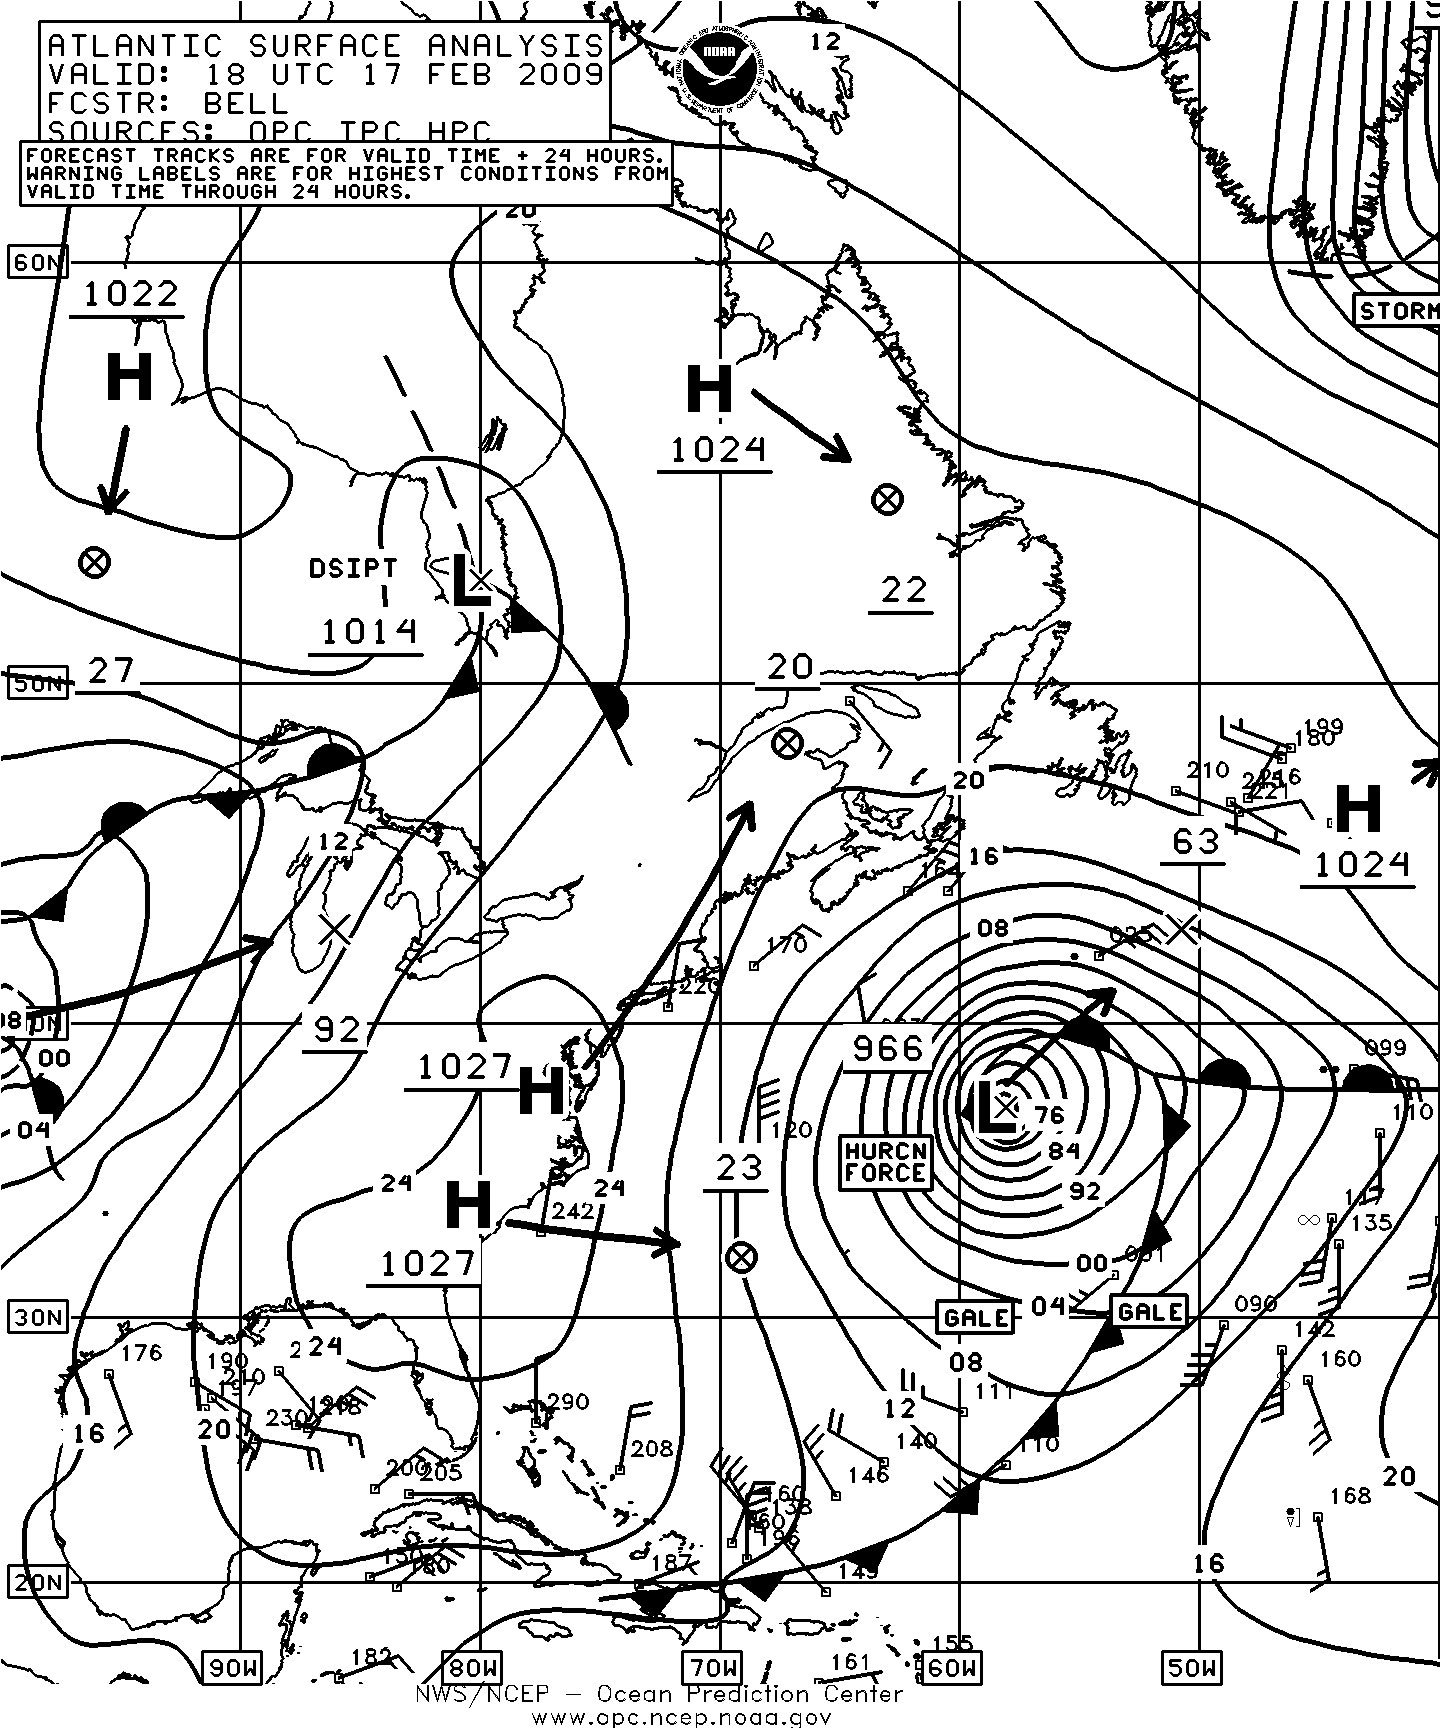
Figure 10. (Click to enlarge)
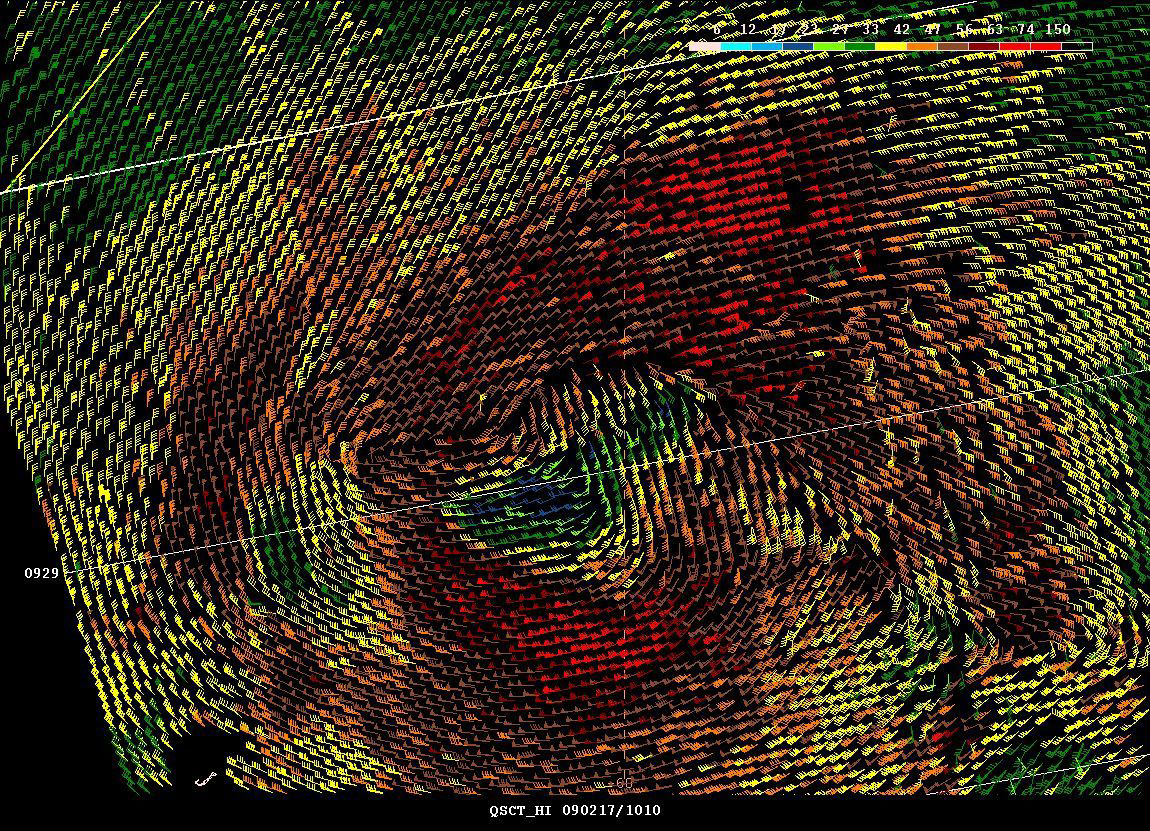
Figure 11. High resolution QuikSCAT scatterometer image of satellite sensed winds around the storm shown in Figure 10. The valid time of the pass is 0929 UTC February 17, 2009, or about eight and one-half hours prior to the valid time of the second part of Figure 10. In this version of display adapted to OPC use the diagonal lines labeled with four-digit times are cross-track time lines of the satellite and there is a scale of wind barb colors and associated wind speeds. The center of the storm is near the center of the image and Bermuda appears near the lower-left corner. (Click to enlarge)
North Atlantic/Greenland Storm, March 1-5: The development of this cyclone is depicted in Figure 13 which shows the 992 hPa frontal wave of low pressure intensifying as it passed east of Greenland. Lows passing east of Greenland tend to form a trough near the southern tip of Greenland which enhances the west to northwest winds in that area. Figure 14 shows this pattern of enhanced winds in the form of a Greenland tip jet extending east-southeast from Greenlands southern tip. Hurricane force winds to 70 kts appear west of 39W. These winds relaxed as the cyclone moved southeast away from Greenland past 25W by March 3 and re-formed to the east as a new cyclone north of Great Britain on the 4th. This new system then stalled and redeveloped inland over France by the 5th.
North Atlantic Storm, March 8-10: The next major cyclone originated in the Gulf of Maine early on March 8 and intensified while skirting the south coast of the Canadian Maritime Provinces and developing into a mid-ocean hurricane force low with a 960 hPa central pressure near 52N 39W at 0000 UTC on the 10th. About seven hours later a high resolution QuikSCAT pass revealed hurricane force winds, as high as 70 kts, mainly north and northwest of the low center in an otherwise data sparse area. The APL Jade (9VVD) near 48N 36W reported southeast winds of 50 kts at 1800 UTC on the 8th. At 1700 UTC on the 9th the drifting buoy 44639 (48N 38.1W) reported south winds of 50 kts. The cyclone then weakened to a gale force low while passing south of Iceland on the 11th . The system then moved northeast of Iceland by the 13th. The buoy 64045 (59.1N 11.7W) reported 30 kts west winds but seas of 9.5 m (31 ft) at 1000 UTC on the 12th.
Northeastern Atlantic Storm, March 12-13: This cyclone originated in the south-central waters near 39N 37W early on the 11th and moved northeast before turning north toward Iceland. It moved to 54N 24W with a 980 hPa central pressure and storm force winds early on March 13. It maintained the same intensity as it approached Iceland but briefly developed hurricane force east winds against the south coast of Iceland late on the 13th, locally 70 kts as revealed by QuikSCAT imagery. The cyclone then turned northwest into the Denmark Strait on the 14th and 15th where it weakened.
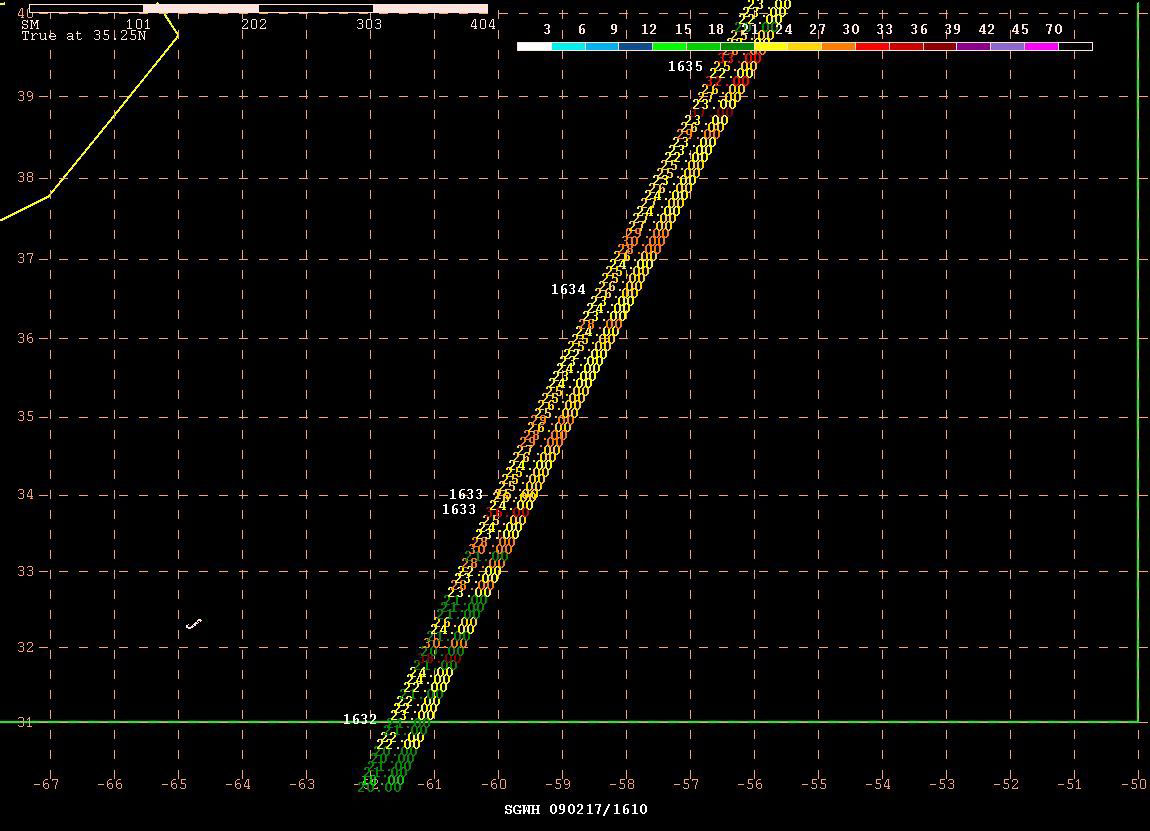
Figure 12. Jason satellite altimeter pass from approximately 1633 UTC February 17, 2009. The satellite track cuts through the storm in southwest to northeast direction within about one and one-half hours prior to the valid time of Figure 10. The image shows a swath of observed wave heights (feet) along the track of the satellite. The four-digit numbers to the left of the track are times (UTC) that the satellite passes over. (Click to enlarge)
North Atlantic Storm, March 17-18: This small and relatively compact cyclone formed on the stationary end of a north to south frontal zone as shown in Figure 15, and briefly developed hurricane force winds in a small area on the west side as it approached the Azores Islands. This was the only hurricane force cyclone to form in this part of the Atlantic during the four month period. In Figure 16 the high resolution scatterometer data shows a compact circulation and there appears to be one 70 kts wind barb just west of the low center. This is a case where hurricane force winds can accompany a low with a rather modest central pressure, in this case 994 hPa. The main cyclone then moved southeast and dissipated near Morocco while a northern center split off and moved north toward Iceland.
Southwestern North Atlantic Storm, March 24-26: This next development had a different origin, as low pressure intensified as it dropped southeast from Nova Scotia early on the 23rd. By 0600 UTC on the 25th the cyclone developed a lowest central pressure of 984 hPa near 39N 59W and hurricane force winds. Like the preceding event this system developed its strongest winds in the northwest semicircle. High resolution QuikSCAT data from late on March 24 revealed winds as high as 70 kts northwest of the center. Some ship and buoy reports are listed in Table 8. The cyclone subsequently drifted northeast and weakened to a stalled gale late on the 26th near 40N 54W before dissipating on the 28th.
North Atlantic Storm, Greenland and Iceland Area, March 31-April 4: There was frequent cyclonic activity in this area in late March and early April, with the strongest of these (in terms of winds) approaching Iceland from the southwest on March 1 and then turned west toward Greenland, before looping back to the southwest on April 1 and 2, when it developed winds to 65 kts from the north and northeast near the southeast coast of Greenland late on the 1st and early on the 2nd. These winds appeared in high resolution scatterometer imagery, in an area lacking ship data. This cyclone then merged with a stronger system passing to the east early on the 4th near 62N 33W with a 983 hPa central pressure before drifting southeast and dissipating south of Iceland on the 7th.
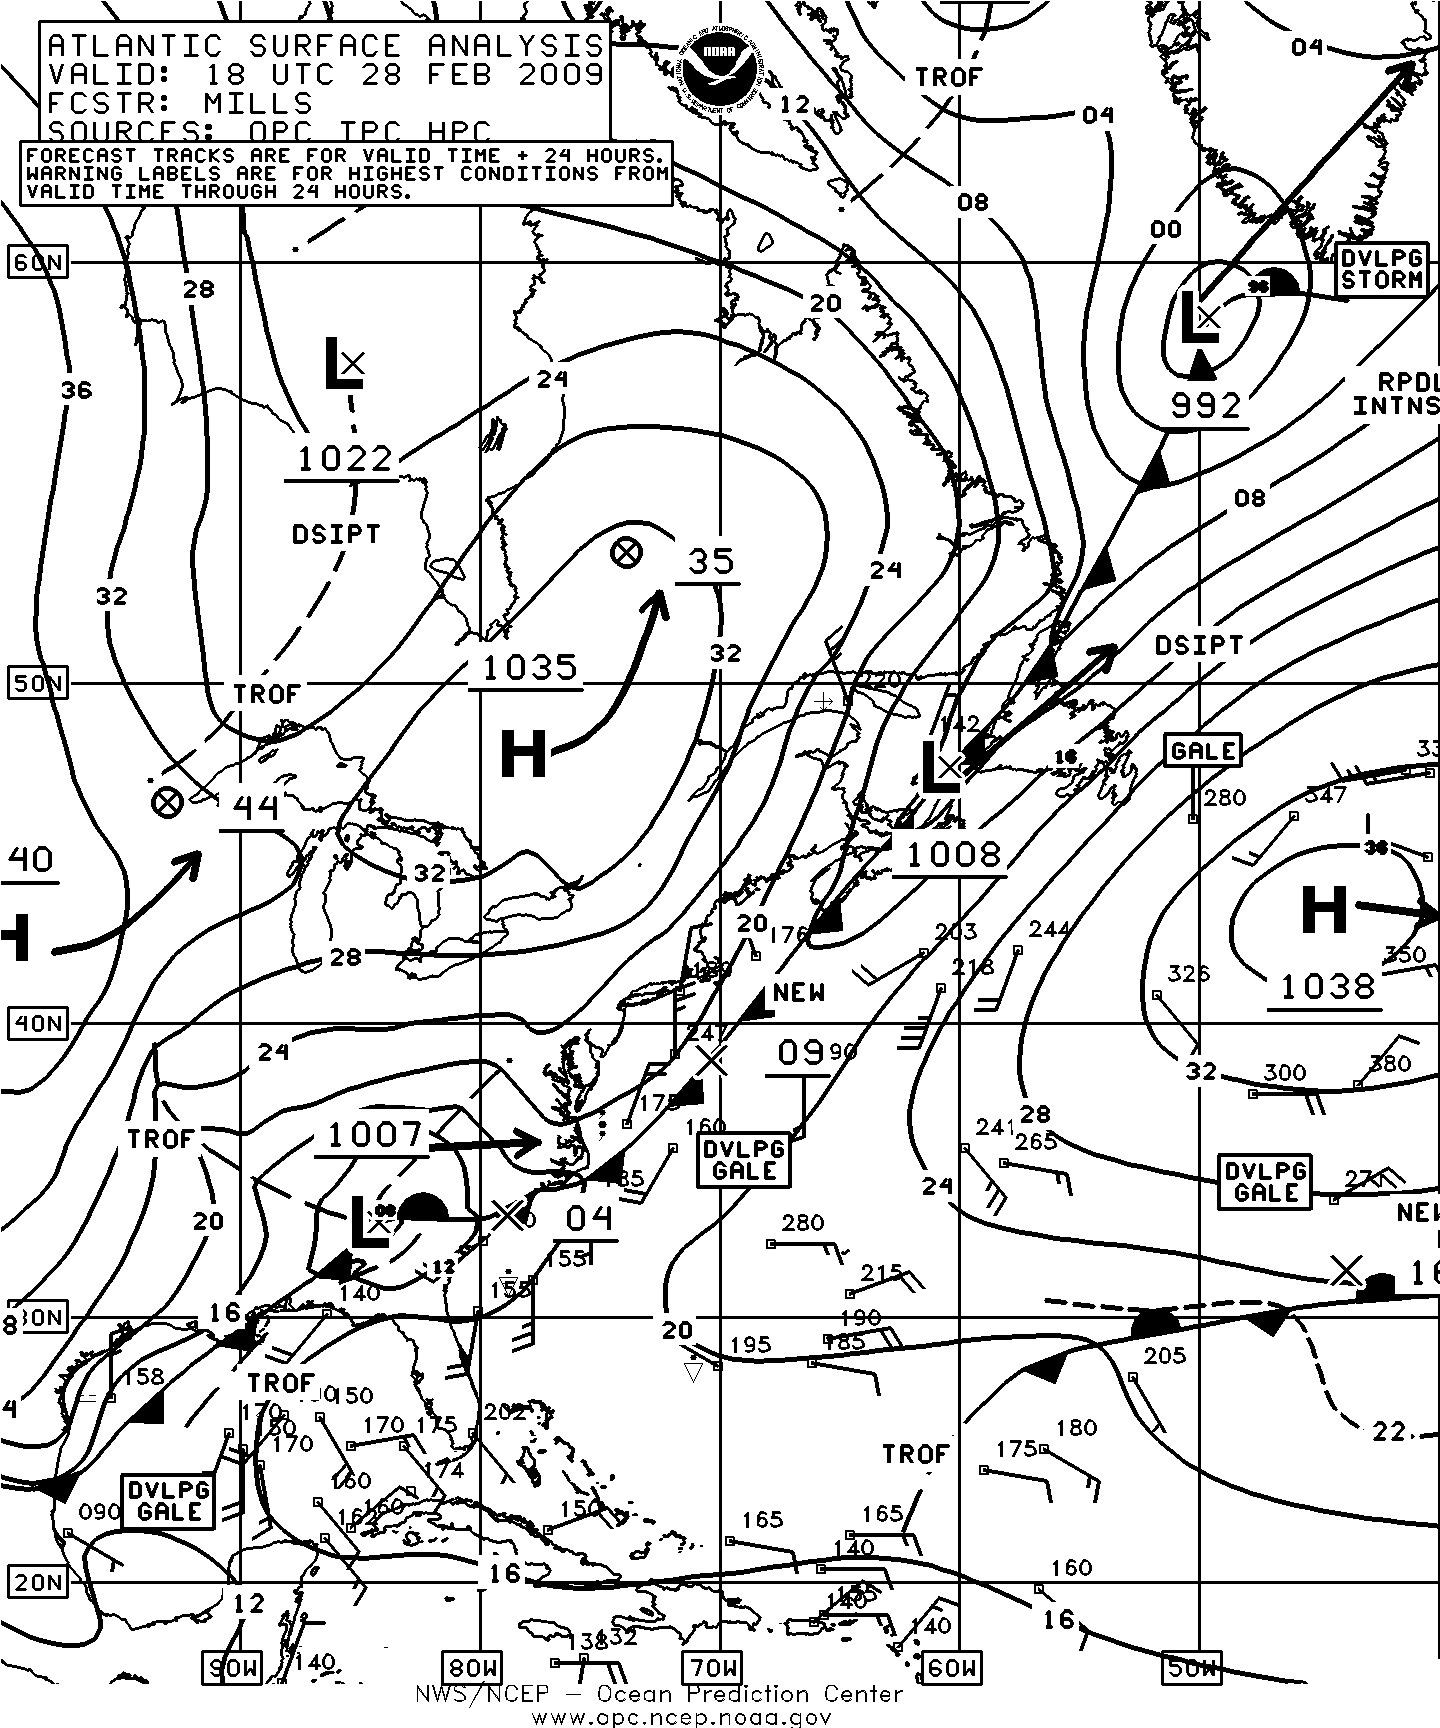
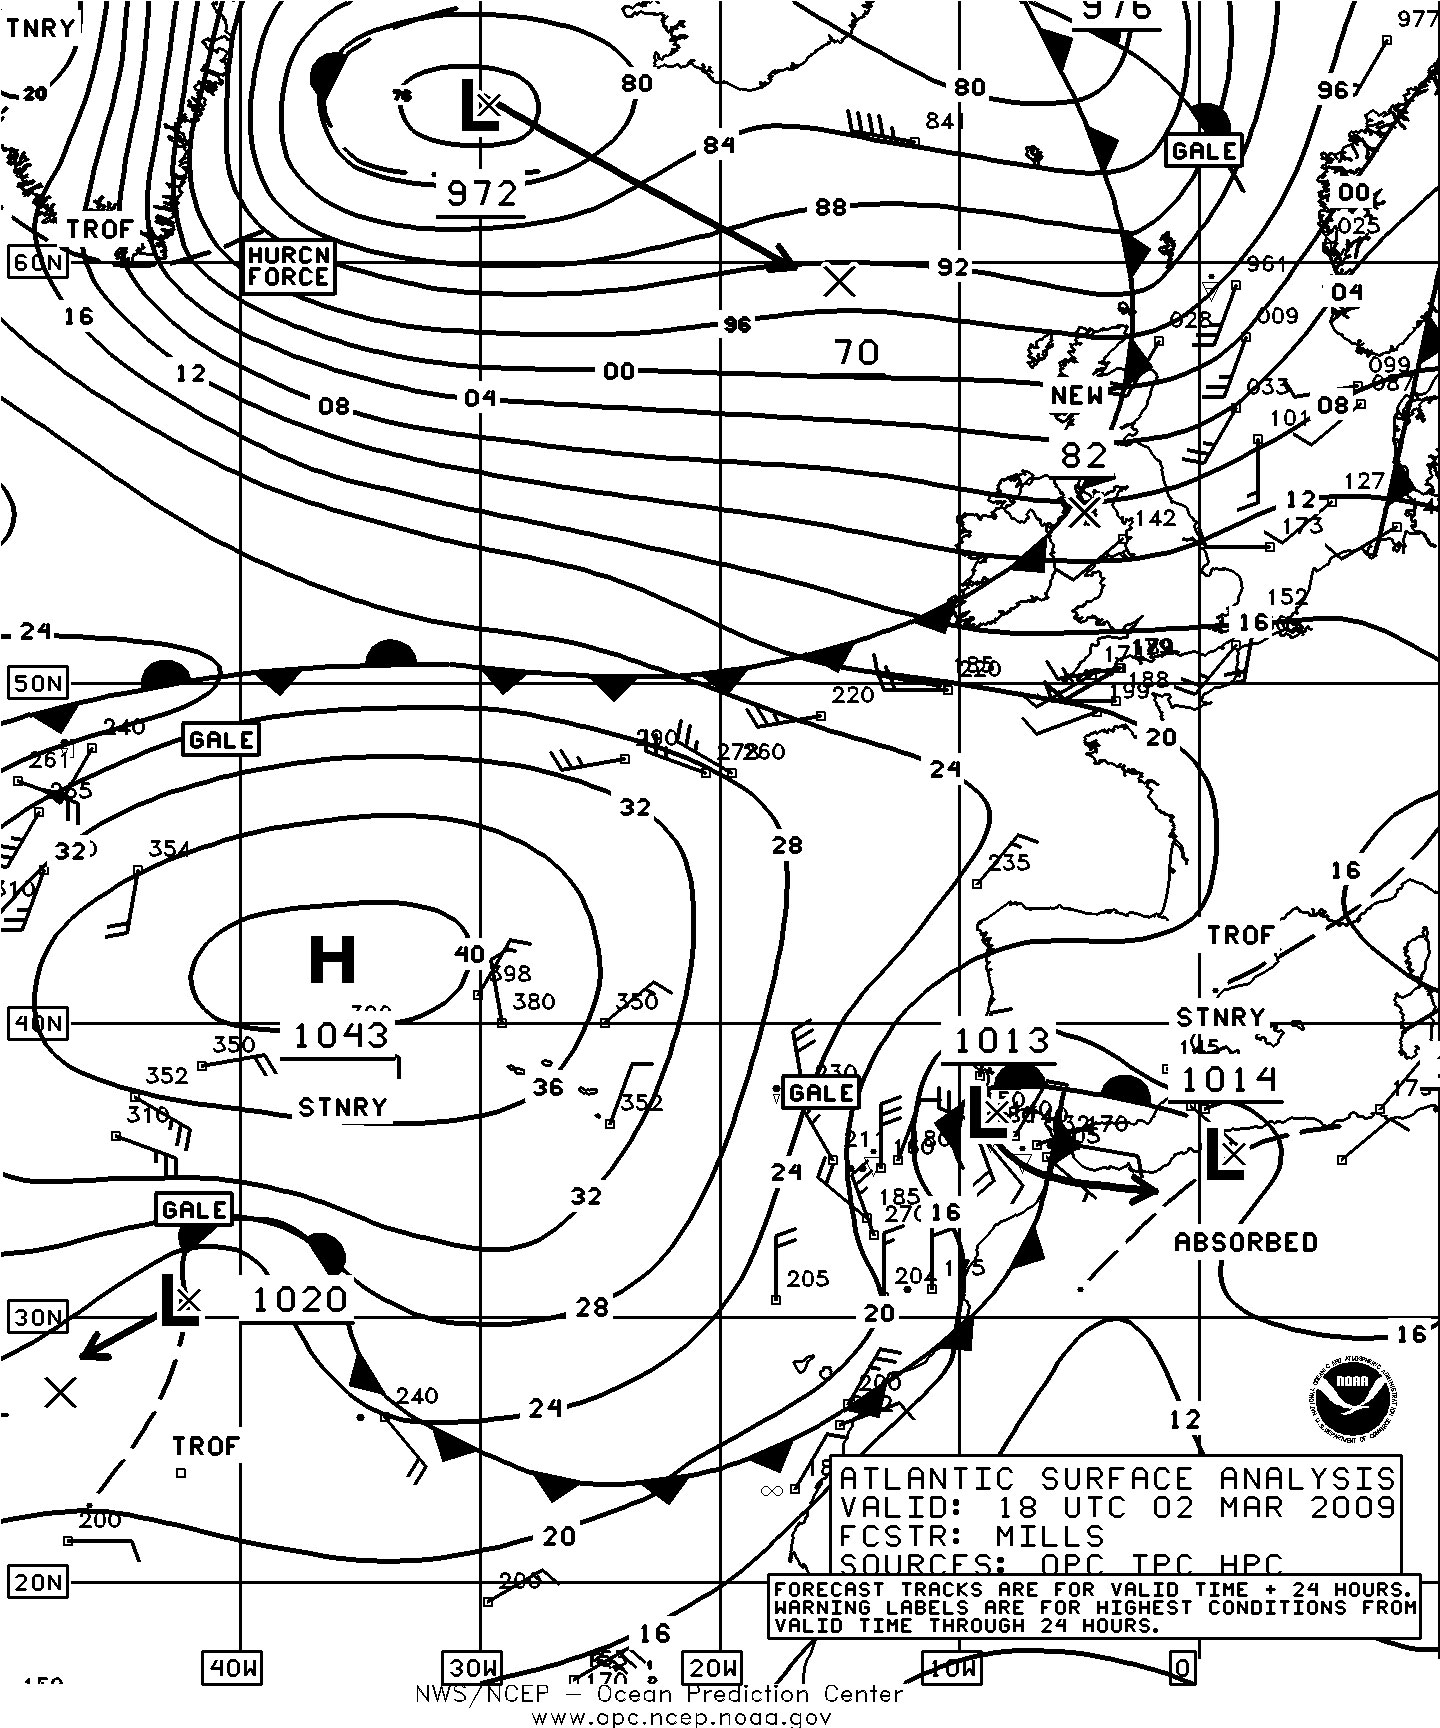
Figure 13. OPC North Atlantic Surface Analysis charts valid 1800 UTC February 28 (Part 2) and 1800 UTC March 2, 2009 (Part 1).(Click to enlarge)
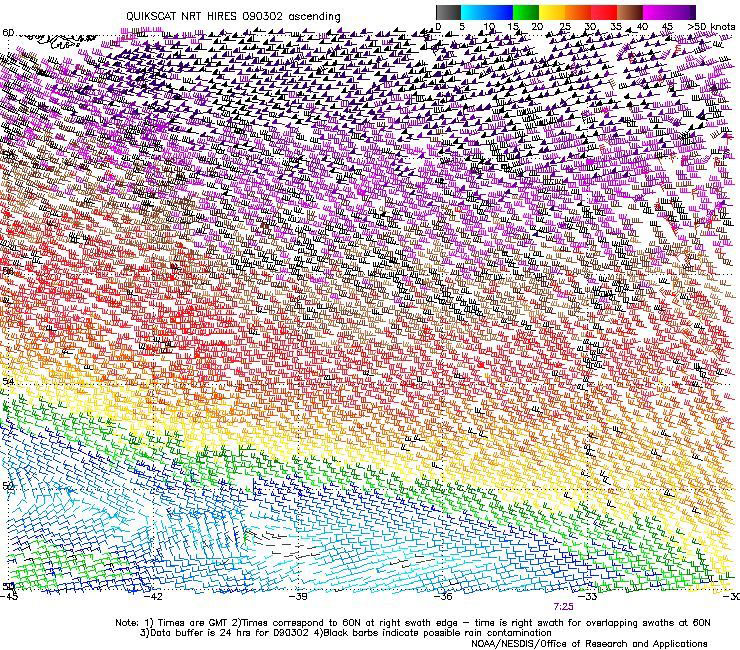
Figure 14. High resolution QuikSCAT scatterometer image of satellite sensed winds on the south side of storm shown in Figure 13. The valid time of the pass is 2109 UTC March 2, 2009, or about three hours later than the valid time of the second part of Figure 13. The southern tip of Greenland appear near the upper left corner of the image. Image is courtesy of NOAA/ NESDIS/Office of Research and Applications. (Click to enlarge)
North Atlantic Storm, April 29-May 1: The storm track shifted north with the last major storm of the period originating near Newfoundland early on the 29th and tracking northeast as depicted in Figure 19. The second part of Figure 19 shows the storm at maximum intensity. Hurricane force winds developed on the night of the 29th and lasted until the end of the month. Figure 20 has high resolution scatterometer data revealing numerous wind barbs in the 60 to 70 kts range on the south side of the low and there appears to be one 80 kts barb. Some of the Grand Banks platforms reported west winds to 45 kts as the intensifying low passed to the north early on the 29th. At 0000 UTC April 30 the ship SCKB (45N 40W) reported west winds of 60 kts and seas 5.0 m (17 ft). The same vessel encountered west winds of 55 kts and seas 9.0 m (30 ft) near 45N 41W six hours later. The ship V2PS8 (62N 11) northeast of the cyclone reported southeast winds of 40 kts at 0600 UTC May 1. The cyclone continued on a northeastward track as May began but began to weaken.
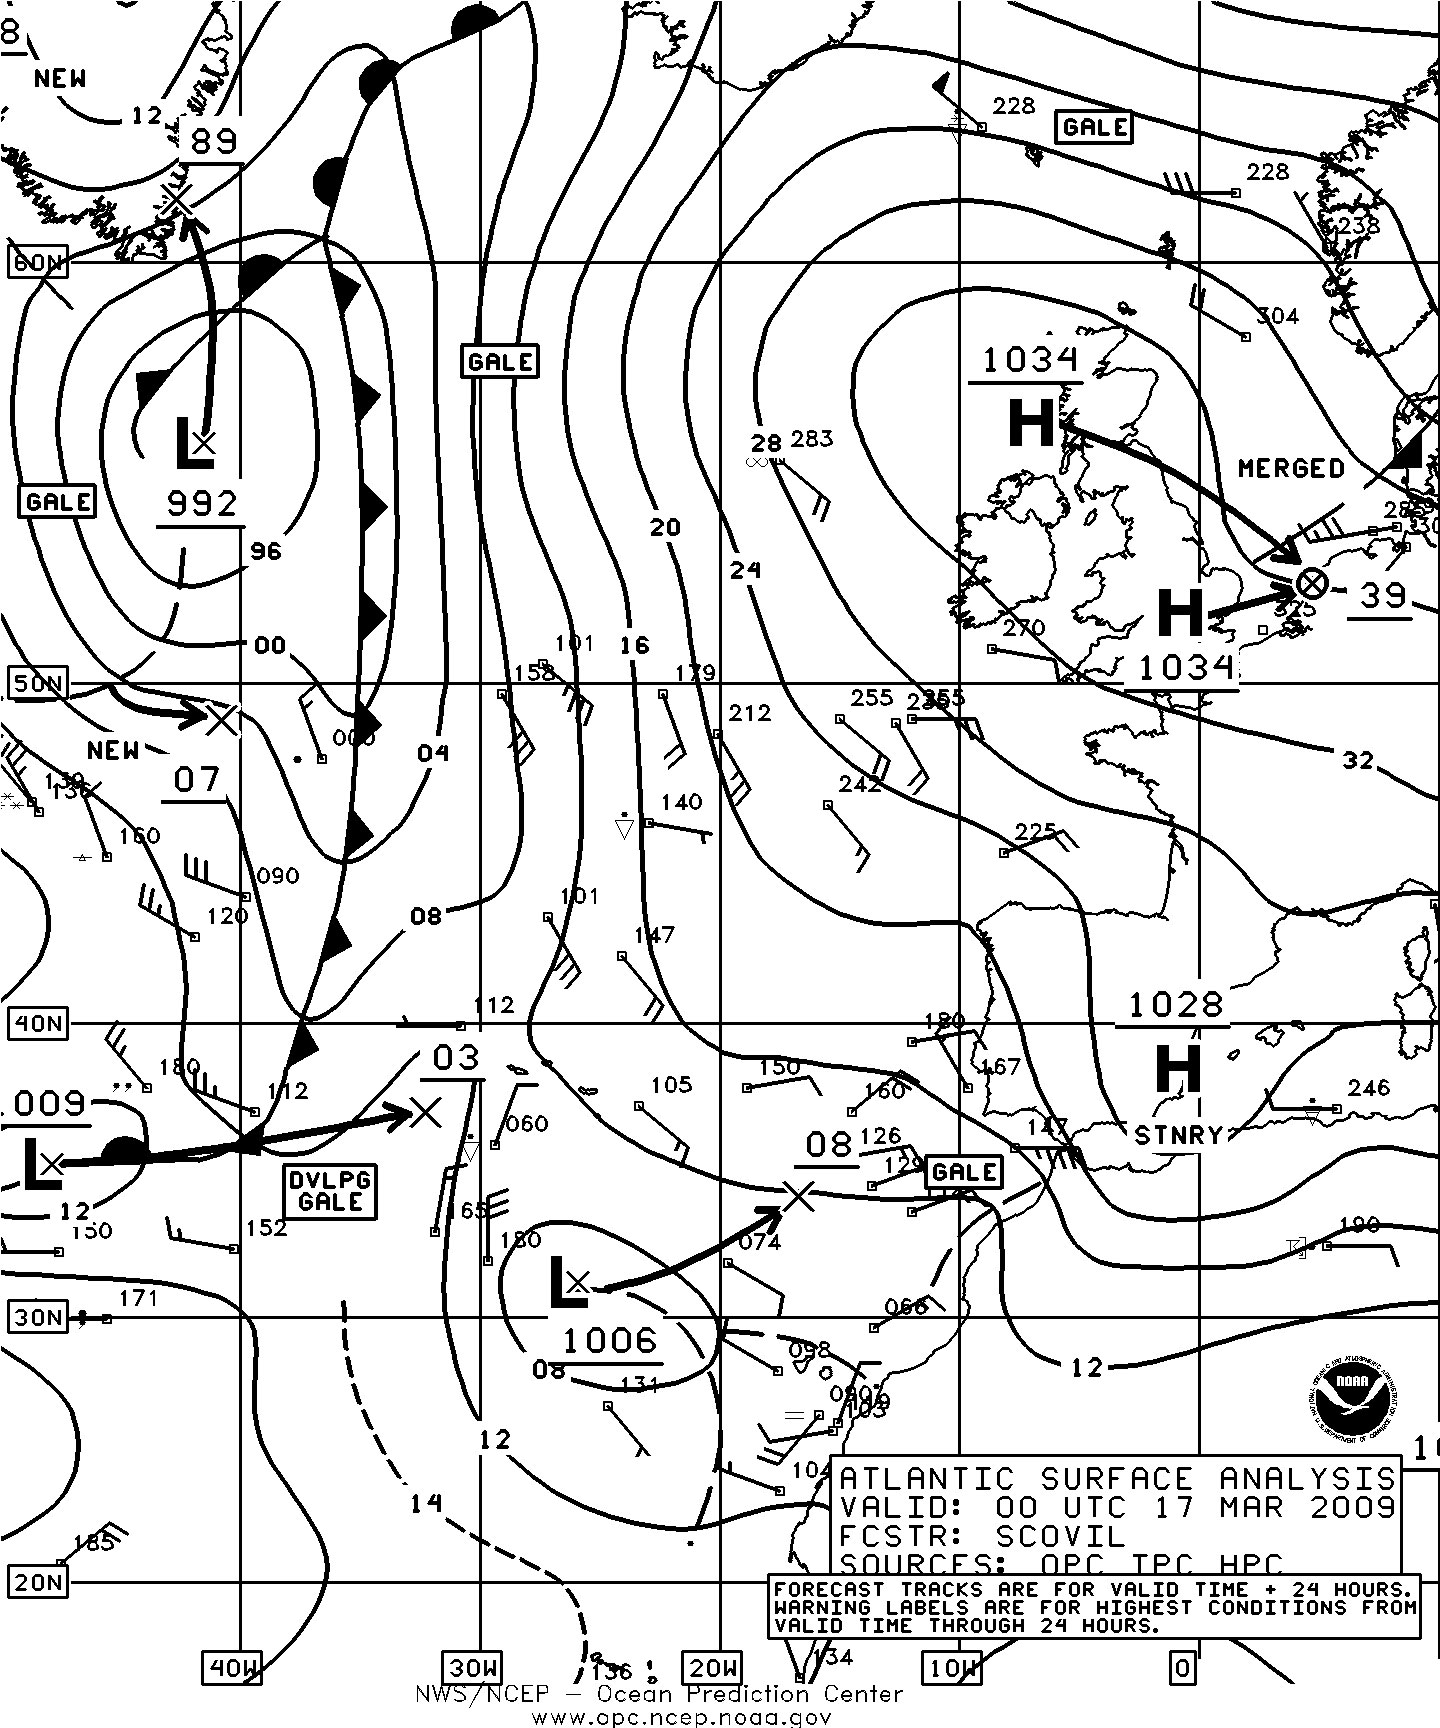
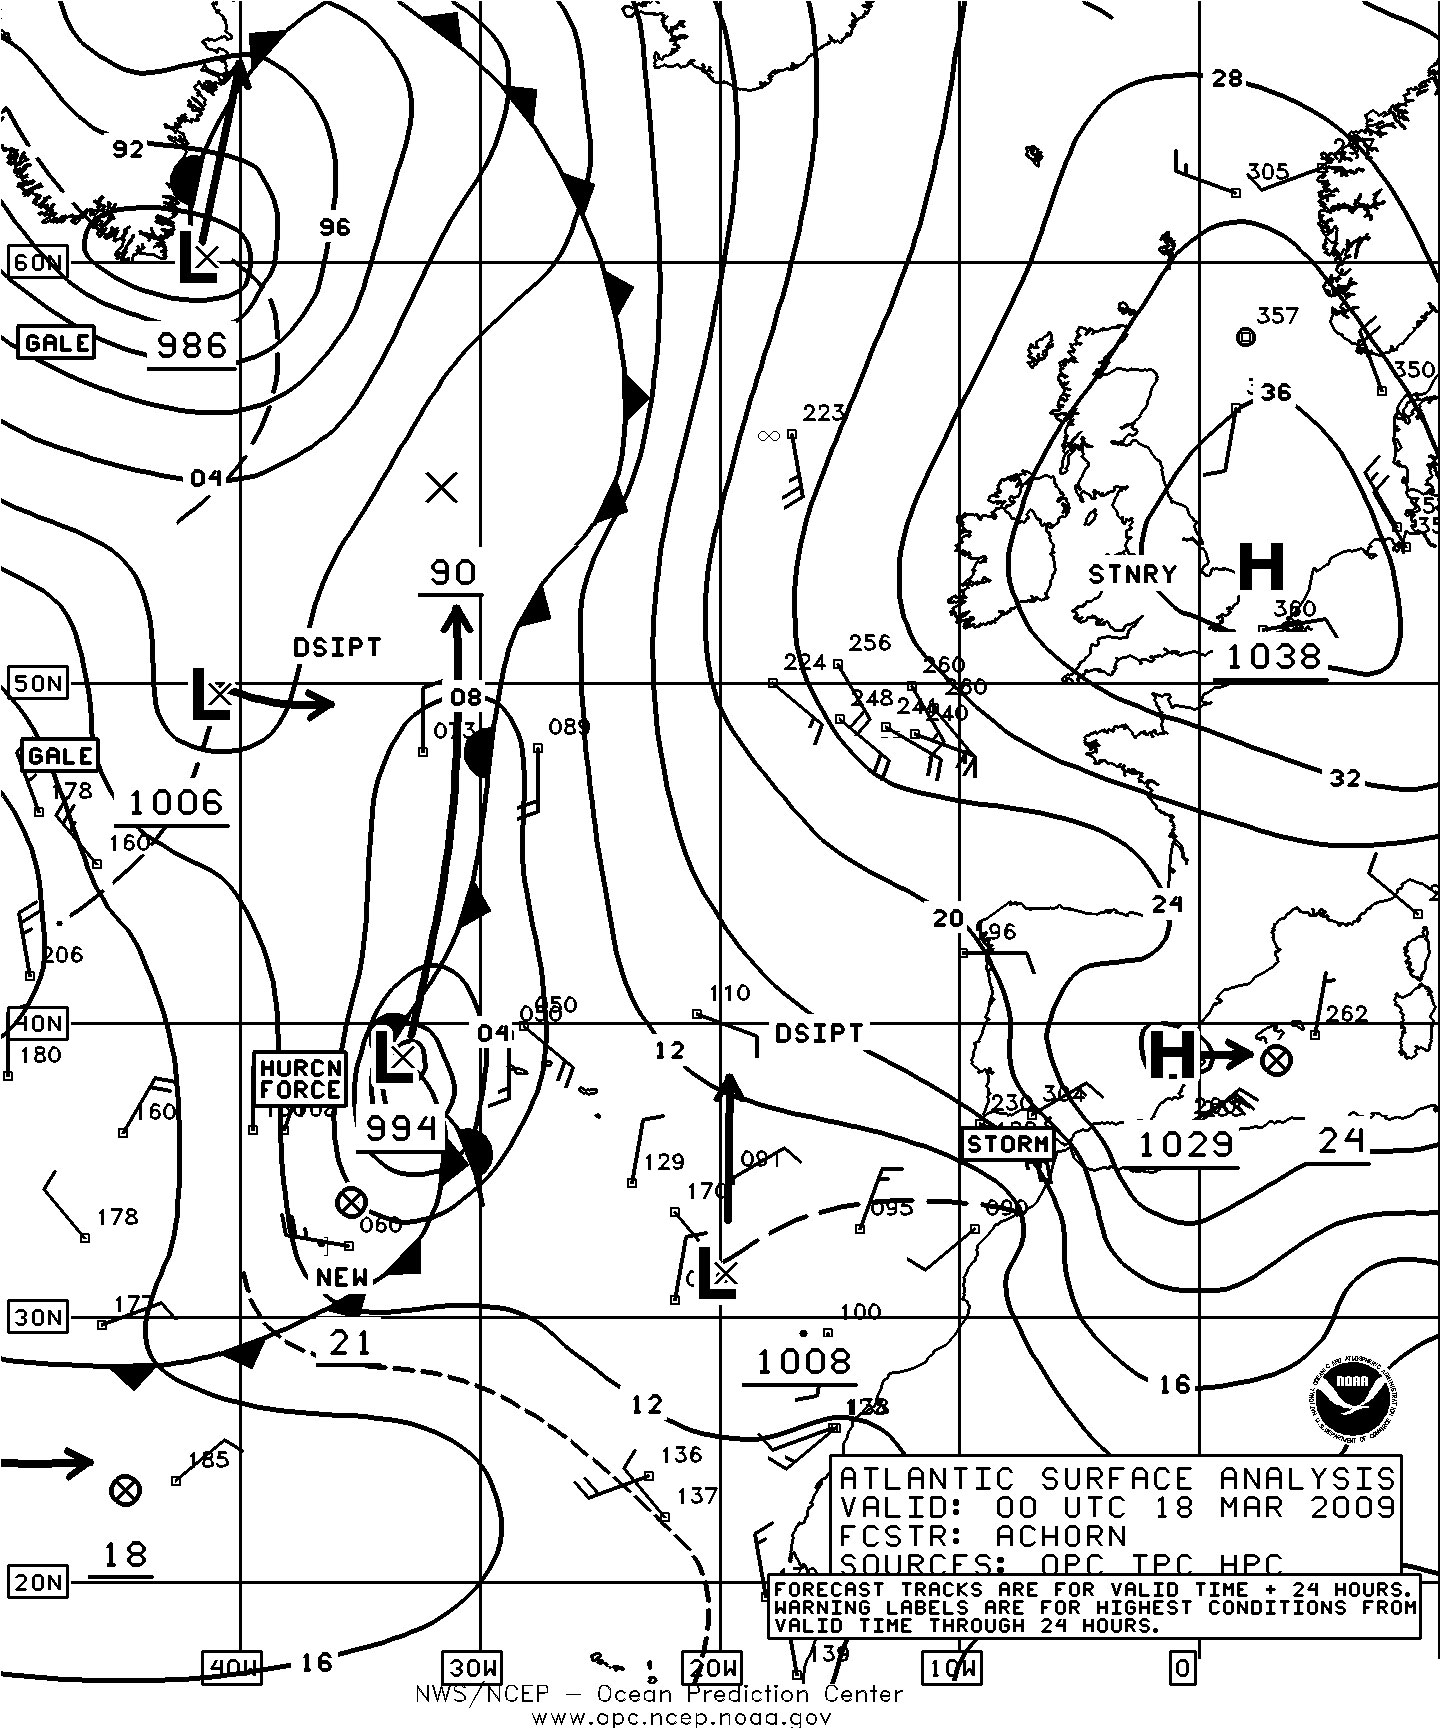
Figure 15. OPC North Atlantic Surface Analysis charts (Part 1) valid 0000 UTC March 17 and 18, 2009.(Click to enlarge)
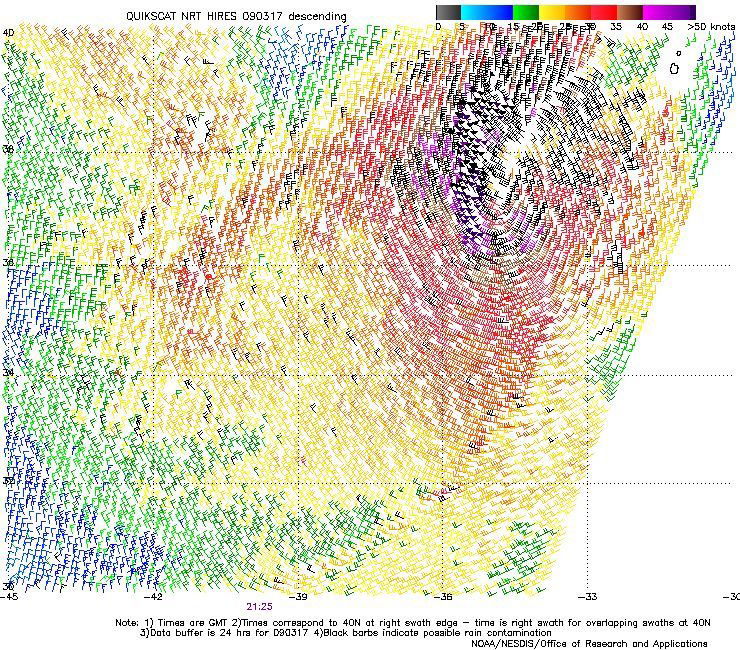
Figure 16. High resolution QuikSCAT scatterometer image of satellite sensed winds around the storm shown in Figure 15. The valid time of the pass is 2125 UTC March 17, 2009, or about two and one half hours prior to the valid time of the second part of Figure 15. The center of the storm is near 38N 35W in the upper-right portion of the image. Image is courtesy of NOAA/ NESDIS/ Office of Research and Applications. (Click to enlarge)
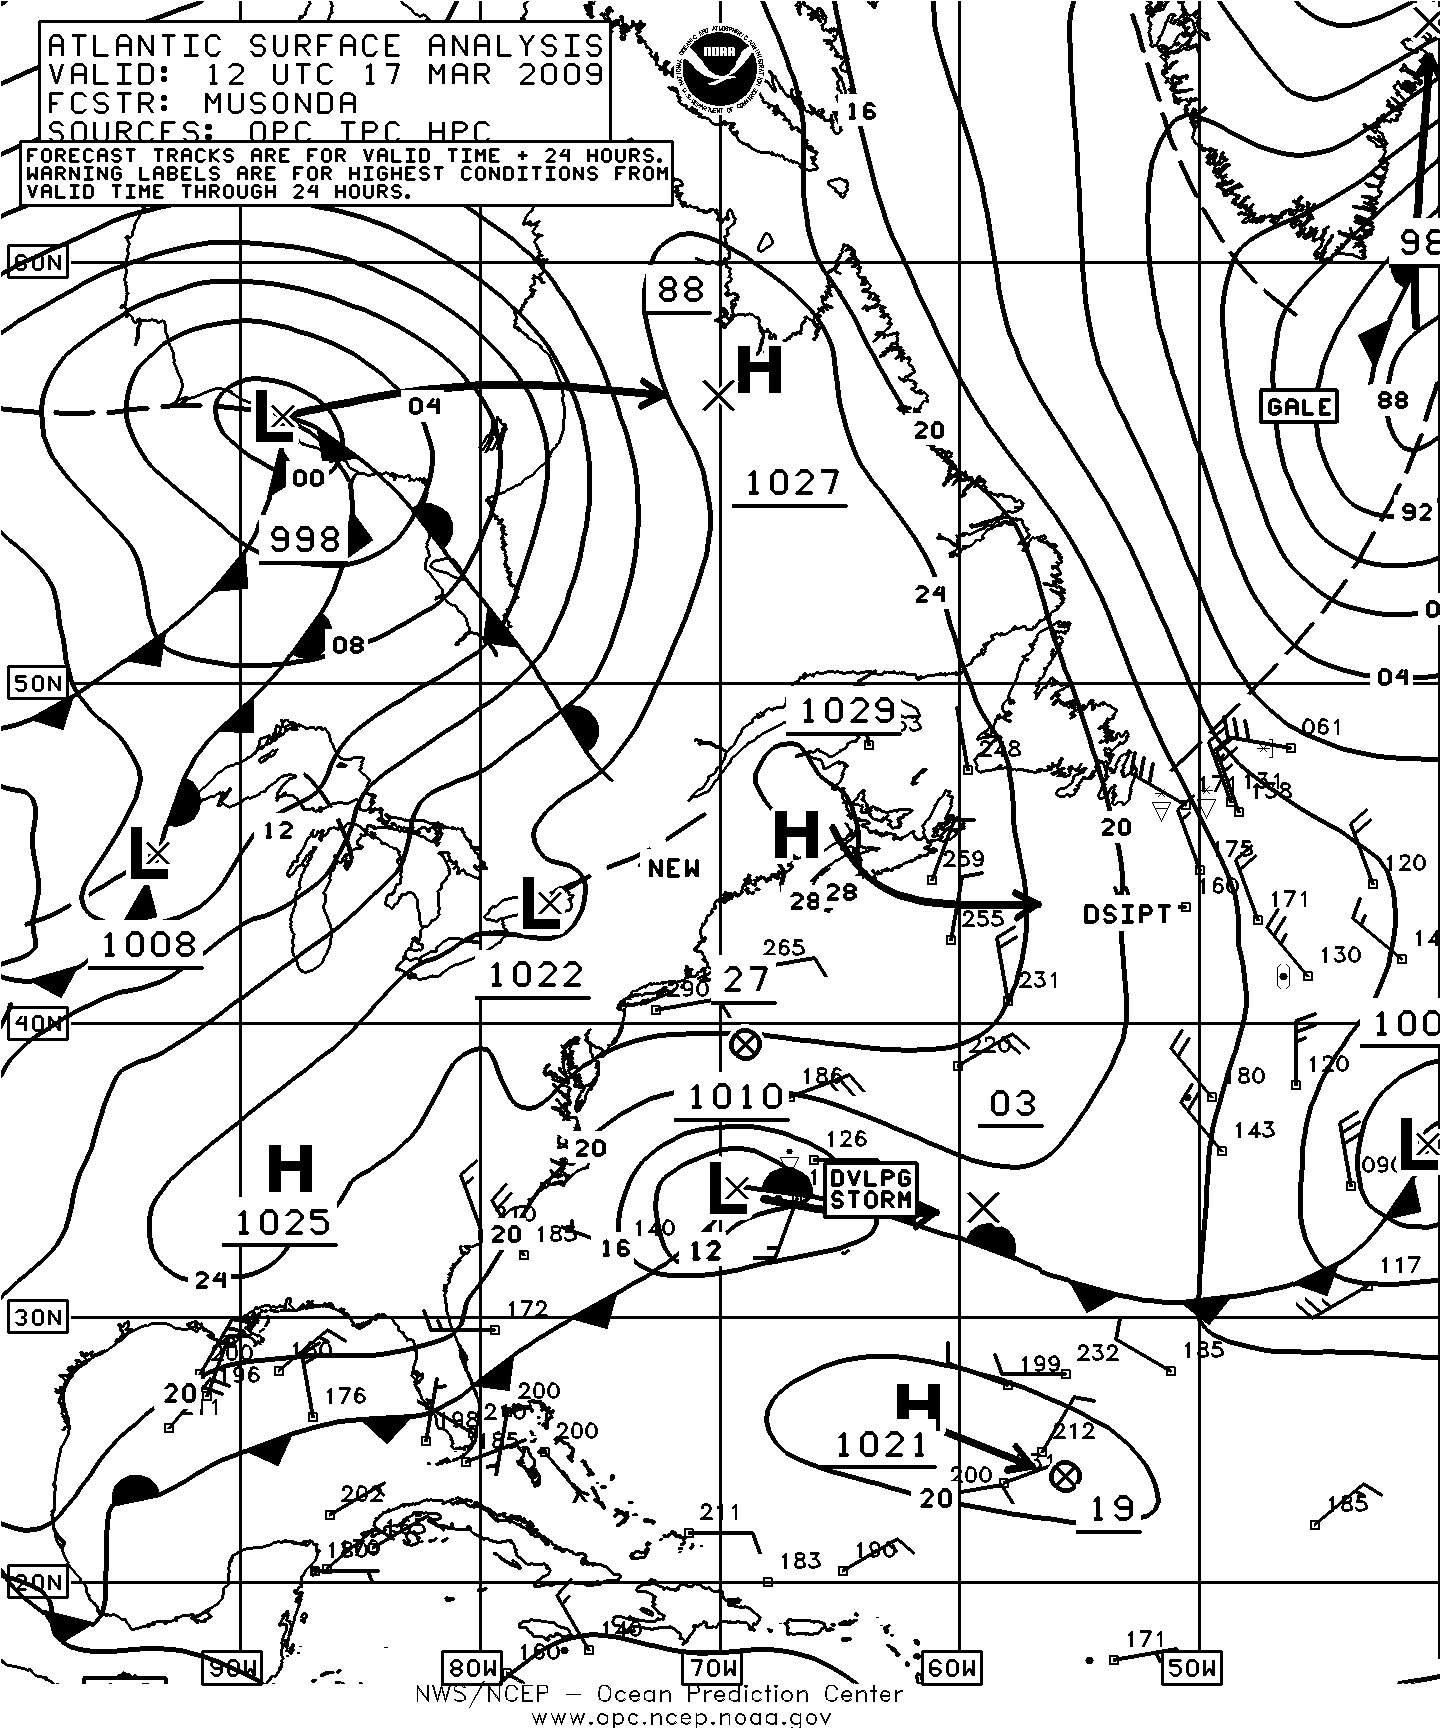
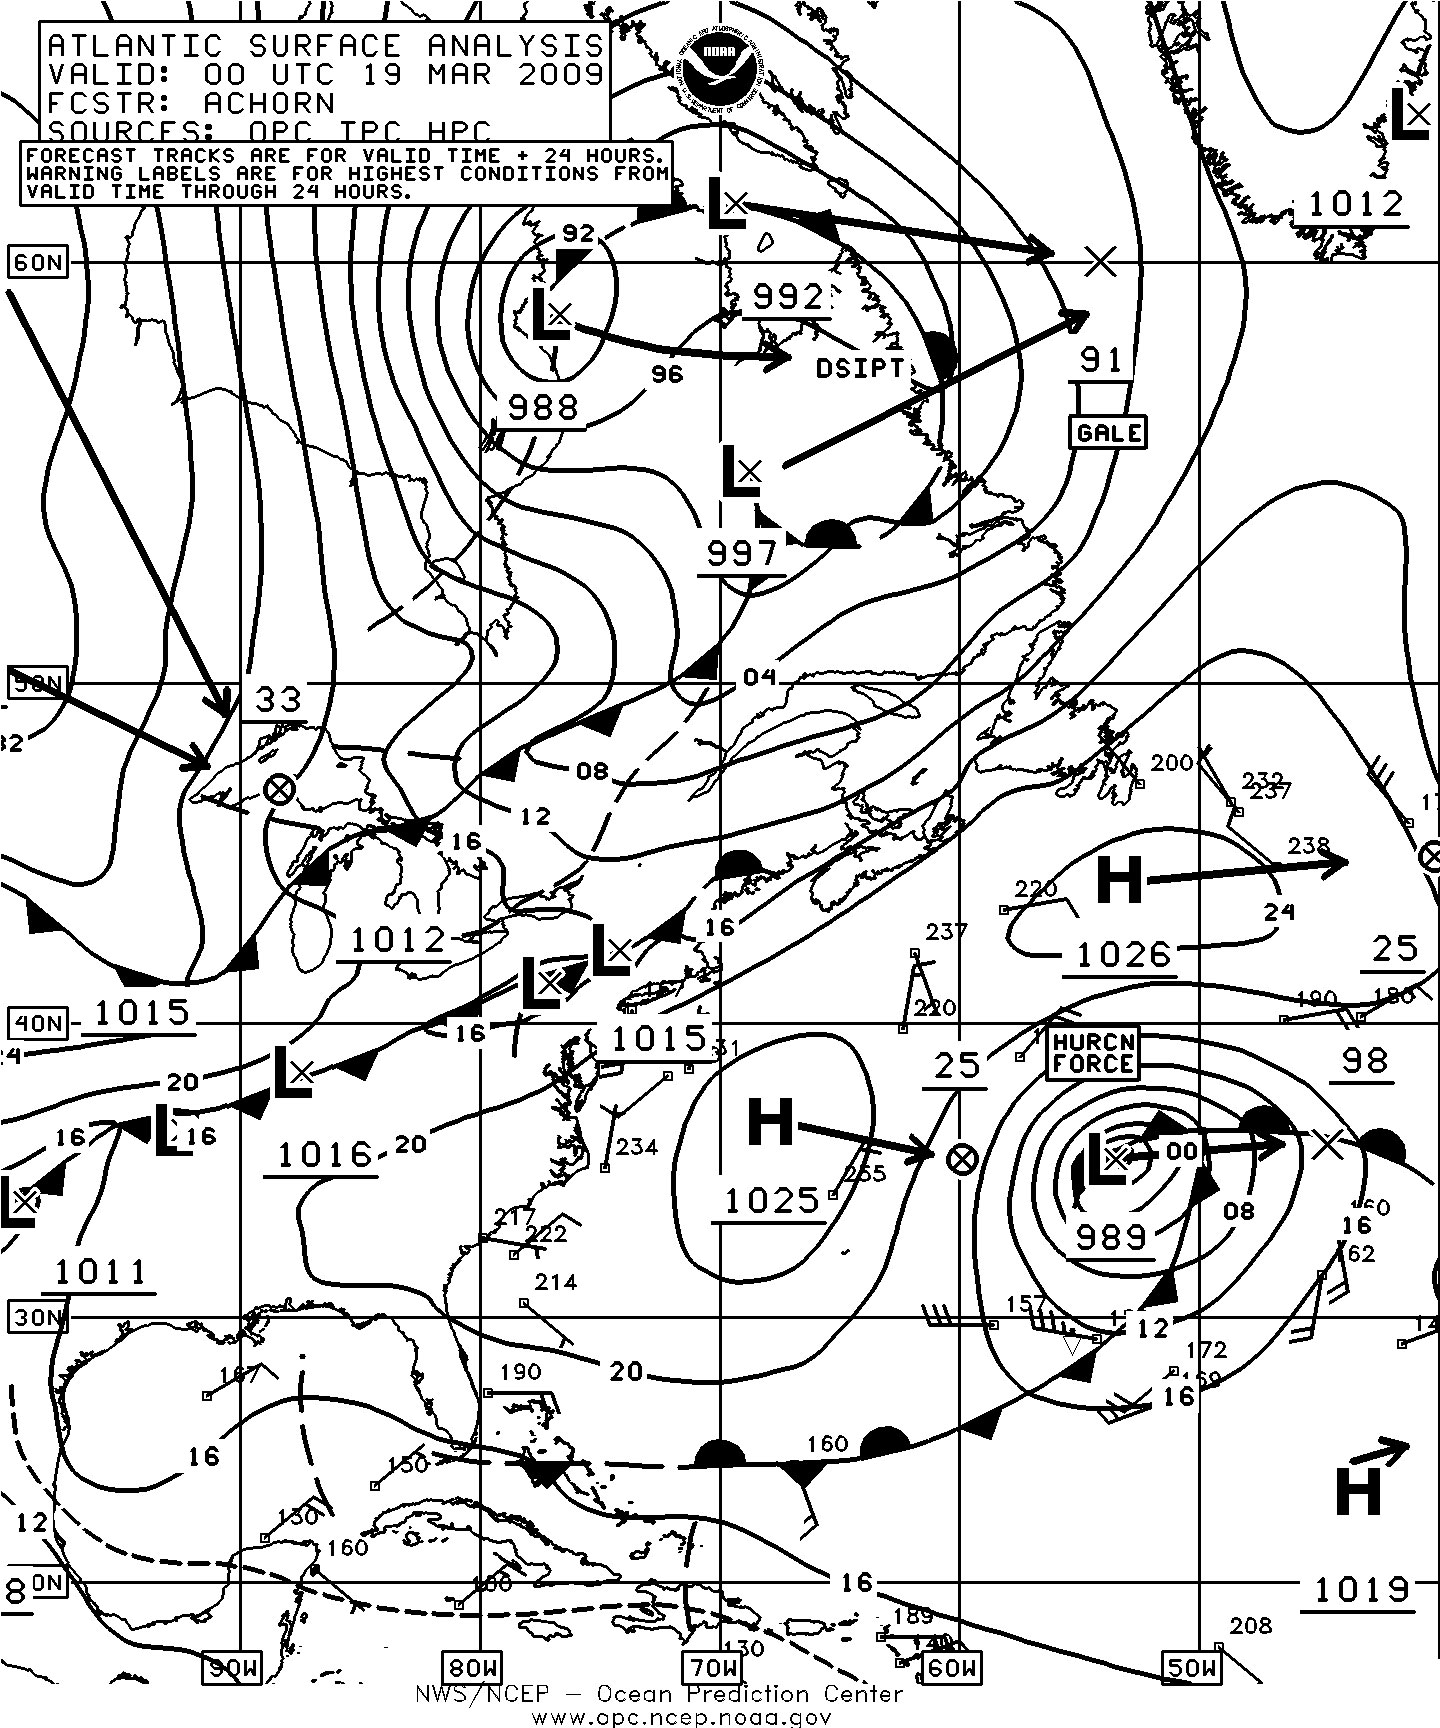
Figure 17. OPC North Atlantic Surface Analysis charts (Part 2) valid 1200 UTC March 17 and 0000 UTC March 19, 2009.(Click to enlarge)
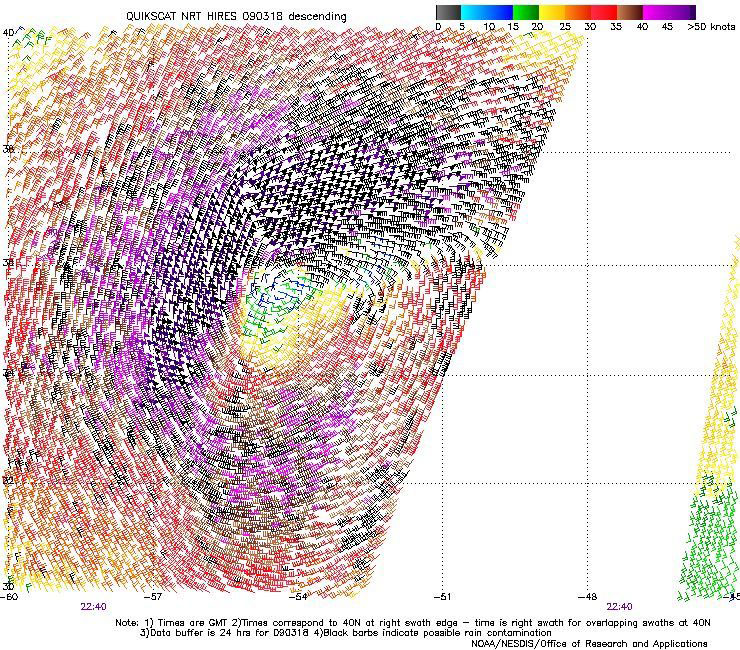
Figure 18. High resolution QuikSCAT scatterometer image of satellite sensed winds around the storm shown in the second part of Figure 17. The valid time of the pass is 2240 UTC March 18, 2009, or about two hours prior to the valid time of the second part of Figure 17. The center of the storm appears near 36N 55W in the left-center part of the image. Image is courtesy of NOAA/NESDIS/Office of Research and Applications. (Click to enlarge)
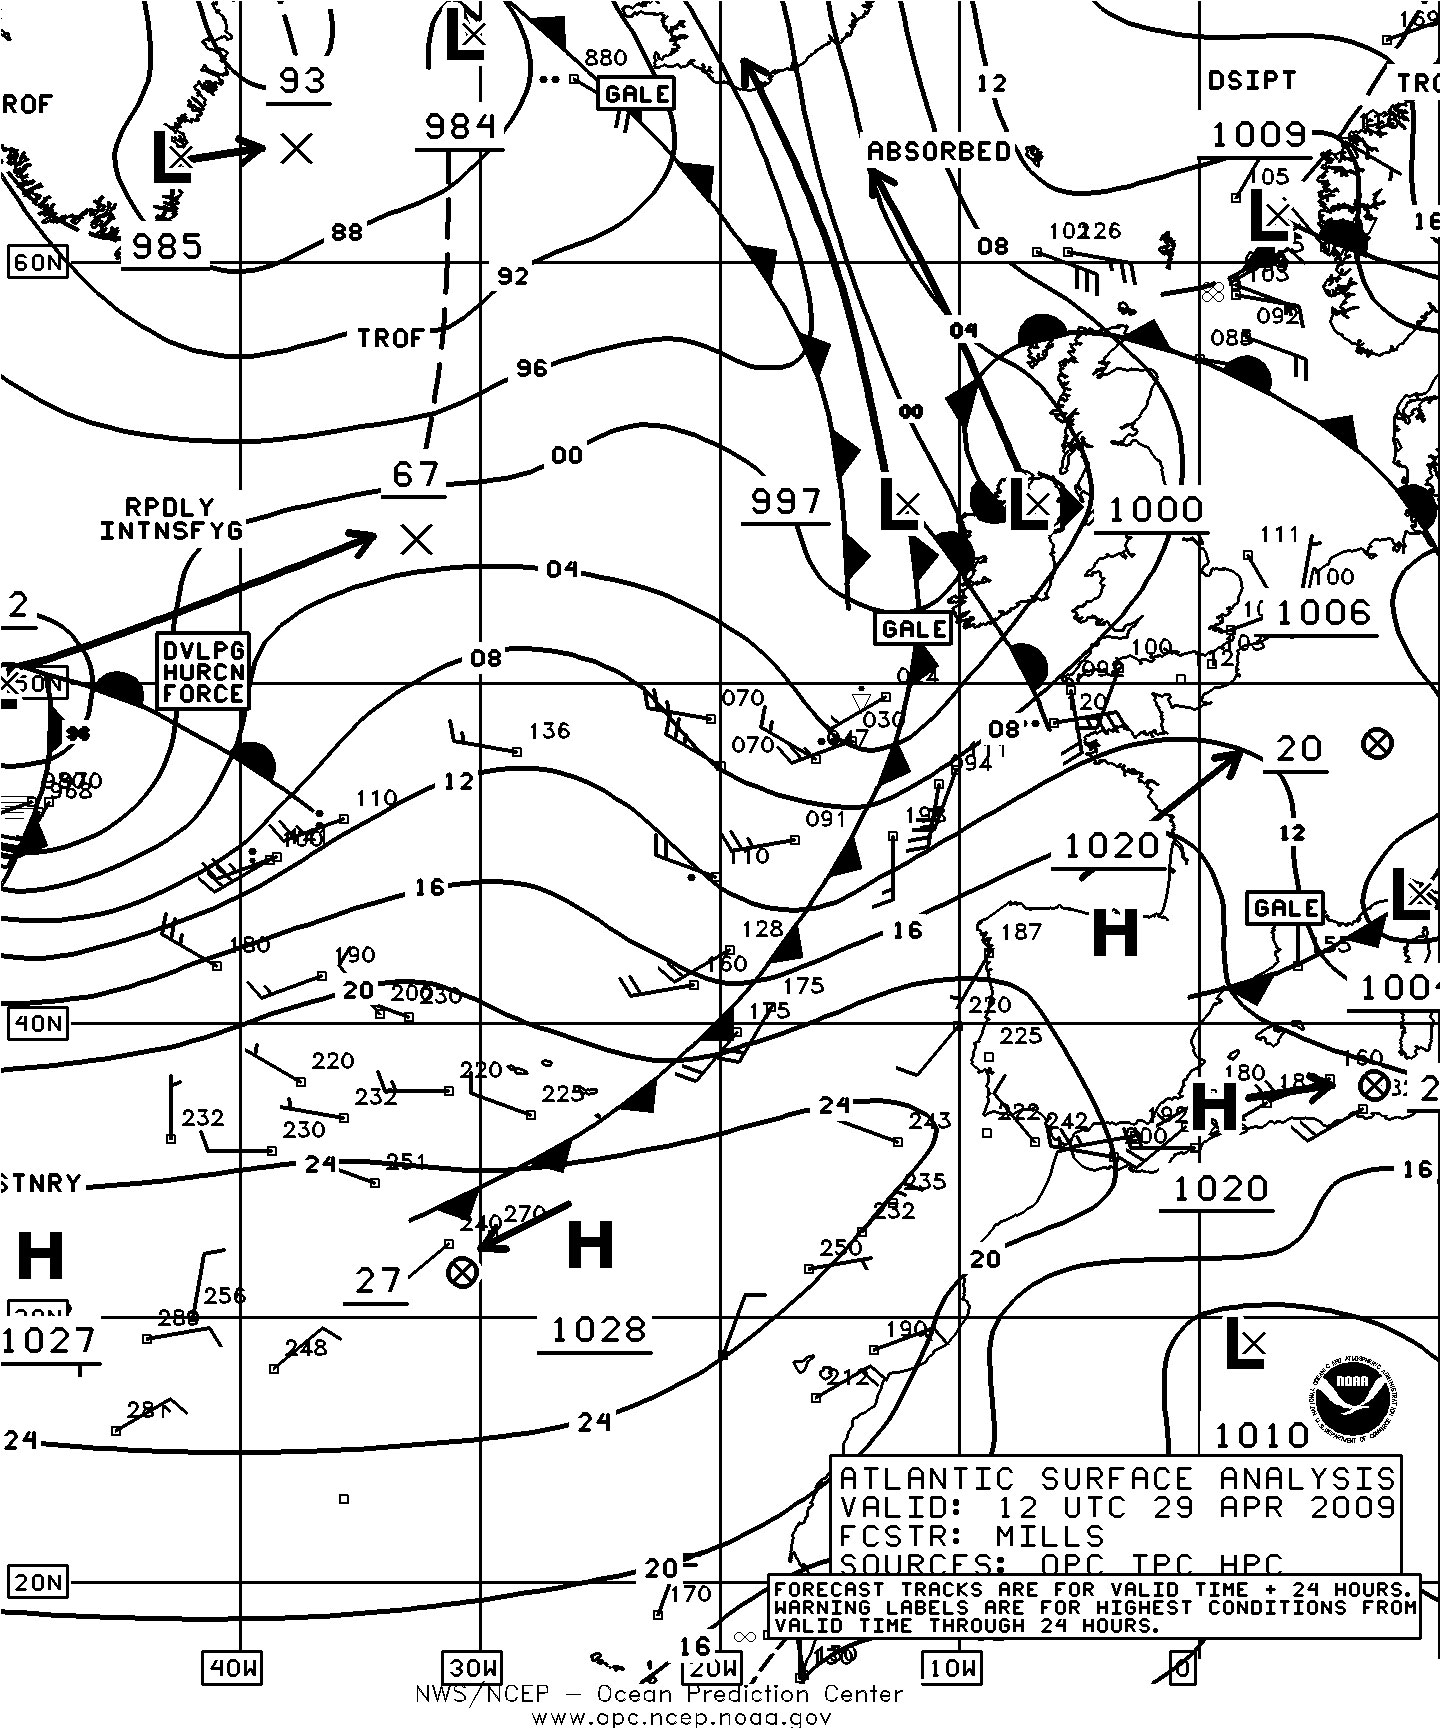
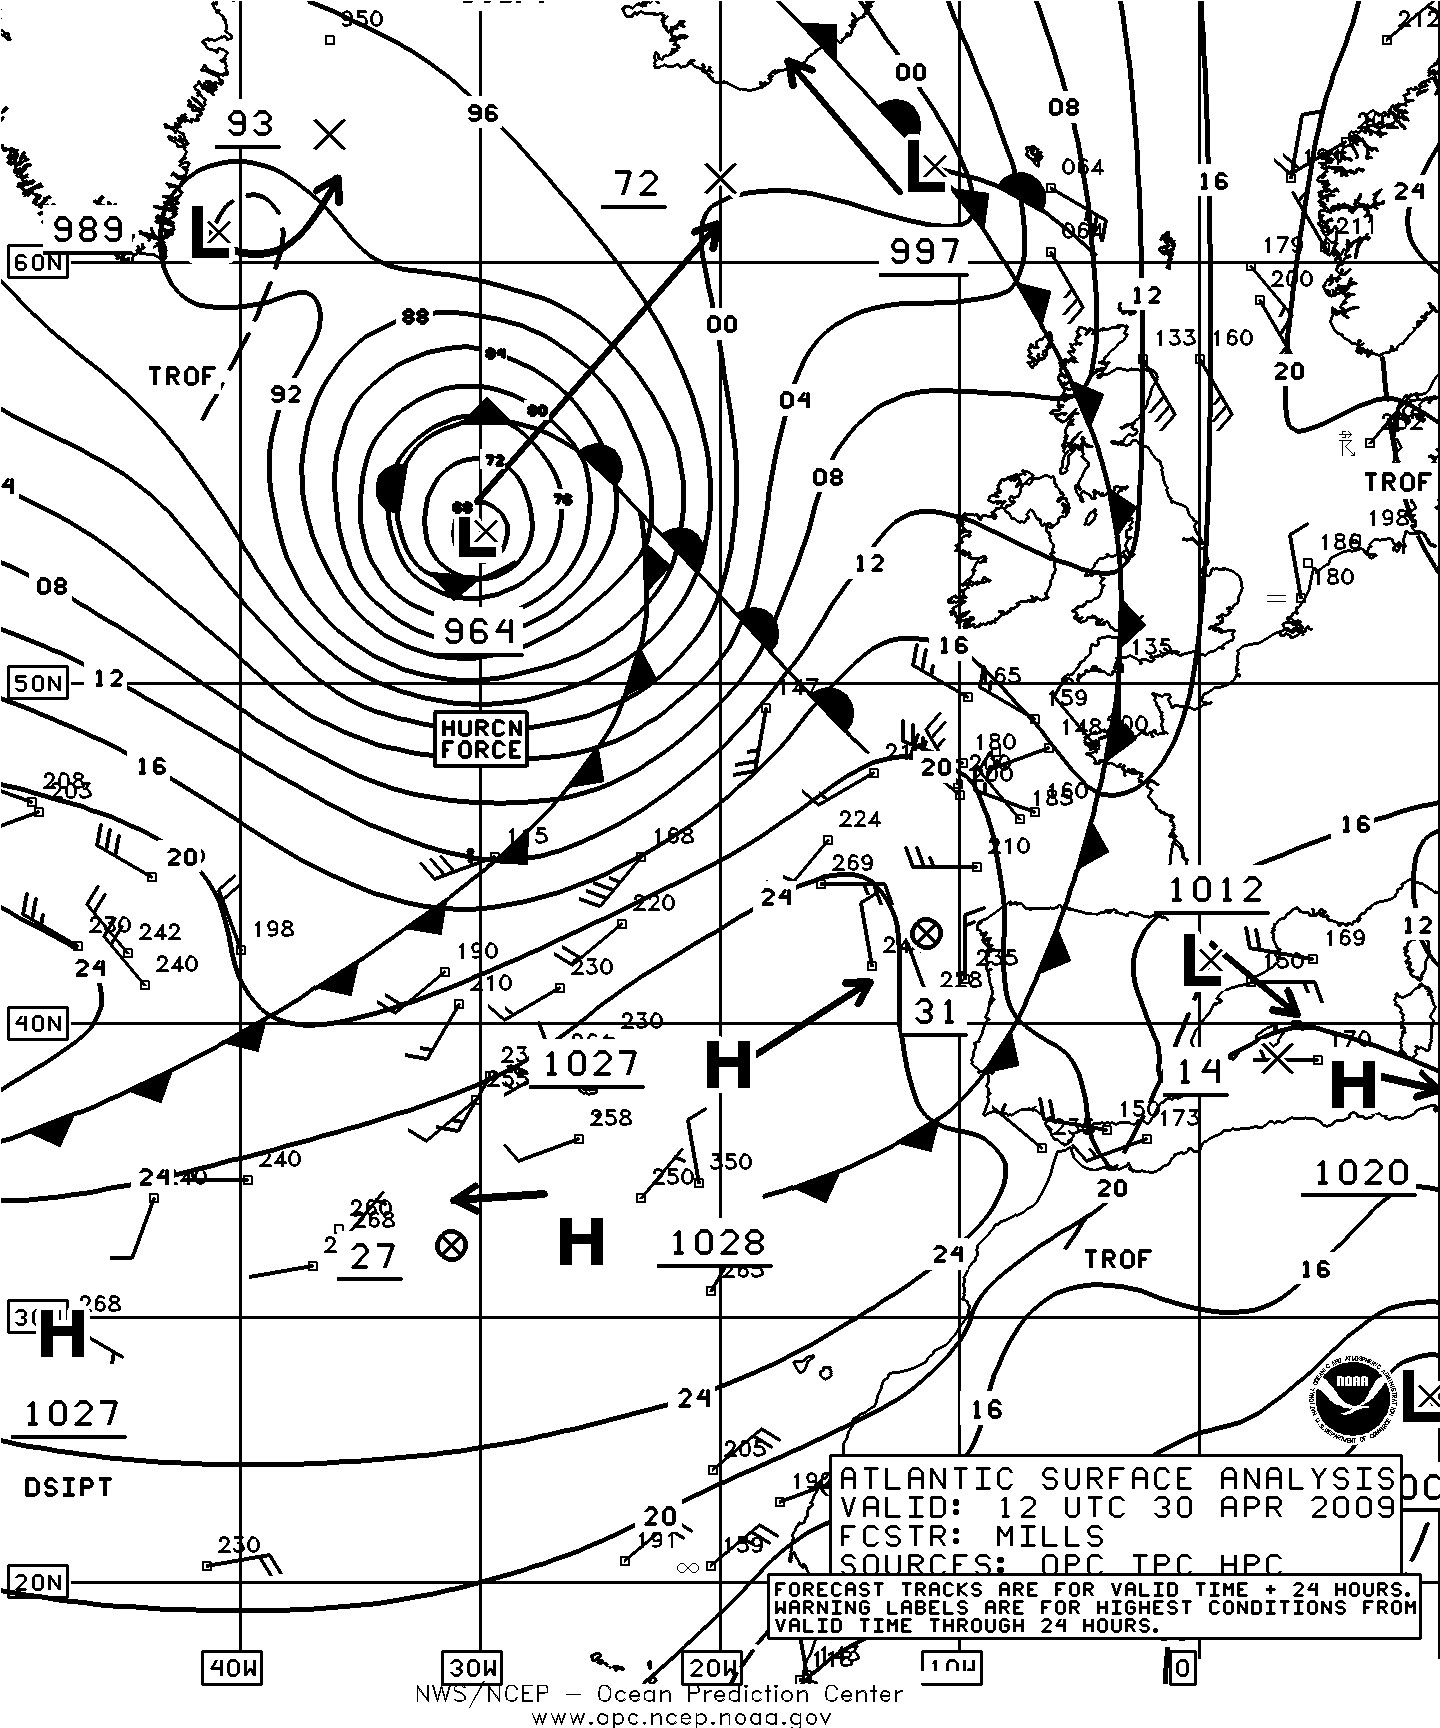
Figure 19. OPC North Atlantic Surface Analysis charts (Part 1) valid 1200 UTC April 29 and 30, 2009. (Click to enlarge)
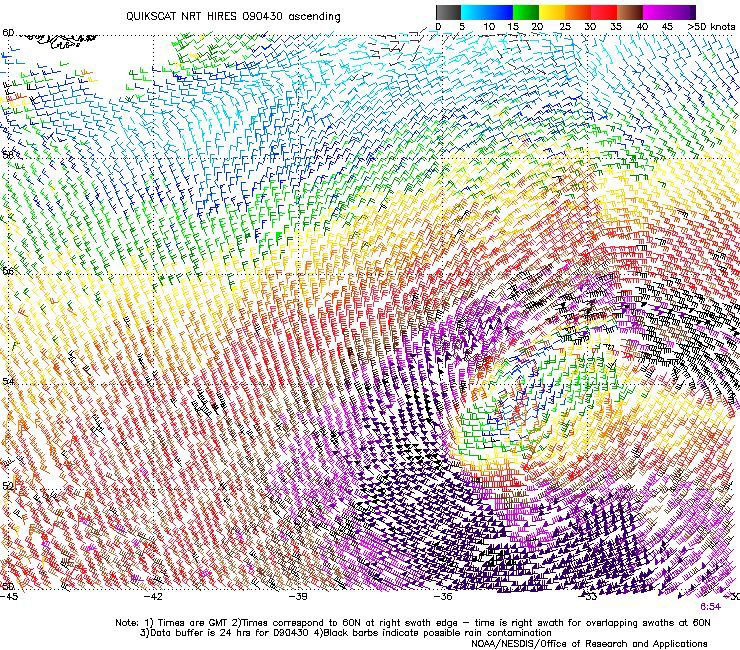
Figure 20. High resolution QuikSCAT scatterometer image of satellite sensed winds around the storm shown in the second part of Figure 19. The valid time of the image is 0654 UTC April 30, 2009, or about five and one half hours prior to the valid time of the second part of Figure 19. Image is courtesy of NOAA/NESDIS/ Office of Research and Applications.(Click to enlarge)
References
Von Ahn, Joan. and Sienkiewicz, Joe, Hurricane Force Extratropical Cyclones Observed Using QuikSCAT Near Real Time Winds, Mariners Weather Log, Vol. 49, No. 1, April 2005.
http://en.wikipedia.org/wiki/2009_ Pacific_typhoon_season.html
Bancroft, George, Marine Weather Review North Atlantic Area September to December 2008, Mariners Weather Log, Vol. 52, No. 4, April 2009.
QuikSCAT in the Ocean Prediction Center, http://www.opc.ncep.noaa. gov/quikscat/index.shtml
Sienkiewicz, Joe and Chesneau, Lee, Mariners Guide to the 500 Millibar Chart, Mariners Weather Log, Vol. 52, Number 3, December 2008
Saffir-Simpson Scale of Hurricane Intensity, http://www.nhc.noaa.gov/ aboutsshs.shtml
Back to top