Mean Circulation Highlights and Climate Anomalies January through April 2009
Anthony Artusa, Meteorologist, Climate Operations Branch, Climate Prediction Center NCEP/NWS/NOAA
January-February 2009
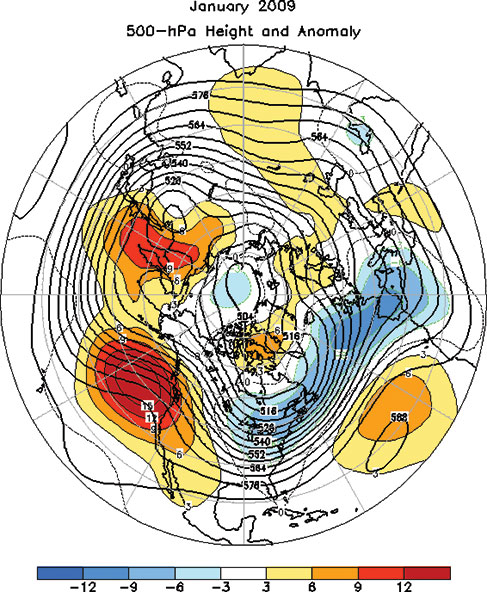
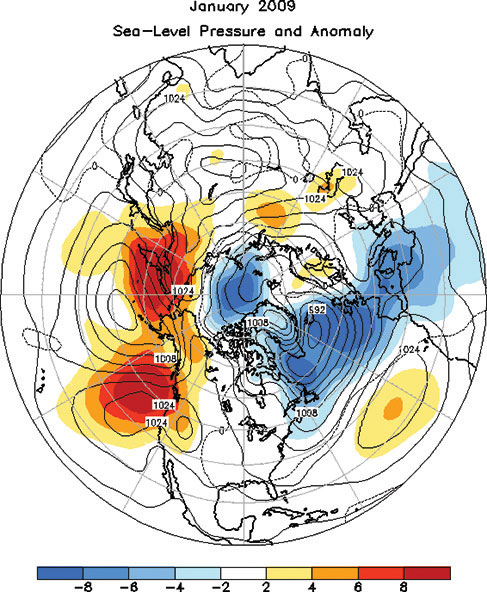
The circulation pattern over the Northern Hemisphere during January was characterized by above normal mid-tropospheric heights across the high latitudes of the North Pacific and the southern North Atlantic, and below normal heights from the eastern U.S. to southern Europe Figure 1. A weak to moderate La Nina was in progress at this time. Sea-level pressure (SLP) was lower than average from far eastern Canada eastward across the North Atlantic to western Europe and much of the Mediterranean region. Above average SLP was observed from east Asia across the northern Pacific to western North America Figure 2
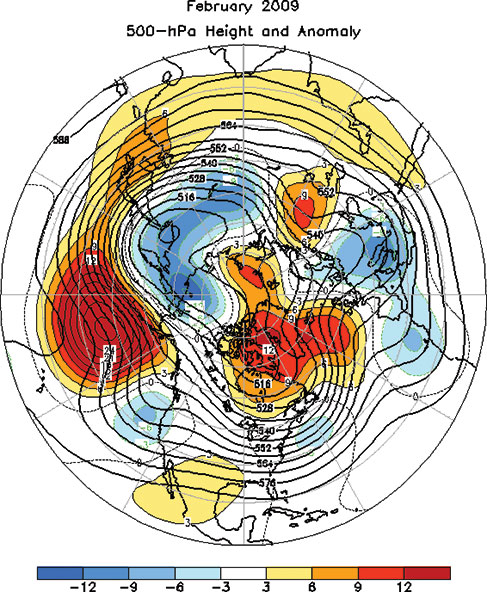
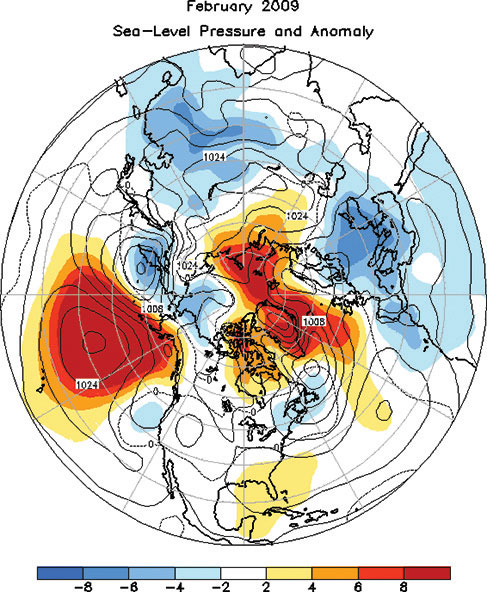
During February, the 500 hPa height field featured a zonal wave-1 pattern at high latitudes with positive anomalies covering eastern Canada and Greenland and negative anomalies covering eastern Siberia and the Bering Sea Figure 3. In the middle latitudes the circulation featured positive anomalies across the central North Pacific Ocean, and across southern Asia, and negative anomalies from California to southern Europe. The SLP anomaly pattern largely mirrored the 500 hPa height anomaly pattern across the Northern Hemisphere during February Figure 4.
The Tropics
La Nina continued during January 2009, as negative sea surface temperature (SST) anomalies strengthened across the central and east-central equatorial Pacific Ocean. The latest monthly SST index was -1.0C in the Nino-3.4 region. Enhanced low level easterly winds and upper level westerly winds present across the equatorial Pacific Ocean were associated with enhanced oceanic upwelling. In addition, convection was enhanced across Indonesia, and suppressed over the central equatorial Pacific Ocean. This combination of oceanic and atmospheric conditions reflects a continuation of La Nina.
La Nina continued but weakened during February 2009, as negative SST anomalies remained below average across the central and east- central Pacific Ocean. The latest monthly SST index was -0.7C in the Nino-3.4 region.
March-April 2009
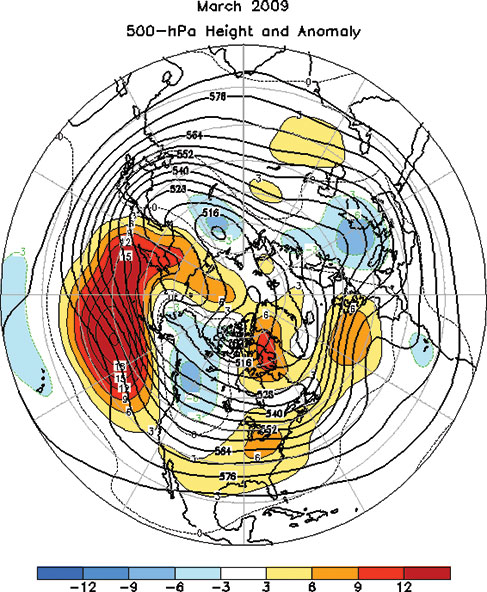
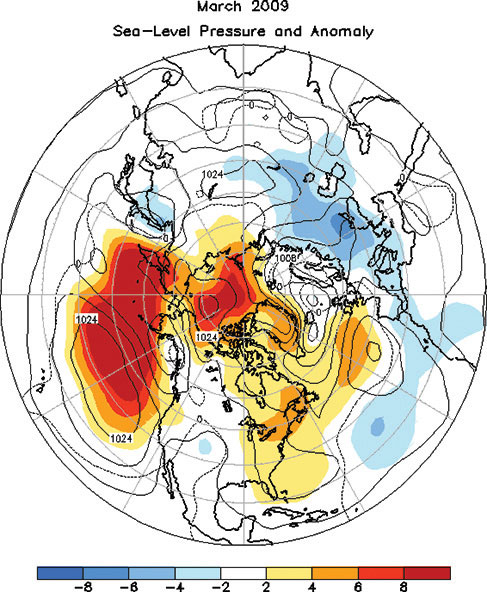
The mean circulation for March 2009 generally depicted positive anomalies in the Western Hemisphere and negative anomalies in the Eastern Hemisphere Figure 5. Notable departures from this pattern included persistent negative anomalies over western Canada and positive anomalies over south-central Russia. Across the Pacific Ocean and North America, the circulation reflected a pronounced westward retraction of the East Asian jet stream, along with a westward shift of the downstream troughs and ridges. These conditions are consistent with La Nina. The SLP map Figure 6 generally mirrors the 500-hPa height anomaly map.
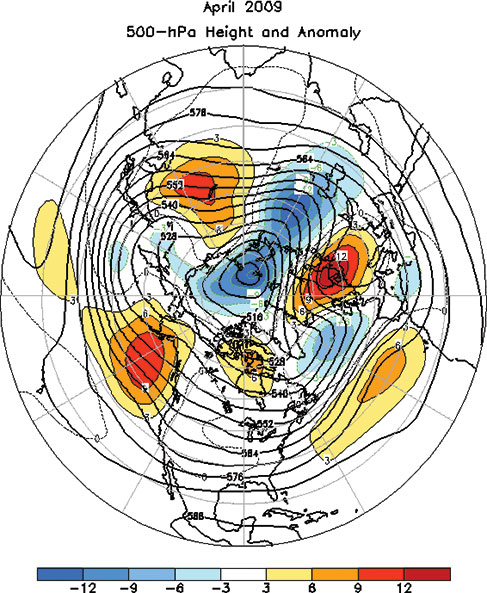
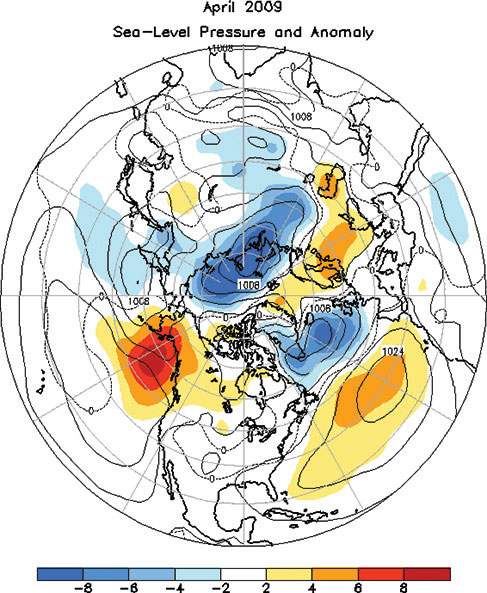
In April, the 500 hPa height field featured positive anomalies over the Gulf of Alaska, the central North Atlantic, Europe, and eastern Asia, and negative anomalies over the high latitudes of the North Atlantic and central Russia Figure 7. Over the Pacific Ocean and North America, the circulation continued to reflect a westward retraction of the East Asian jet stream and a westward shift of the downstream ridges and troughs. These conditions partly reflect a lingering La Nina signal. The Sea-level Pressure and Anomaly map Figure 8 again largely mirrors the 500 hPa height anomaly pattern for April.
The Tropics
In March, weak La Nina conditions continued, as negative SST anomalies persisted in the central and eastcentral equatorial Pacific Ocean. The latest monthly SST index was -0.5C in the Nino-3.4 region. The oceanic thermocline along the equator, measured by the depth of the 20C isotherm, remained shallower than average in the far eastern Pacific and deeper than average across the western Pacific during March. Convection remained suppressed over the central equatorial Pacific Ocean and enhanced across Indonesia. Collectively, this combination of oceanic and atmospheric conditions reflects a weakening of La Nina.
A transition from La Nina to ENSO-neutral conditions was observed during April 2009, as negative SST anomalies further weakened across the equatorial Pacific Ocean and positive anomalies developed in areas of the eastern Pacific. The latest monthly SST index was -0.2C in the Nino-3.4 region. The oceanic thermocline along the equator, measured by the depth of the 20C isotherm, remained deeper than average across most of the Pacific and shallower than average in the far eastern Pacific during April. Convection remained suppressed over the central equatorial Pacific Ocean and enhanced in the western Pacific. Collectively, this combination of oceanic and atmospheric conditions reflects a transition from weak La Nina to ENSO-neutral conditions.
Back to top