Marine Weather Review North Pacific Area
January to April 2008
Introduction
The weather pattern over the North Pacific was very active during January and February with the dominant storm track from near Japan to the south central waters northeast toward the Gulf of Alaska. Less frequently the cyclones turned more northward into the Bering Sea and then redeveloped eastward toward the Gulf of Alaska. There were eleven cyclones with hurricane force winds during each month during this most active period. The pattern became more variable later in February and beyond with occasional blocking high pressure at higher latitudes causing the low pressure systems to turn north toward the Kamchatka Peninsula area or stall at lower latitudes. There were fewer hurricane force systems later in the period with the numbers falling to five in March and two in April. There was no tropical activity over OPCs radiofacsimile oceanic chart area during this four-month period.
Significant Events of the Period
Northeast Pacific Storm, December 31-January 2:A hurricane force low developed in late December 2007 in the southern Gulf of Alaska with reported winds of up to 75 kts and several reports of seas above 12 meters (40 feet). More details on this event are covered in Reference 1. The cyclone moved slowly northeast on January 1 and 2 while weakening to a galeforce low Figure 1 and dissipated near Southeast Alaska late on the 3rd.
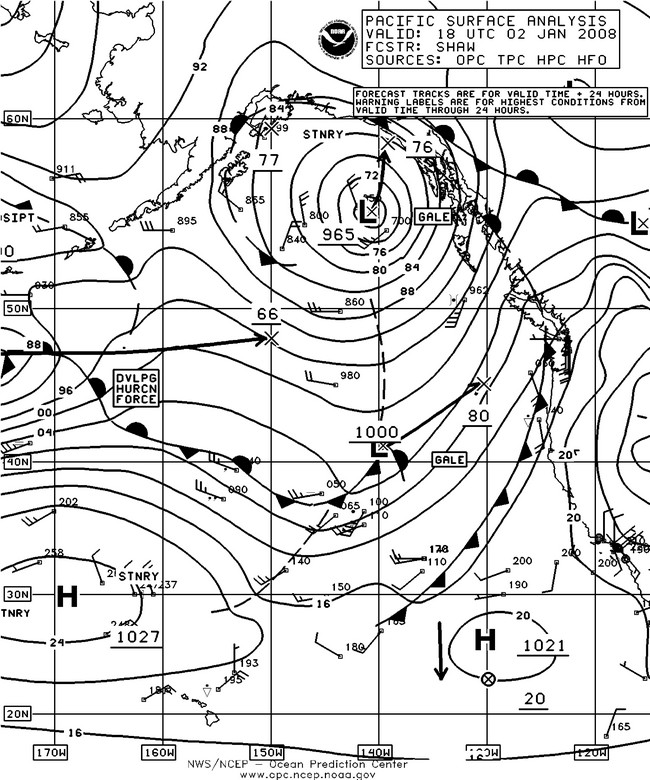
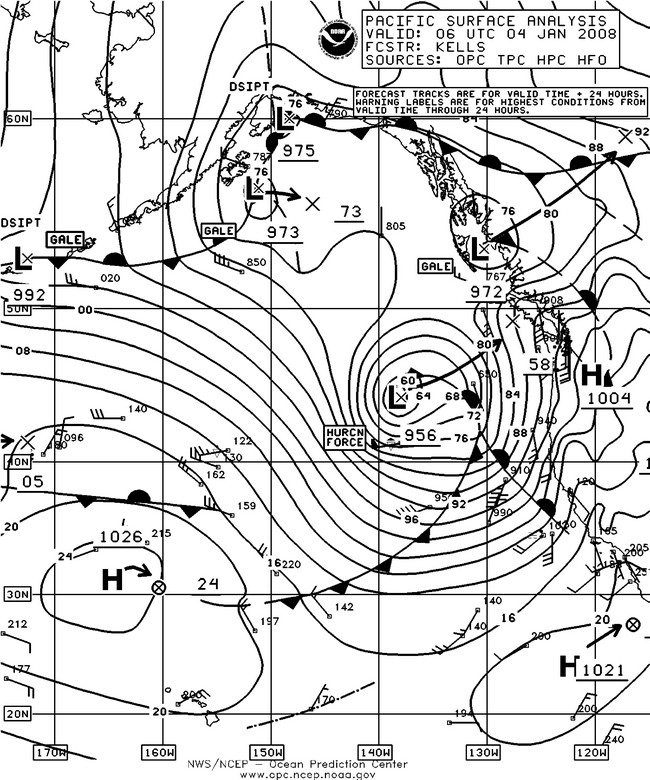
Figure 1. OPC North Pacific Surface Analysis charts (Part 1 - east) valid 1800 UTC January 2 and 0600 UTC January 4, 2008. (Click to enlarge)
Eastern North Pacific Storm, January 2-5:The development of this storm over a thirty six hour period is depicted in Figure 1. It formed as a secondary low on a front over the south central waters, associated with a primary western Pacific low. The cyclone rapidly intensified over the eastern waters with the second part of Figure 1 showing the cyclone at its most intense stage. Figure 2 is a scatterometer image revealing west to northwest winds to 70 kts on the southwest side of the center. The SeaLand Enterprise (KRGB) reported a northwest wind of 60 kts near 43N 135W at 1400 UTC on the 4th, and a report of west winds of 45 kts and 6.0 meter seas (20 feet) fourteen hours earlier, near 40N 140W. The buoy 46583 (37.5N 126W) reported southwest winds of 50 kts at 1200 UTC on the 4th. Buoys 46059 (38.0N 130.0W) and 46002 (42.5N 130.3W) reported seas of 10.5 meters (35 feet) at 2200 UTC on the 4th, with the latter also reporting 40 kts west winds. The cyclone then lifted north to Vancouver Island on the 4th before dissipating inland late on the 5th.
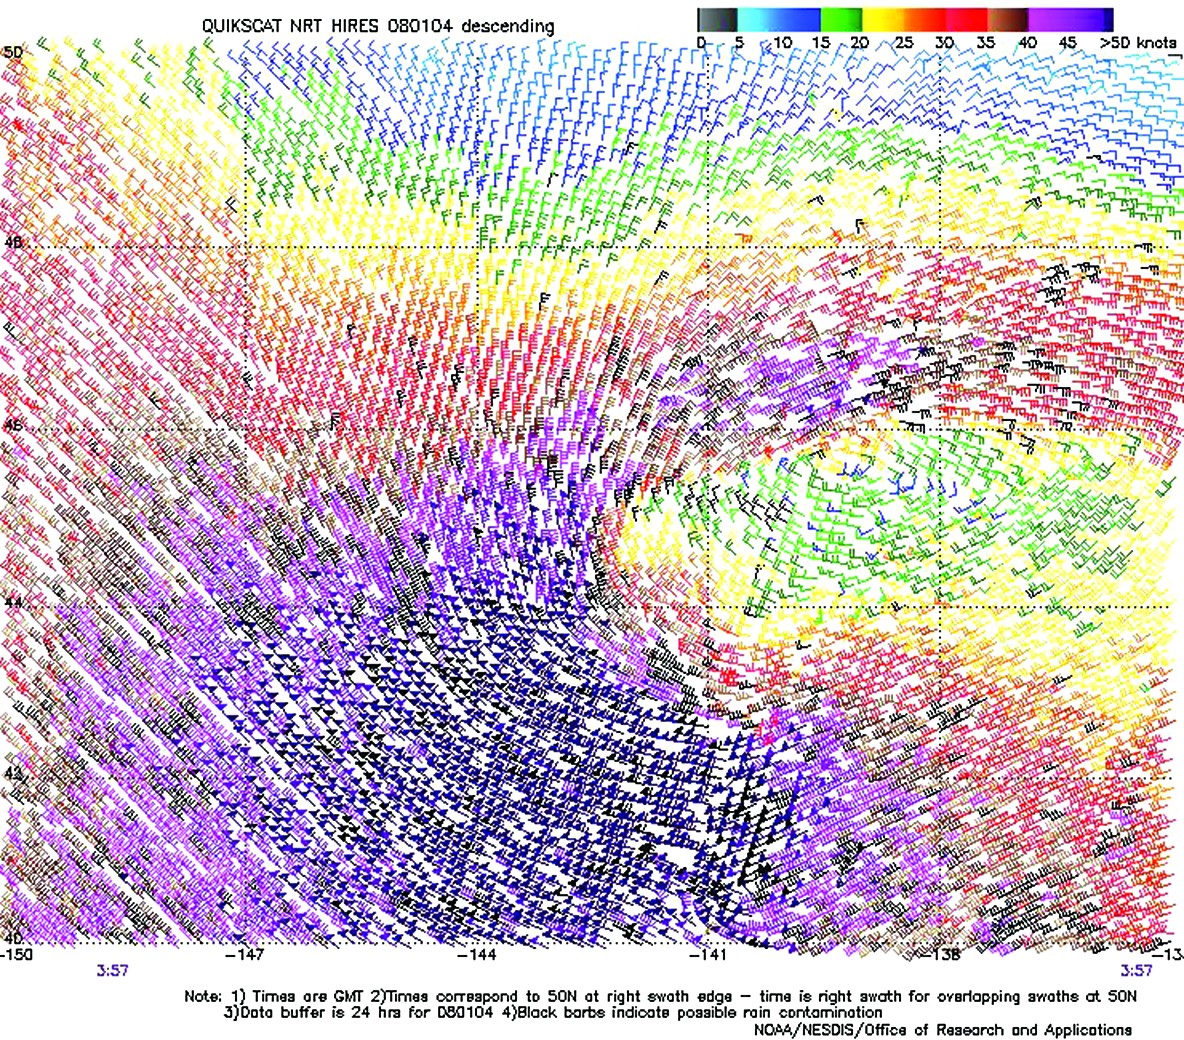
Figure 2. High resolution QuikScat scatterometer image of satellite-sensed winds
around the storm shown in the second part of Figure 1. The resolution is 12.5 km,
versus 25 km in the coarser-resolution version of QuikScat imagery. The valid time
of the pass is 0357 UTC January 4, 2008, or about two hours prior to the valid
time of the second part of Figure 1. Image is courtesy of NOAA/NESDIS/ Office of
Research and Applications. (Click to enlarge)
North Pacific Storm of January 5-8:This cyclone originated over the southern waters just west of the dateline early on the 5th and tracked northeast, developing hurricane force winds twenty four hours later with the center near 44N 172W with a 968 hPa central pressure. The central pressure dropped 32 hPa during this period. A scatterometer image on the morning of the 7th showed winds 50 to 75 kts around the south and west sides of the center. The APL Singapore (WCX8812) encountered northwest winds of 50 kts near 41N 171E at 1800 UTC on the 5th. The United Spirit (ELYB2)(48N 127W) reported southeast winds of 45 kts and 8.5 meter seas (28 feet) at 0500 UTC on the 8th. The Canadian buoy 46207 (50.9N 129.8W) reported southeast winds of 40 kts and 8.0 meter seas (27 feet) at 0700 UTC on the 8th. The cyclone began to weaken early on the 7th and later dissipated near Southeast Alaska on the 9th.
North Pacific Storm, January 6-10. This cyclone originated near Japan early on the 5th and tracked northeast, with OPC analyzing it as a hurricane force low on January 7 and 8 as it passed over the central waters. The center developed a central pressure as low as 969 hPa near 40N 175W at 0600 UTC on the 8th. Unknown Ship DCTA2 (29N 170E) reported west winds of 55 kts and 6.0 meter seas (19 feet) at 0000 UTC on the 7th , and at 1200 UTC on the 8th the ship Majestic Maersk OUJH2 (41N 179W) encountered north winds of 55 kts and 8.5 meter seas (28 feet). The cyclone then elongated northeastward and weakened on the 9th, becoming a gale by the 10th before moving into Southeast Alaska late on the 10th.
North Pacific Storms, January 9-12: Figure 3 depicts two hurricane force systems that developed simultaneously over the central and eastern North Pacific. The western low originated east of Japan near 159E early on the 9th, attaining a lowest central pressure of 982 hPa near 41N 174E at 1800 UTC on the 10th, when it developed hurricane force winds. The cyclone maintained its strength while tracking through the south central waters into the 11th, before turning southeast and weakening, then dissipating near 31N 153W on the 13th. The eastern low formed in the south central waters near the dateline early on the 9th and tracked northeast as shown in Figure 3 with the maximum intensity (976 hPa) occurring six hours later. Both storms developed rather compact circulations with high resolution scatterometer data indicating winds to 70 kts south of the centers of both storms on the morning of the 11th. The eastern cyclone began to weaken later on the 11th before moving into Southeast Alaska as a gale late on the 12th. The strongest wind reported by ships was a northeast wind of 45 kts from Sea-Land Meteor (WDB9951)(36N 163W) at 1800 UTC on the 10th and a west wind 45 kts from Maunalei (KFMV)(39N 149W) at 1800 UTC on the 11th.
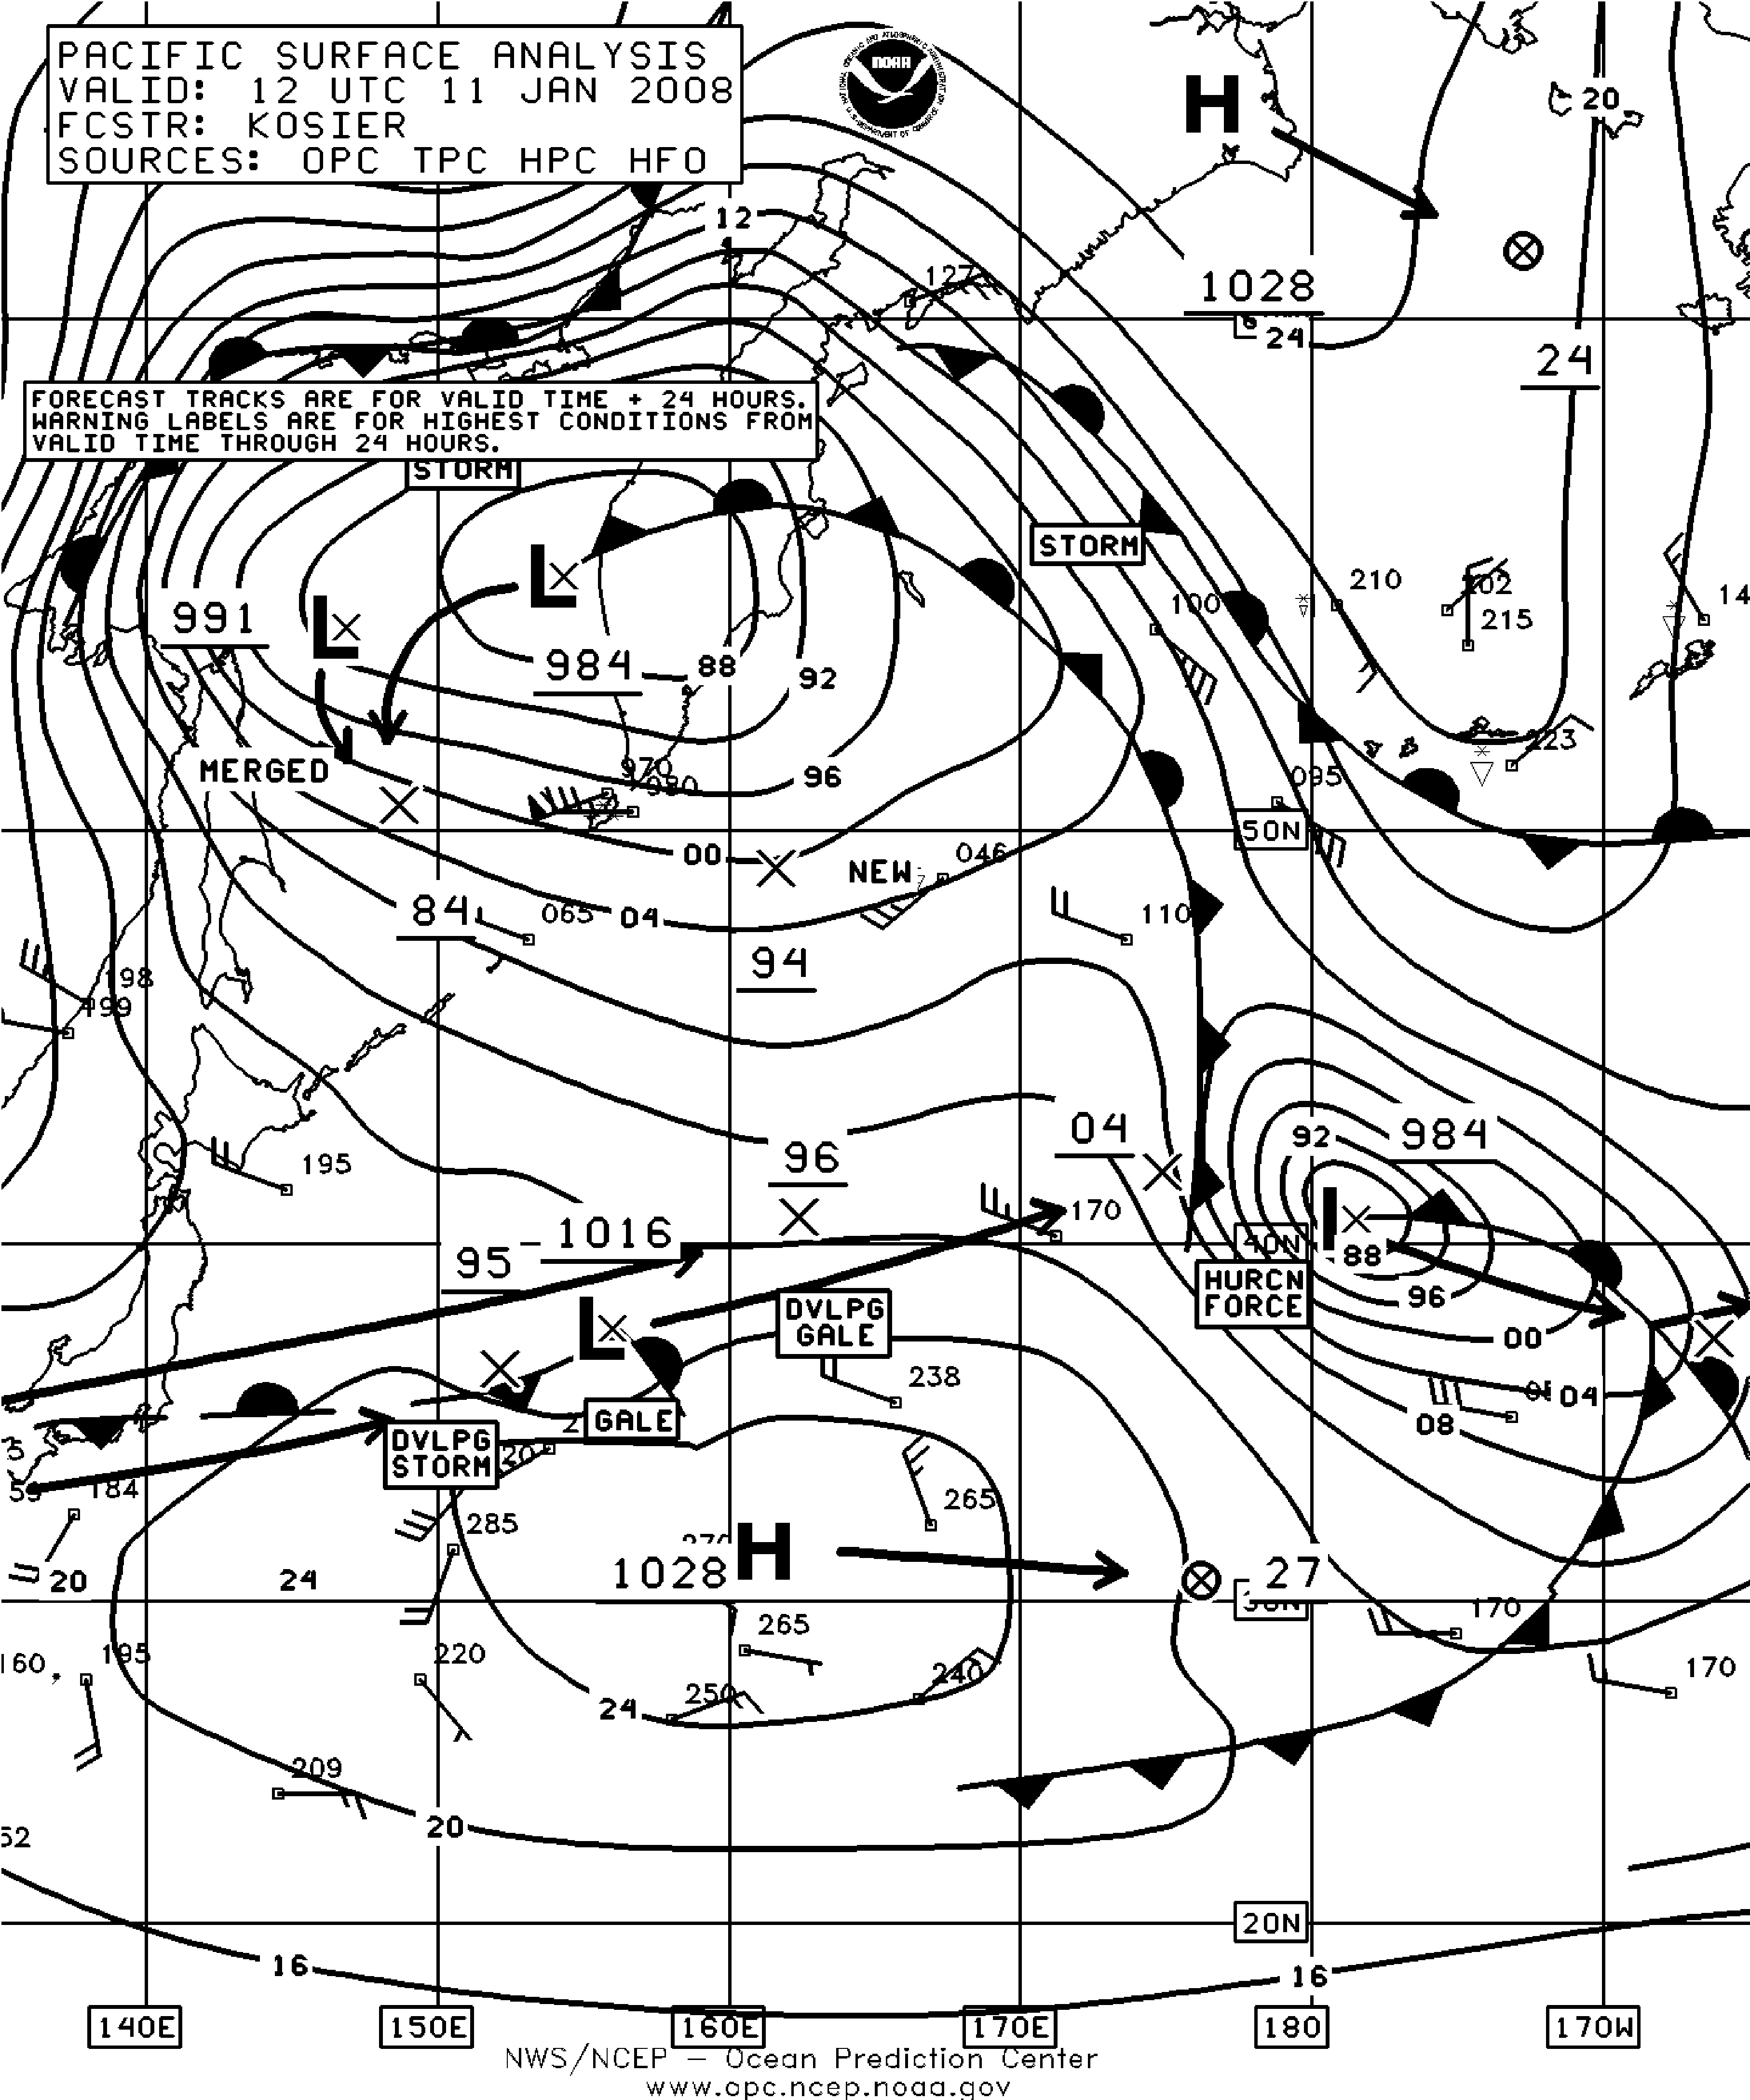
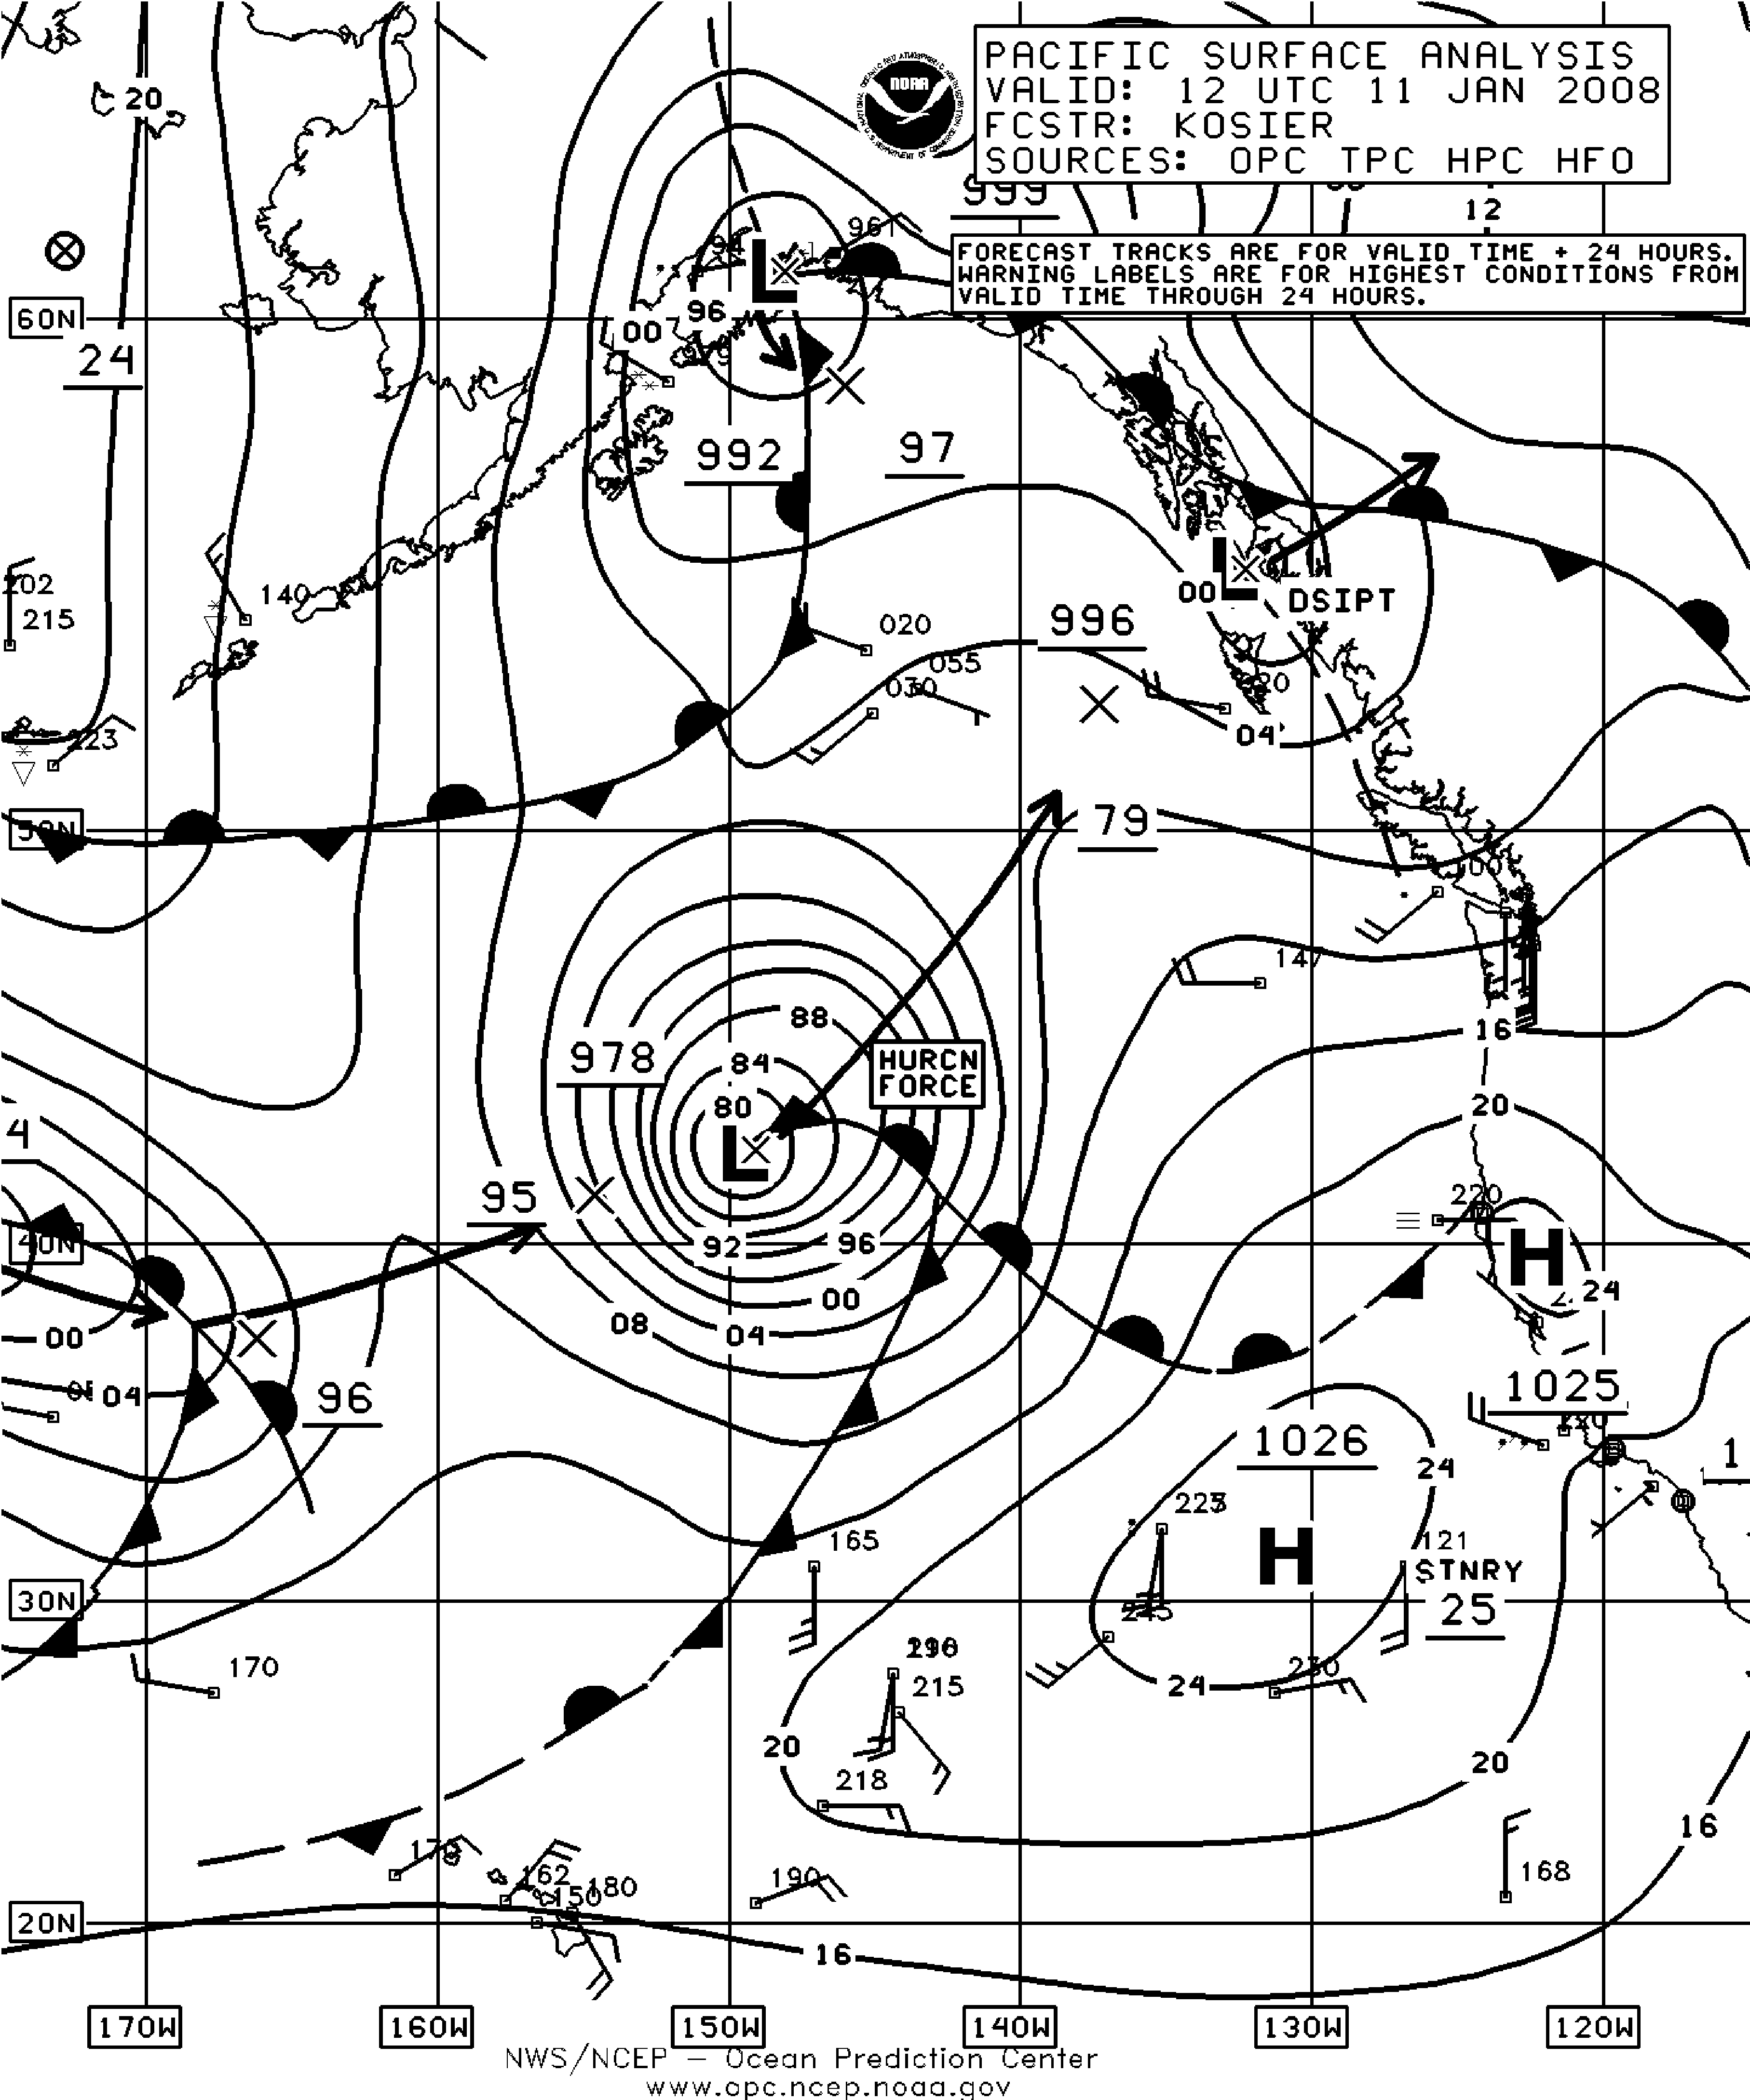
Figure 3. OPC North Pacific Surface Analysis charts (Parts 1 and 2) valid 1200 UTC January 11, 2008. (Click to enlarge)
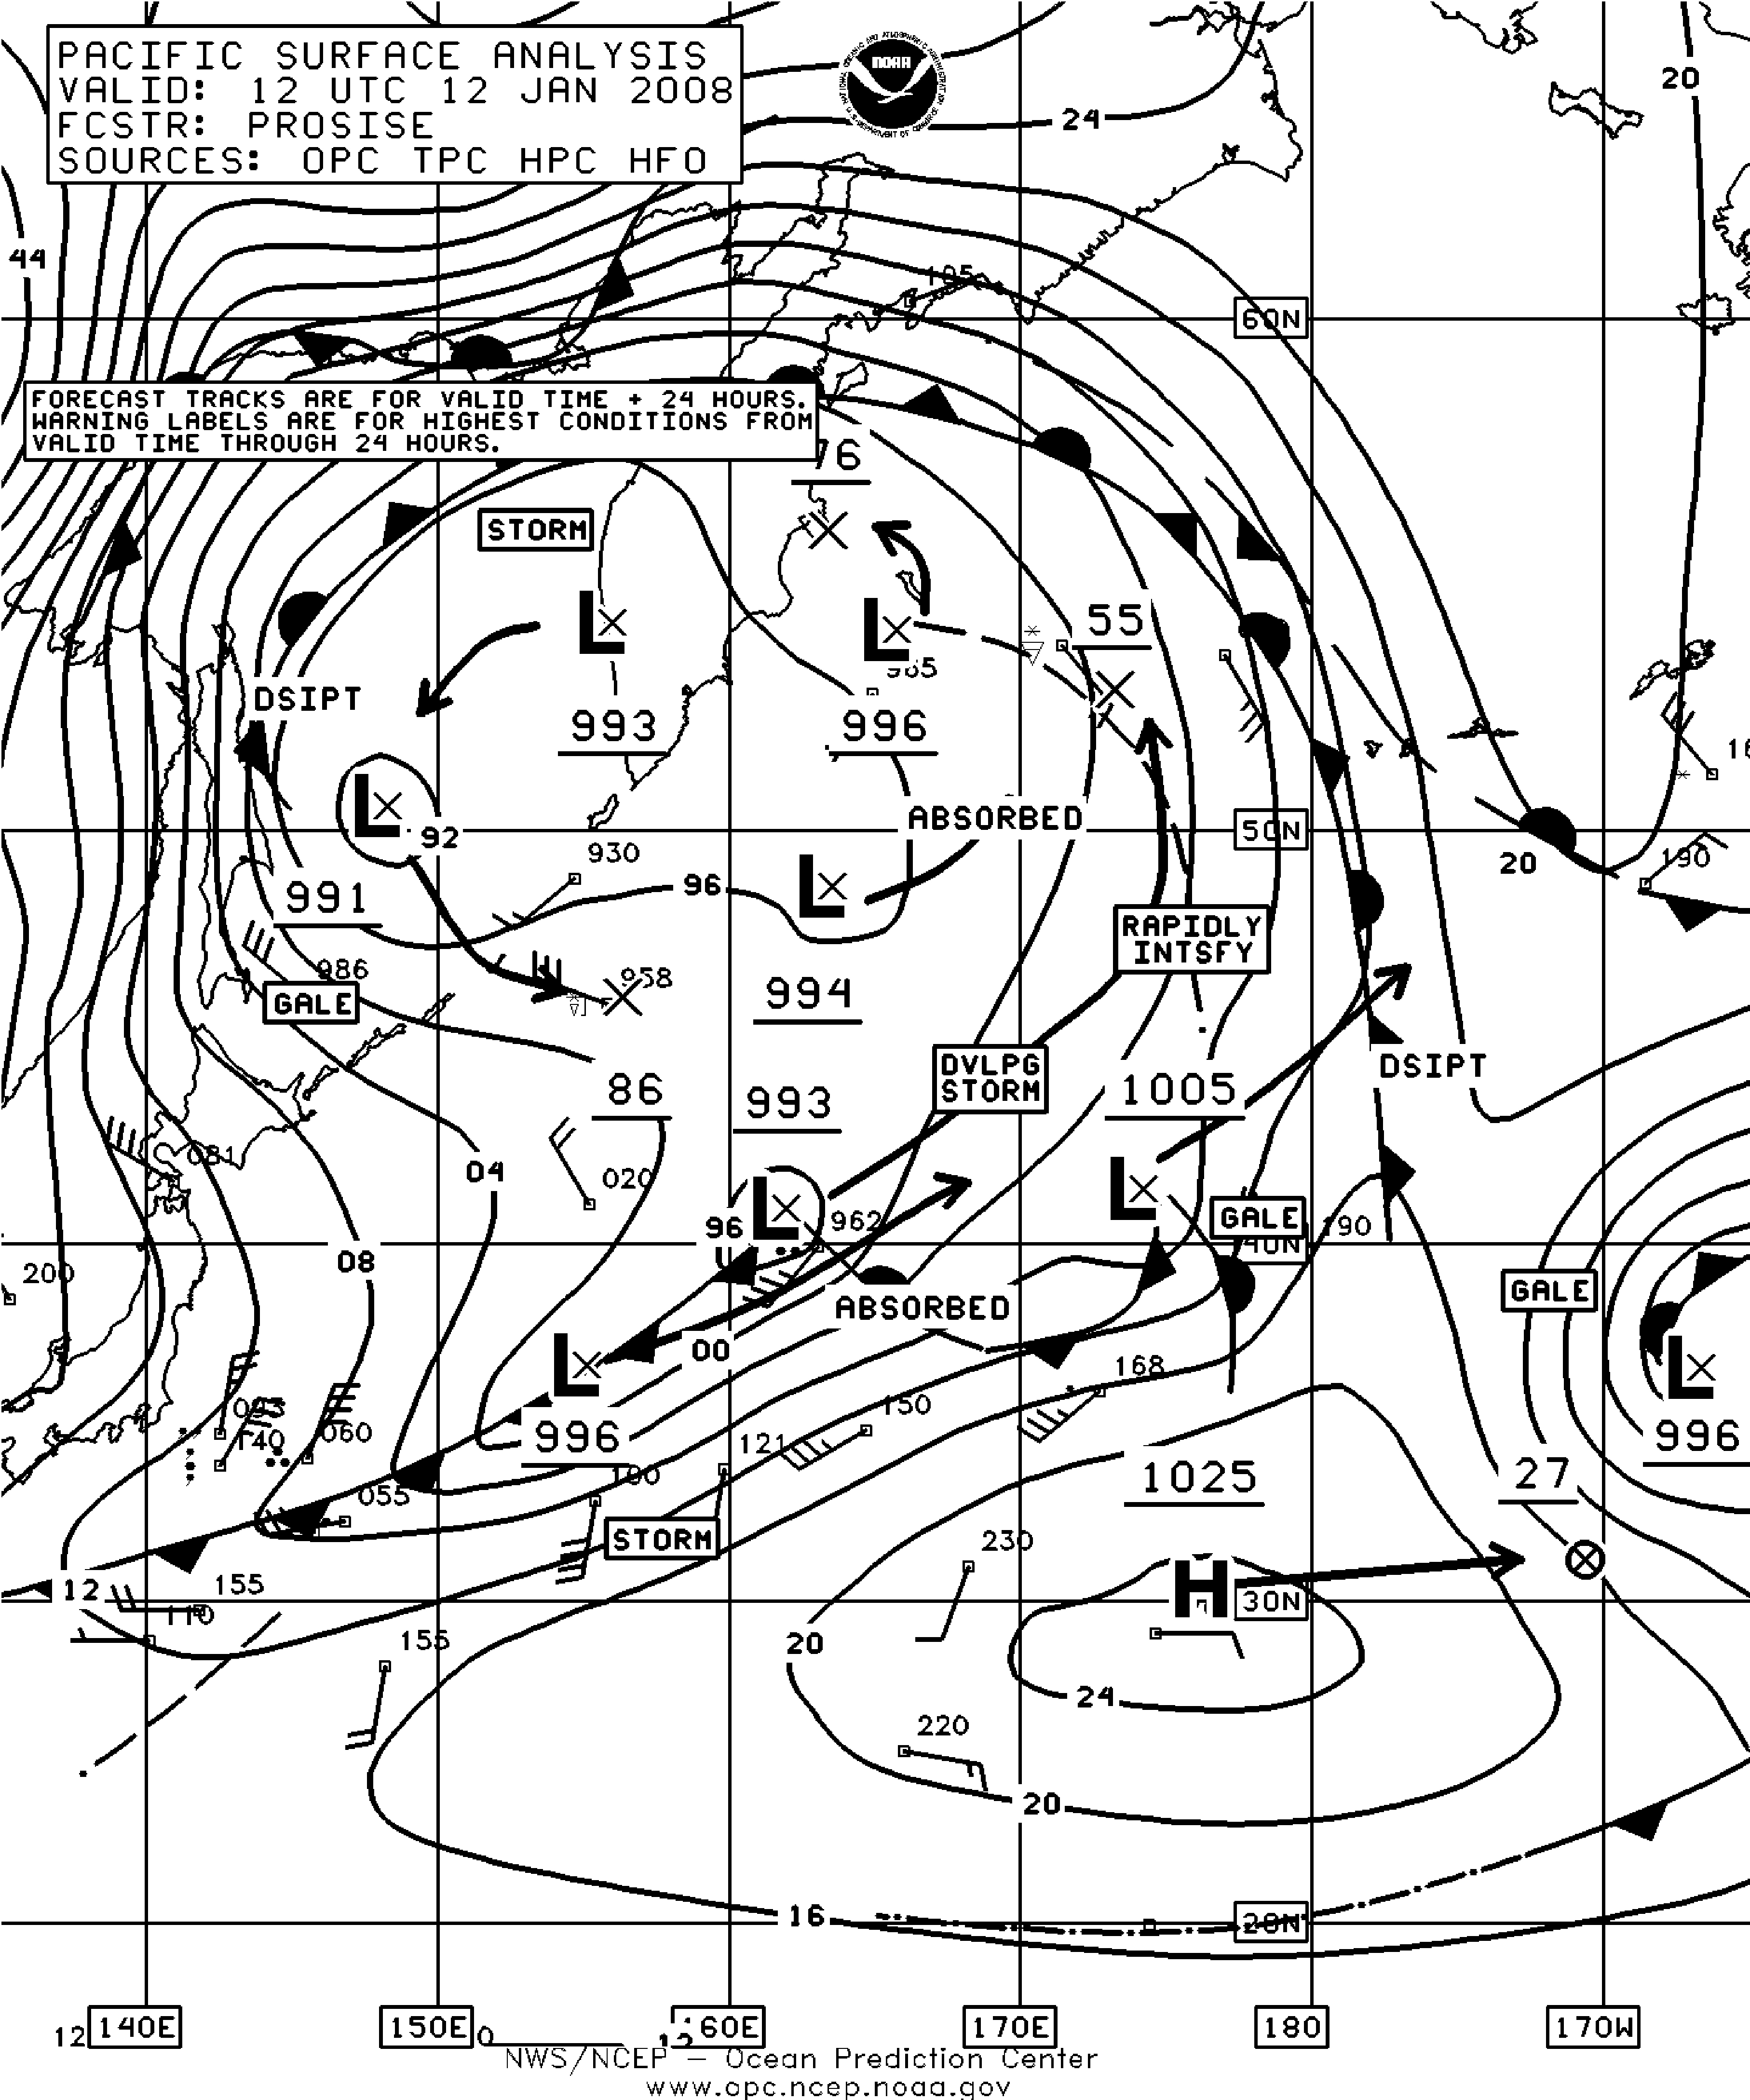
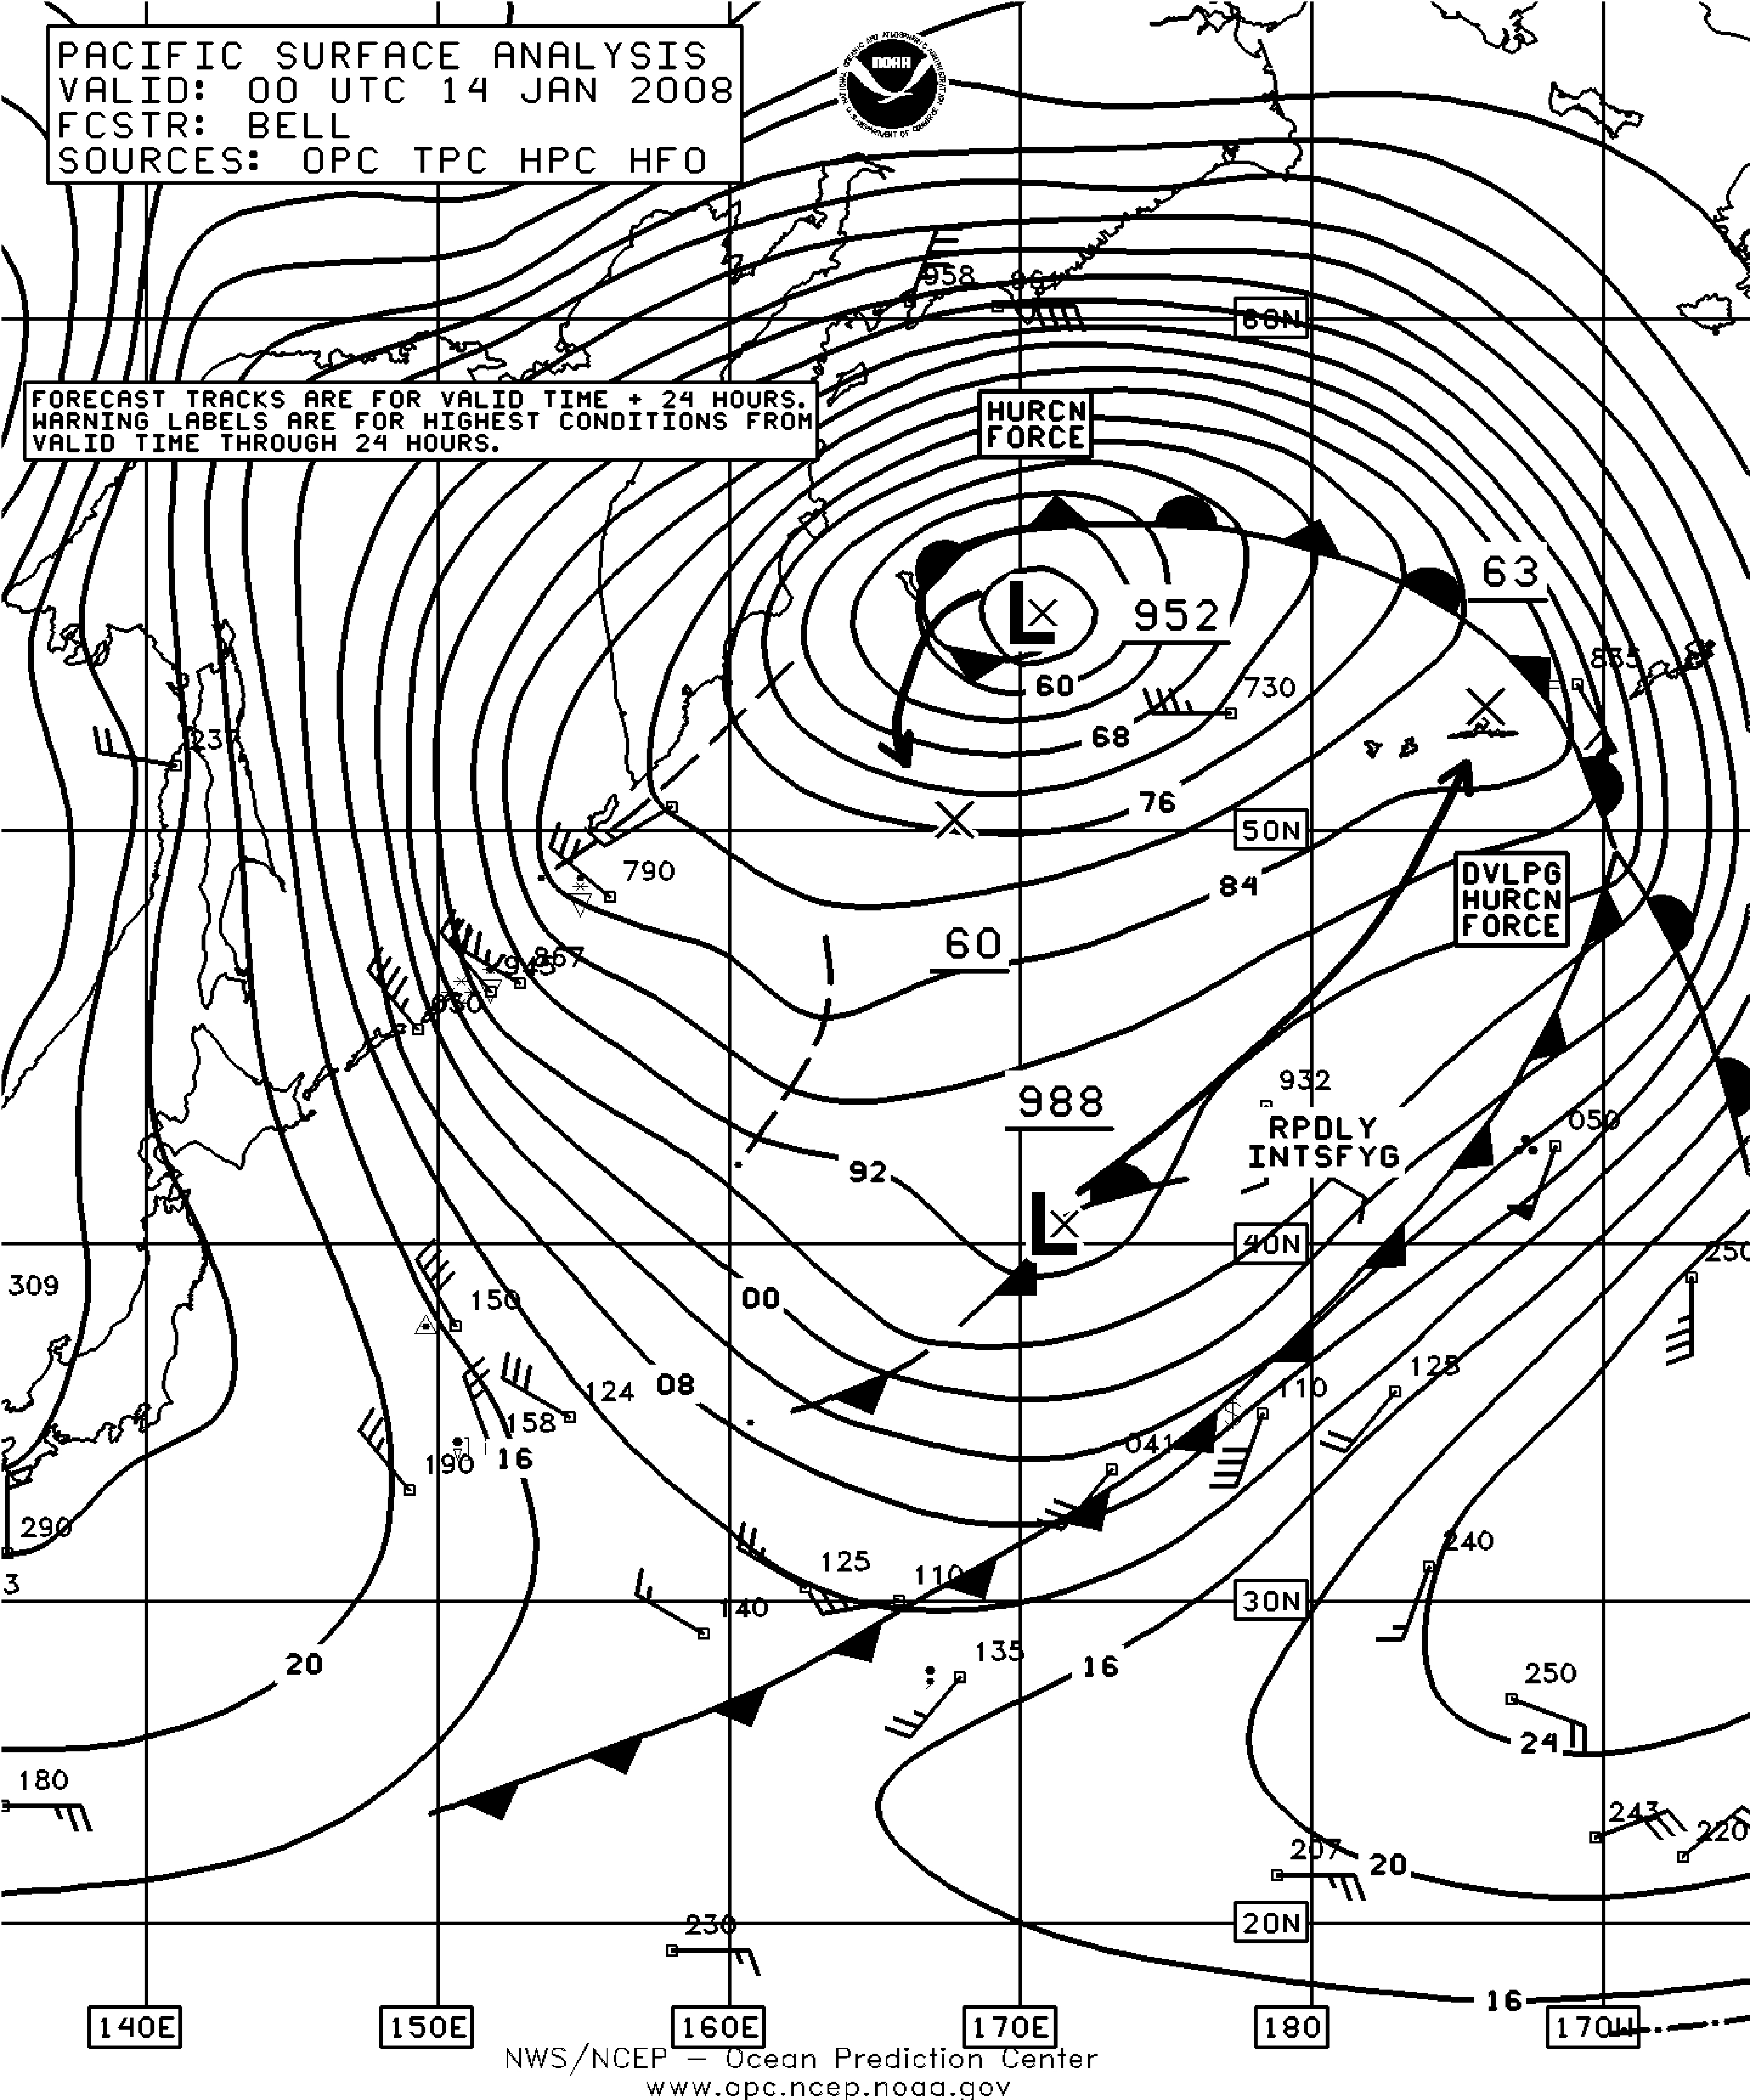
Figure 4. OPC North Pacific Surface Analysis charts (Part 2 - west) valid 1200 UTC January 12 and 0000 UTC January 14, 2008. (Click to enlarge)
Northwest Pacific and Bering Sea Storm, January 12-15. The rapid intensification of this cyclone over a thirty six hour period is shown in Figure 4. The central pressure fell 32 hPa in the twenty four hour period ending at 1800 UTC on the 13th. The second part of Figure 4 shows the cyclone at maximum intensity. At 1200 UTC on the 13th the ship Susan Maersk (OYIK2)(42N 178W) reported south winds of 50 kts and 7.0 meter seas (23 feet). Twelve hours later Unknown Ship (4XFC)(53N 171W) encountered southeast winds of 60 kts and 9.5 meter seas (31 feet). The buoy 46072 (51.6N 172.1W) reported southeast winds of 45 kts and 9.0 meter seas (30 feet) at 1800 UTC on the 13th, followed by a report of seas 10.5 meters (35 feet) two hours later. The buoy 46035 (57N 177.8W) reported east winds reaching 55 kts and 9.0 meter seas (30 feet) at 2200 UTC January 13, followed by a report of seas as high as 11.5 meters (38 feet) five hours later.
The highest winds as detected by QuikScat high resolution data were 75 kts from the northeast between the occluded front and the Russian coast Figure 5. The cyclone subsequently looped to the south and passed just south of the western Aleutians early on the 15th while weakening, before turning northeast and stalling in the southern Bering Sea on the 17th.
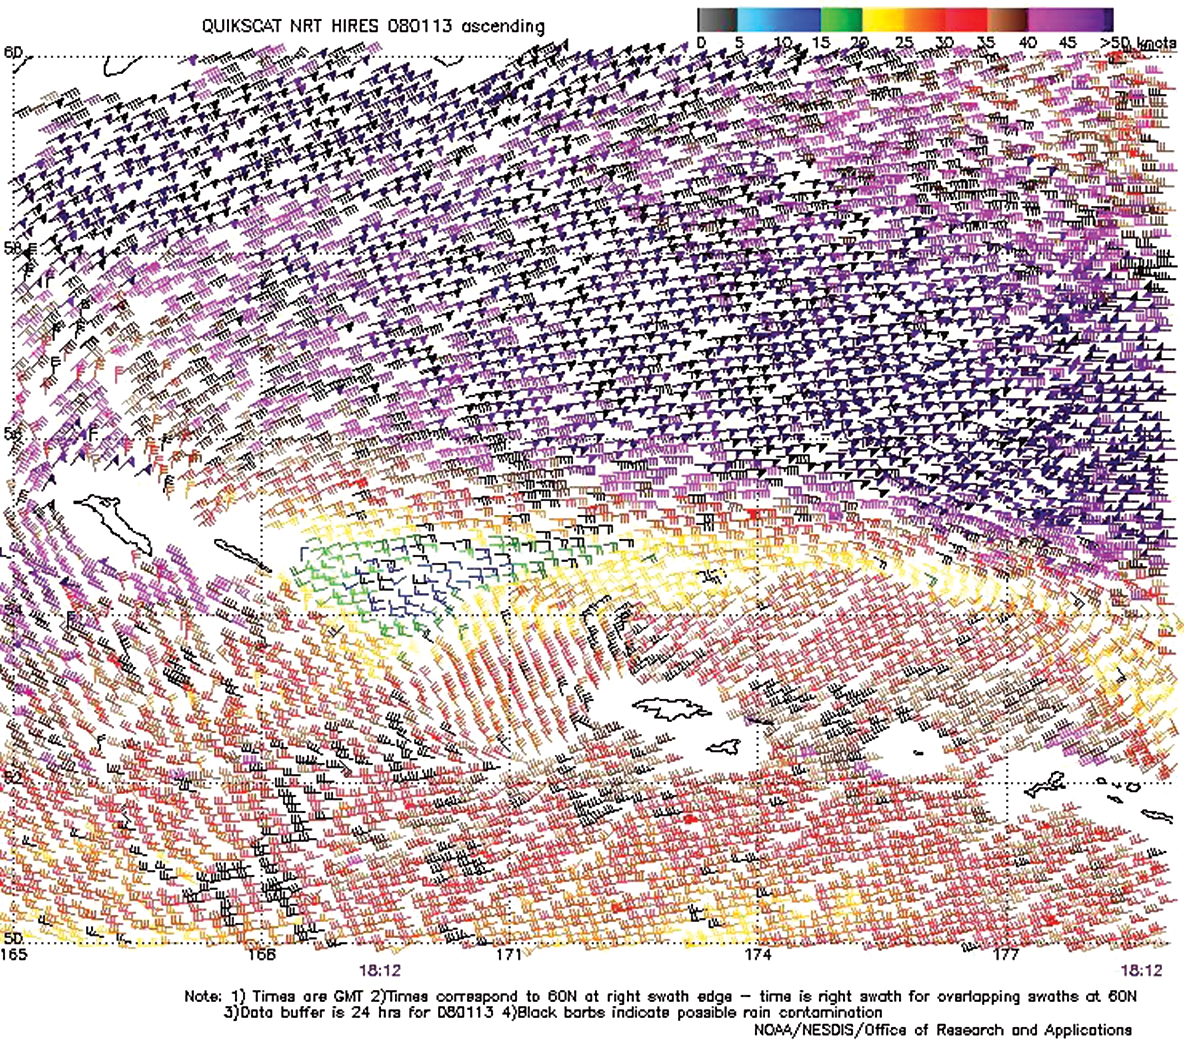
Figure 5. High resolution QuikScat scatterometer image of satellite-sensed winds around the storm shown in the second part of Figure 4. The valid time of the pass is 1812 UTC January 13, 2008, or about six hours prior to the valid time of the second part of Figure 4. The center of the storm is near 54N 173E near the center of the image. The western Aleutian Islands appear in the lower right part of the image. Image is courtesy of NOAA/NESDIS/ Office of Research and Applications. (Click to enlarge)
North Pacific and Bering Sea Storm, January 17-19: This cyclone originated southeast of Japan and tracked northeast, developing hurricane force winds while passing across the central waters late on the 17th. The central pressure dropped 35 hPa in the twenty four hour period ending at 0600 UTC on the 18th. The storm developed a compact appearance similar to the cyclones in Figure 3 except this low was even deeper, and high resolution scatterometer winds revealed winds as high as 90 kts southwest of the center. The center moved northeast and developed a lowest central pressure of 957 hPa near 49N 176W after the period of highest (hurricane force) winds. The system then moved into the central Bering Sea and weakened on the 19th, before moving inland over eastern Russia by the 20th.
North Pacific Storm, January 19-22:The initial development of this cyclone over the southwest and central waters is shown in Figure 6, the second part of which shows the storm near maximum intensity. The central pressure fell 32 hPa in the twenty four hour period ending at 1200 UTC on the 20th, an impressive drop for that southern latitude. Figure 7 reveals storm force winds all the way around the center and winds as high as 70 kts south of the center and 65 kts northwest of the center, in high resolution scatterometer satellite data. The cyclone then moved into the southeast Bering Sea as a storm force low on the 21st and weakened, before moving inland over northwest Alaska on the 22nd.
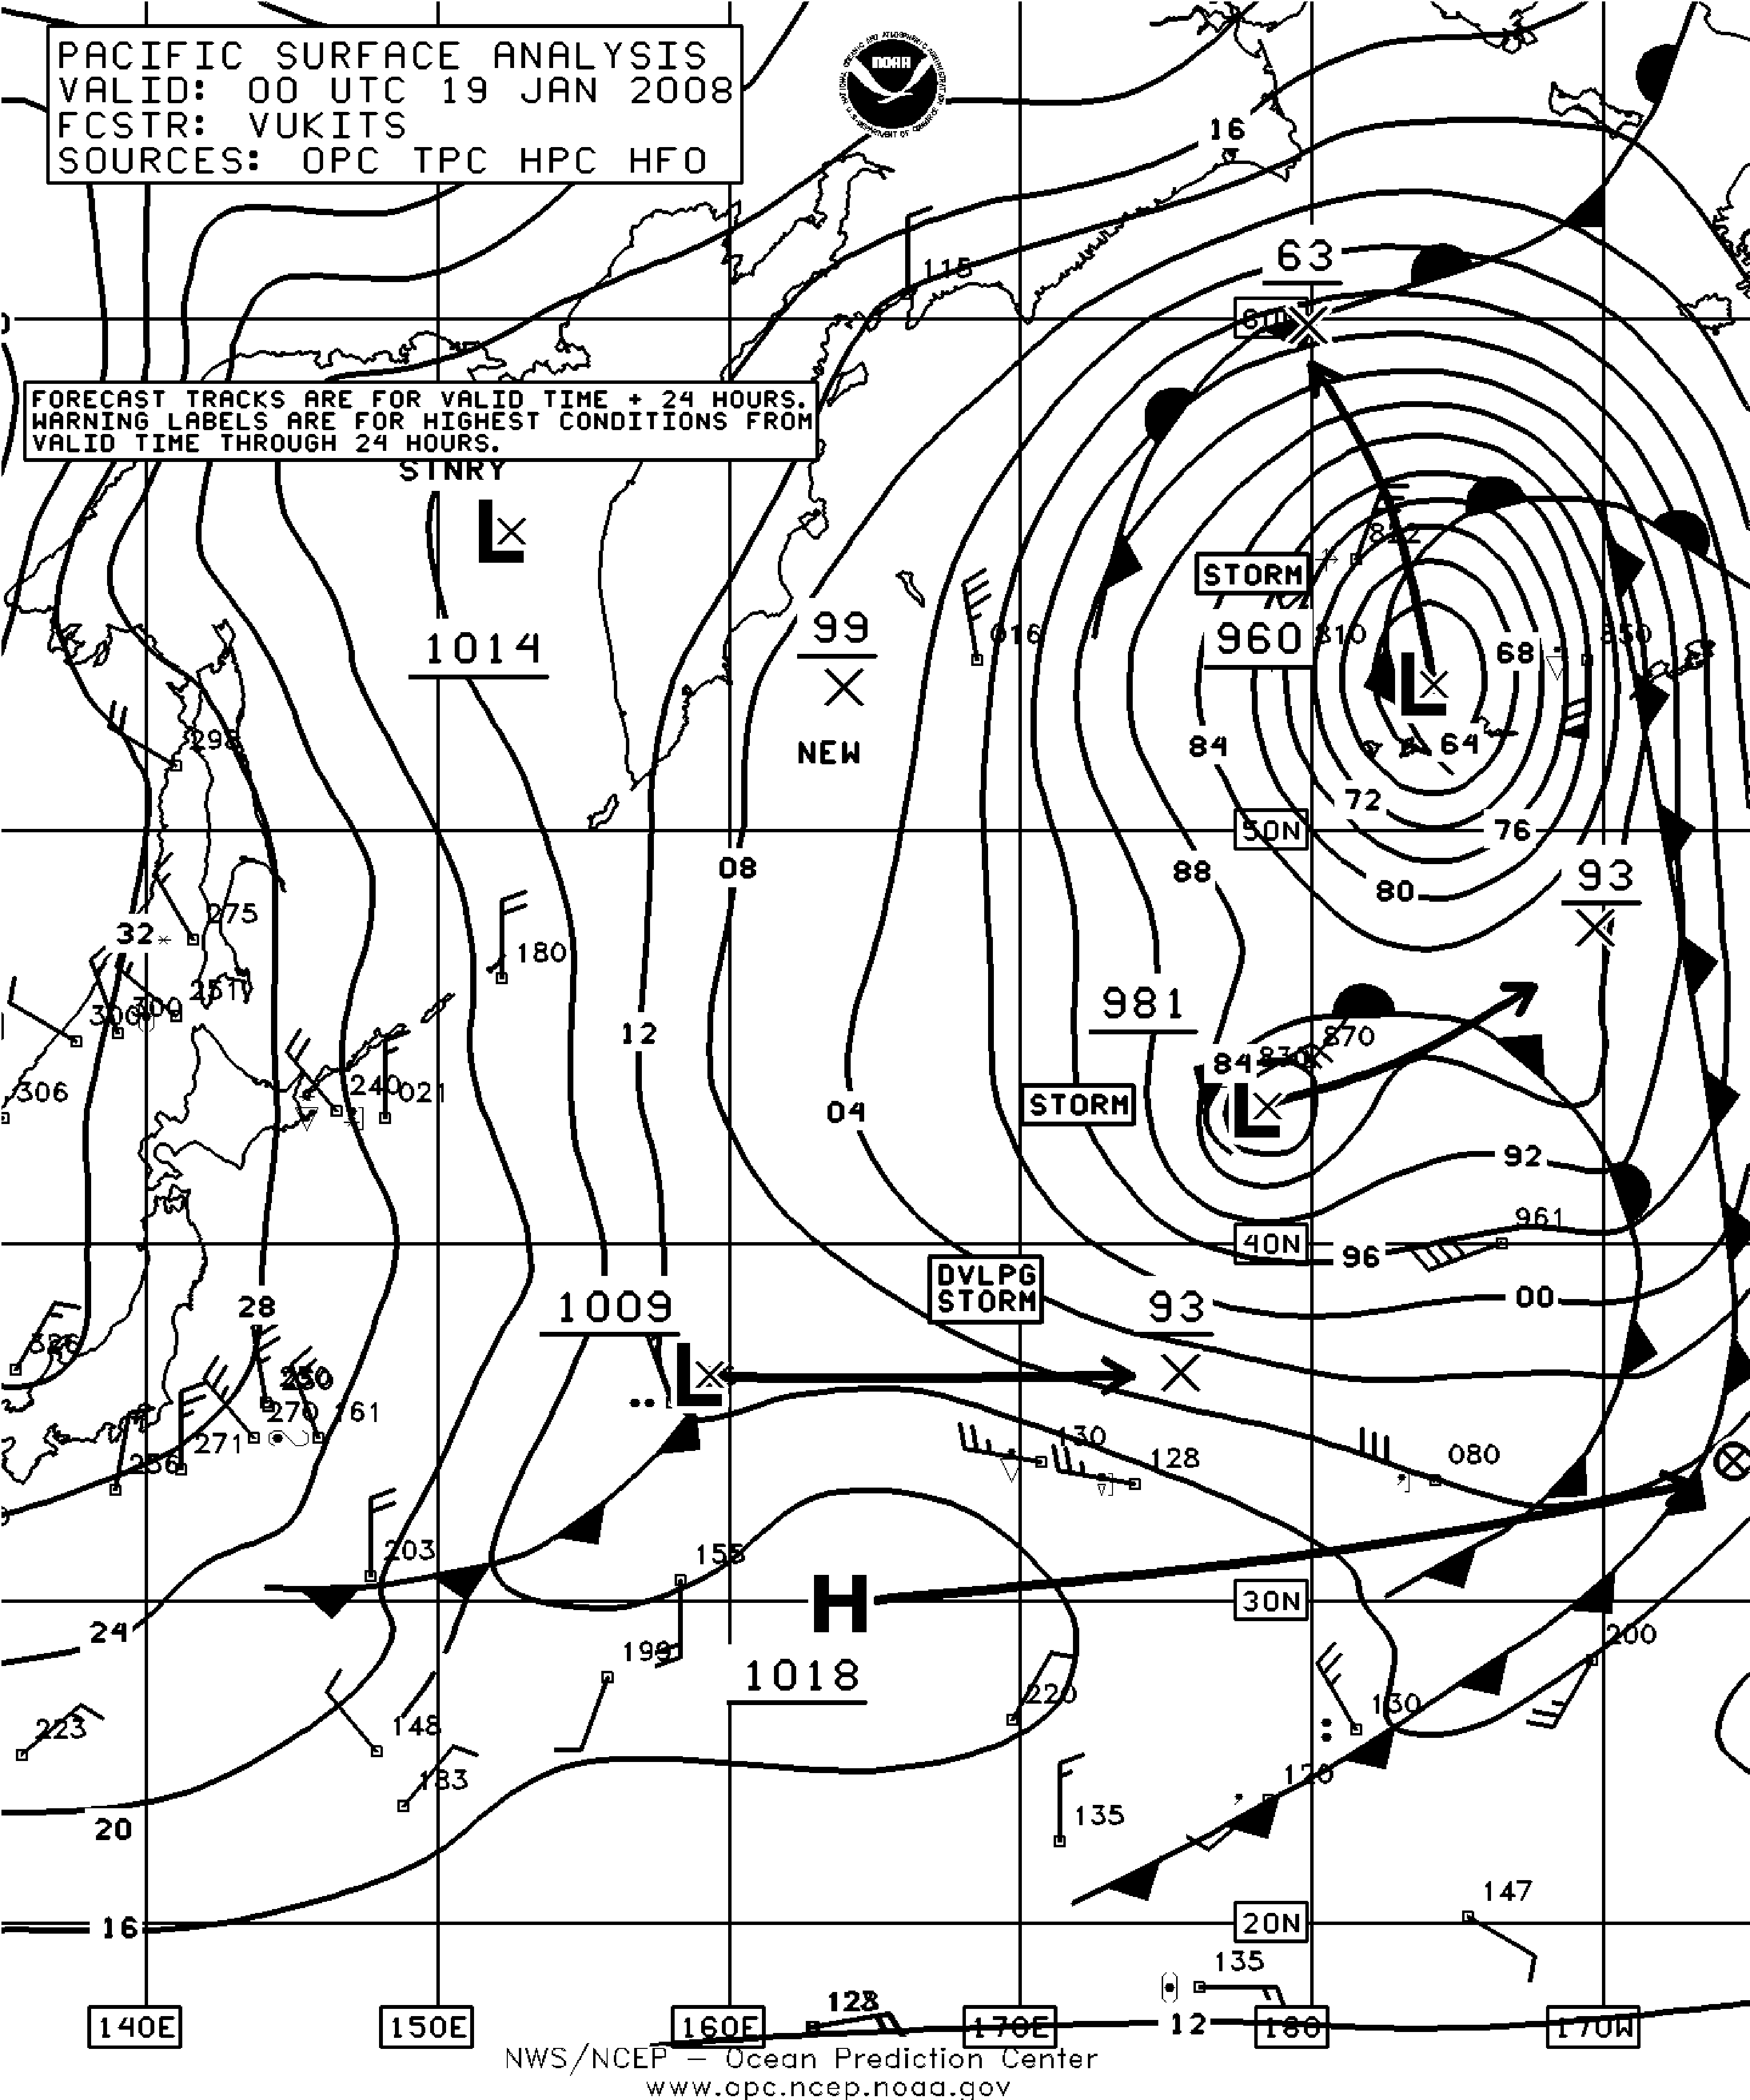
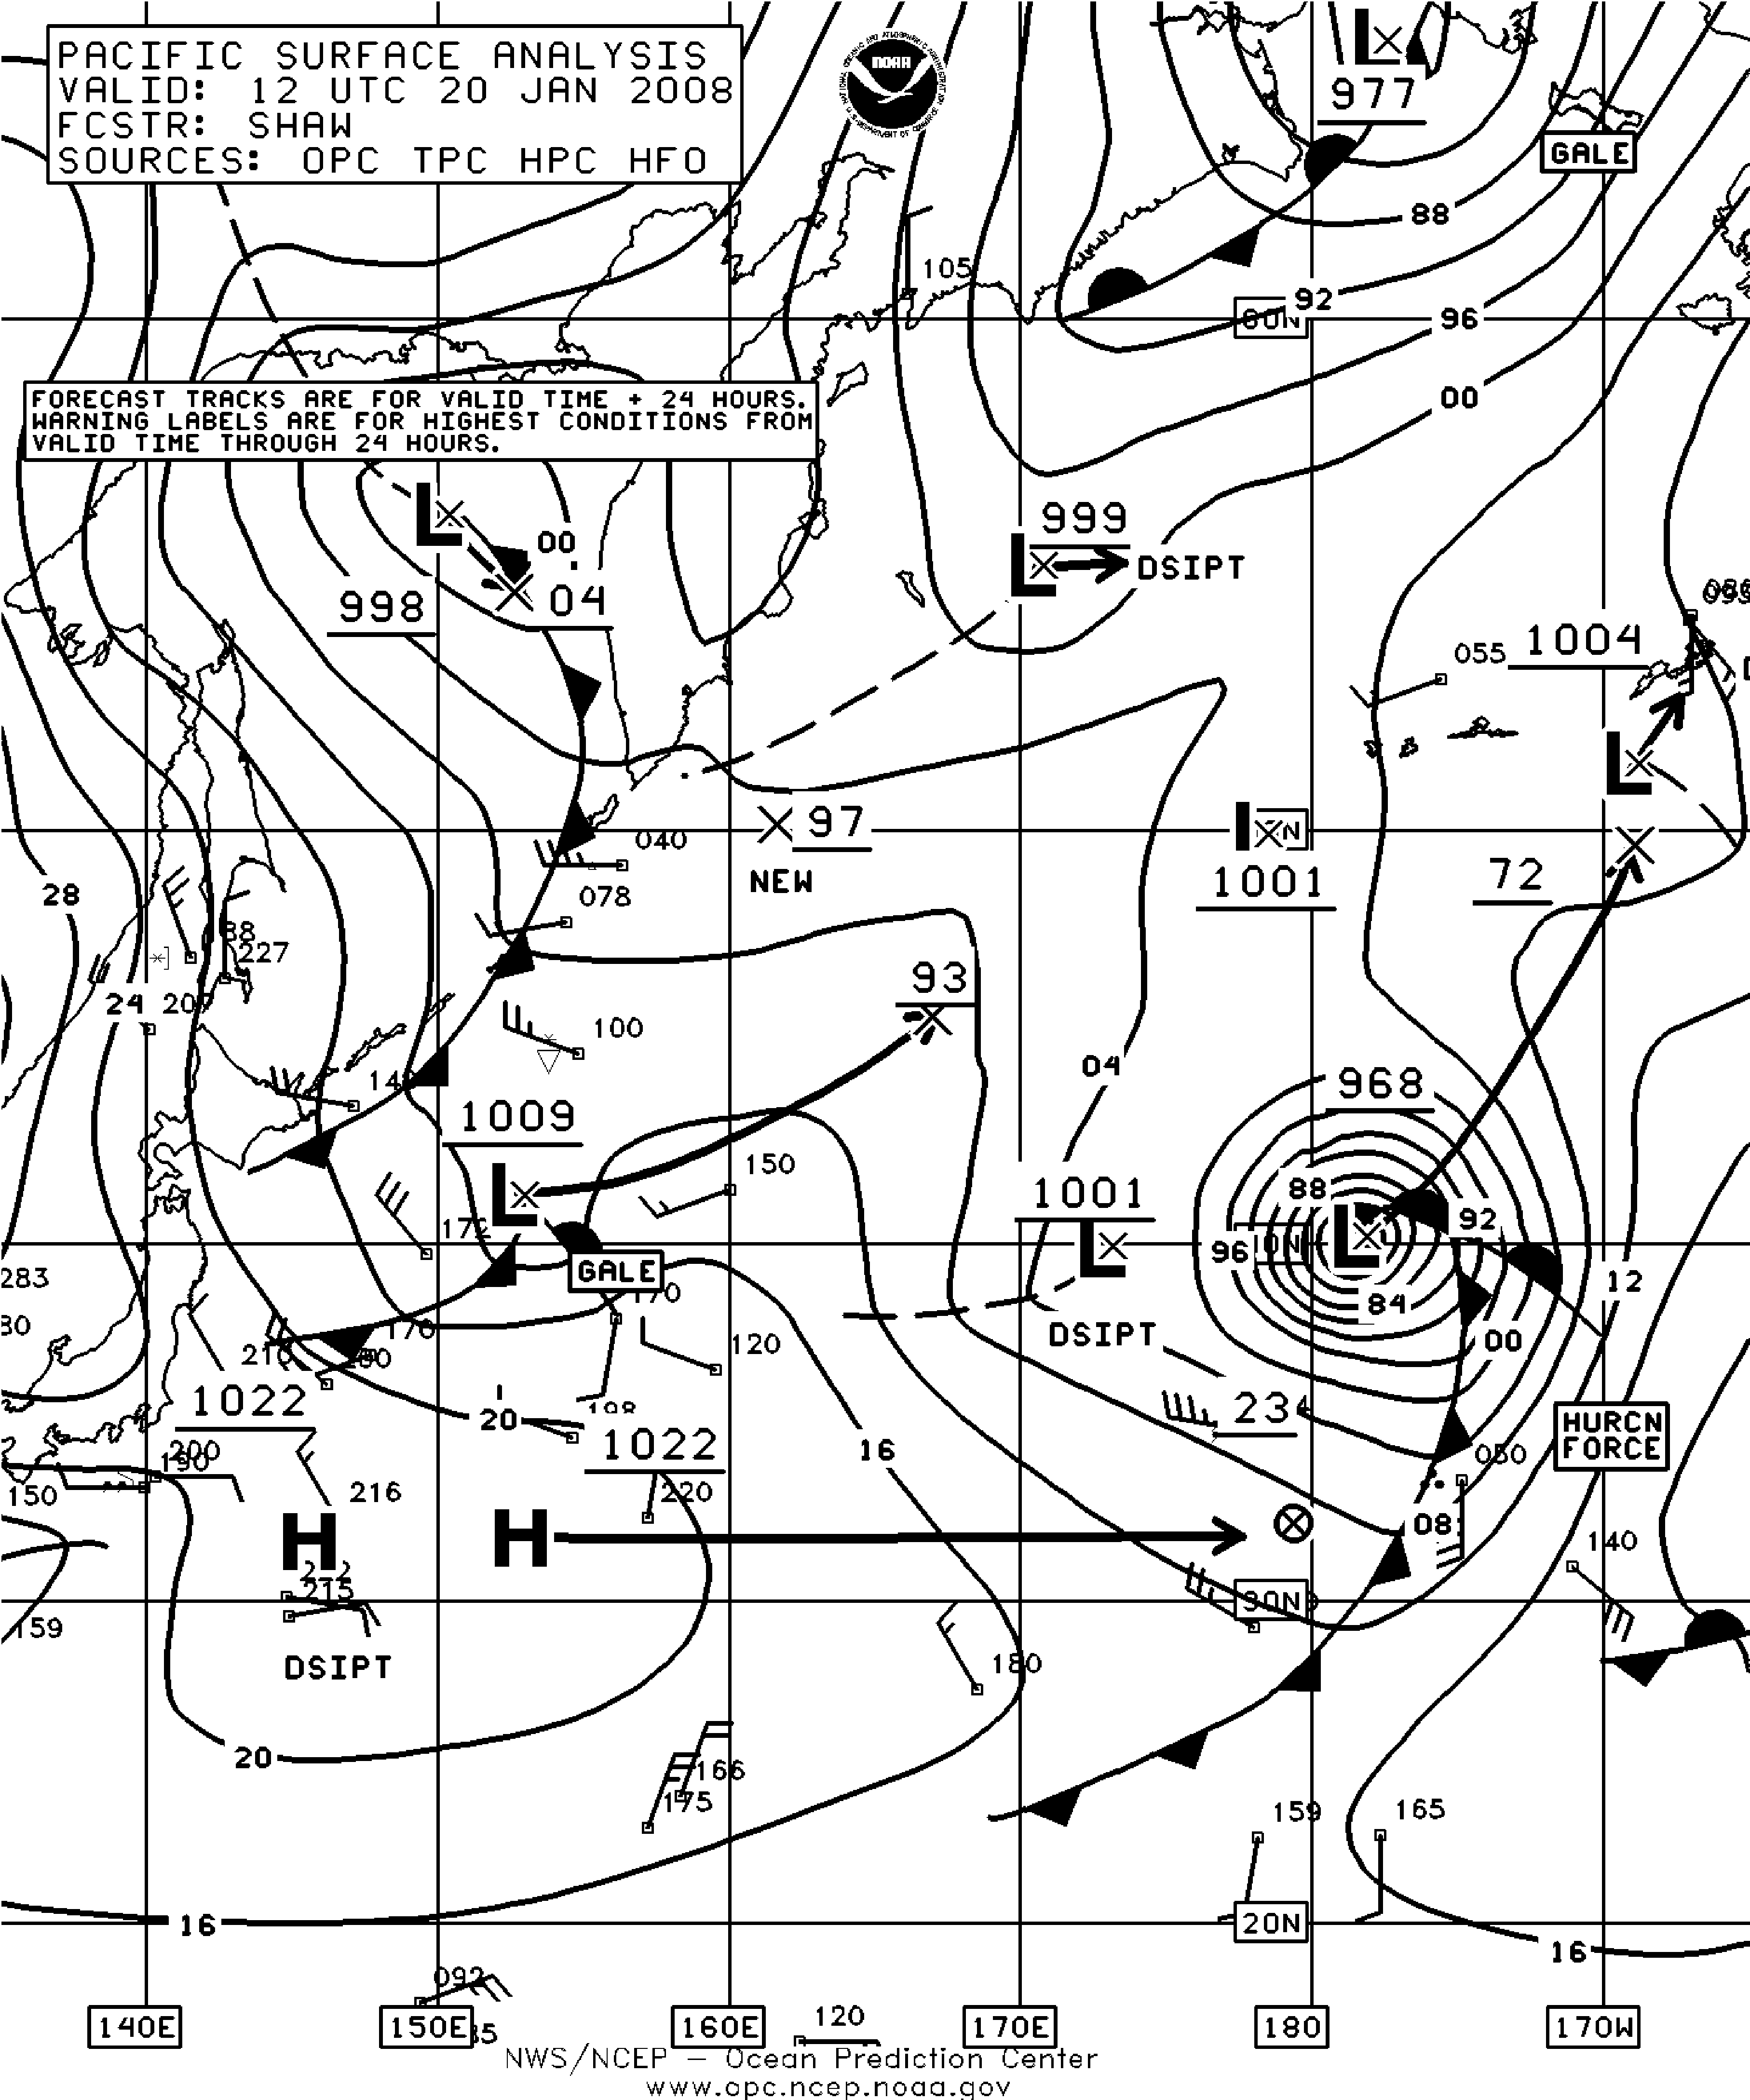
Figure 6. OPC North Pacific Surface Analysis charts (Part 2) valid 0000 UTC January 19 and 1200 UTC January 20, 2008. (Click to enlarge)
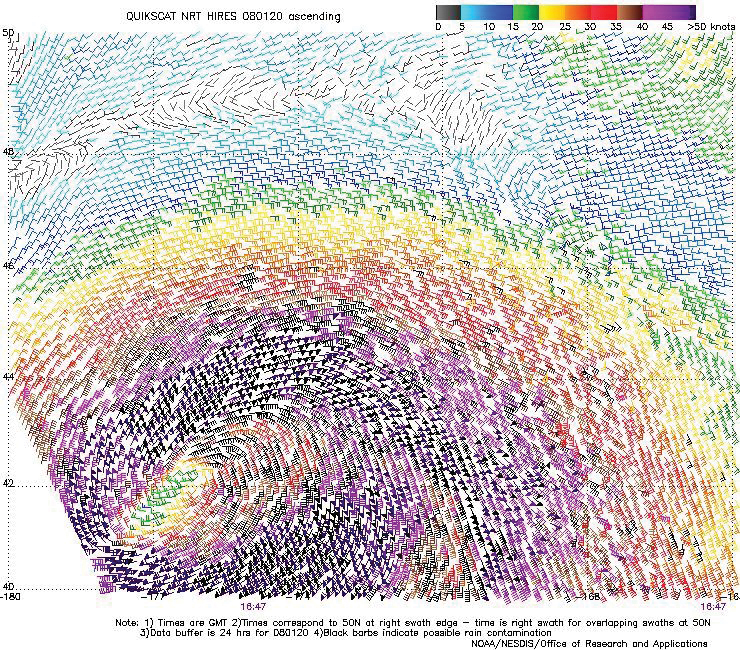
Figure 7. High resolution QuikScat scatterometer image of satellite-sensed winds
around the storm depicted in the second part of Figure 6. The valid time of the pass
is 1647 UTC January 20, 2008, or about four and three-quarters hours later than
the valid time of the second part of Figure 6. The storm center appears near 42N
176W in the lower left side of the image. Image is courtesy of NOAA/NESDIS/
Office of Research and Applications. (Click to enlarge)
Western North Pacific and Bering Sea Storm, January 21-25:This cyclone originated south of Japan early on the 20th and quickly intensified to a hurricane force low near 35N 164E early on the 22nd, with a 993 hPa center. The system turned northnortheast into the western Bering Sea late on 23rd, with the central pressure as low as 967 hPa near 56N 173E early on the 24th , and maintaining hurricane force winds until that time. The ship Zim Betjing (A8FU7)(38N 171E) reported south winds of 60 kts at 1800 UTC on the 22nd followed by a report of south winds of 55 kts and 11.5 meter seas (37 feet) near 38N 173E six hours later. The vessel Sea- Land Comet (WDB9950)(40N 173E) encountered south winds of 45 kts and 10.5 meter seas (35 feet) at 0300 UTC on the 23rd. The buoy 46070 (55N 175.3E) reported at 1900 UTC on the 23rd east winds of 54 kts with gusts to 74 kts and 11.0 meter seas (36 feet). Highest seas at that buoy were 14.5 meters (48 feet) four hours later. The central Bering Sea buoy 46035 (57.1N 177.8W) reported east winds of 52 kts with gusts to 68 kts and seas 8.0 meters (26 feet) at 0100 UTC January 24, and maximum significant wave heights 10.5 meters (34 feet) two hours later. The cyclone then weakened to a gale in the central Bering Sea by the 25th before redeveloping as a storm force low in the northeast Gulf of Alaska later that day and moving into Southeast Alaska on the 26th.
North Pacific Storm, January 29-31:This cyclone moved from initial development east of Japan near 160E early on the 27th northeastward to British Columbia on the 31st. The low developed hurricane force winds on the morning of the 29th as it passed just south of the eastern Aleutians with a 979 hPa center. A high resolution scatterometer pass later that day revealed winds as high as 65 kts south of the center. The cyclones winds then weakened to storm force in the Gulf of Alaska on the 30th and to gale force before moving ashore on the 31st.
Western North Pacific and Bering Sea Storm, January 29-February 1:This cyclone moved from initial development south of Japan early on the 28th to the western Aleutians at months end, accompanied by hurricane force winds on the 30th when passing near 45N 168E. The lowest central pressure reached was 964 hPa at 1800 UTC on the 30th. The system then drifted northwest in the western Bering Sea February 1 while weakening to a gale, and dissipated near the Kamchatka Peninsula on February 5.
North Pacific Storm, February 3-6:This cyclone originated south of Japan late on the 2nd at about the same time that the eastern cyclone (described below) formed. It rapidly developed while tracking northeast, becoming a compact hurricane force low at 1800 UTC on the 3rd while passing near 37N 151E with a 973 hPa center. The central pressure dropped an impressive 35 hPa in the twenty four hour period ending at that time. A high resolution QuikScat pass on the evening of the 3rd revealed winds 50 to 75 kts on the south side and 60 kts on the northwest side in a pattern similar to Figure 9. Hurricane force winds continued until 0600 UTC on the 5th when the center developed a lowest central pressure of 958 hPa near 46N 176E. At 0000 UTC on the 4th the ship APL China (WDB3161)(35N 154E) reported west winds of 50 kts and 9.5 meter seas (31 feet) followed by a report of northwest winds of 50 kts and 10.5 meter seas (35 feet) near 36N 155E five hours later. The World Spirit (ELWG) near 33N 157E reported southwest winds of 55 kts and 8.5 meter seas (28 feet) at 0000 UTC on the 4th. A weakening trend followed as the system elongated east-northeast on the 5th and 6th and weakened to a gale late on the 6th. Figure 8 (Part 1) shows the weakening cyclone (992 hPa) over the south central waters.
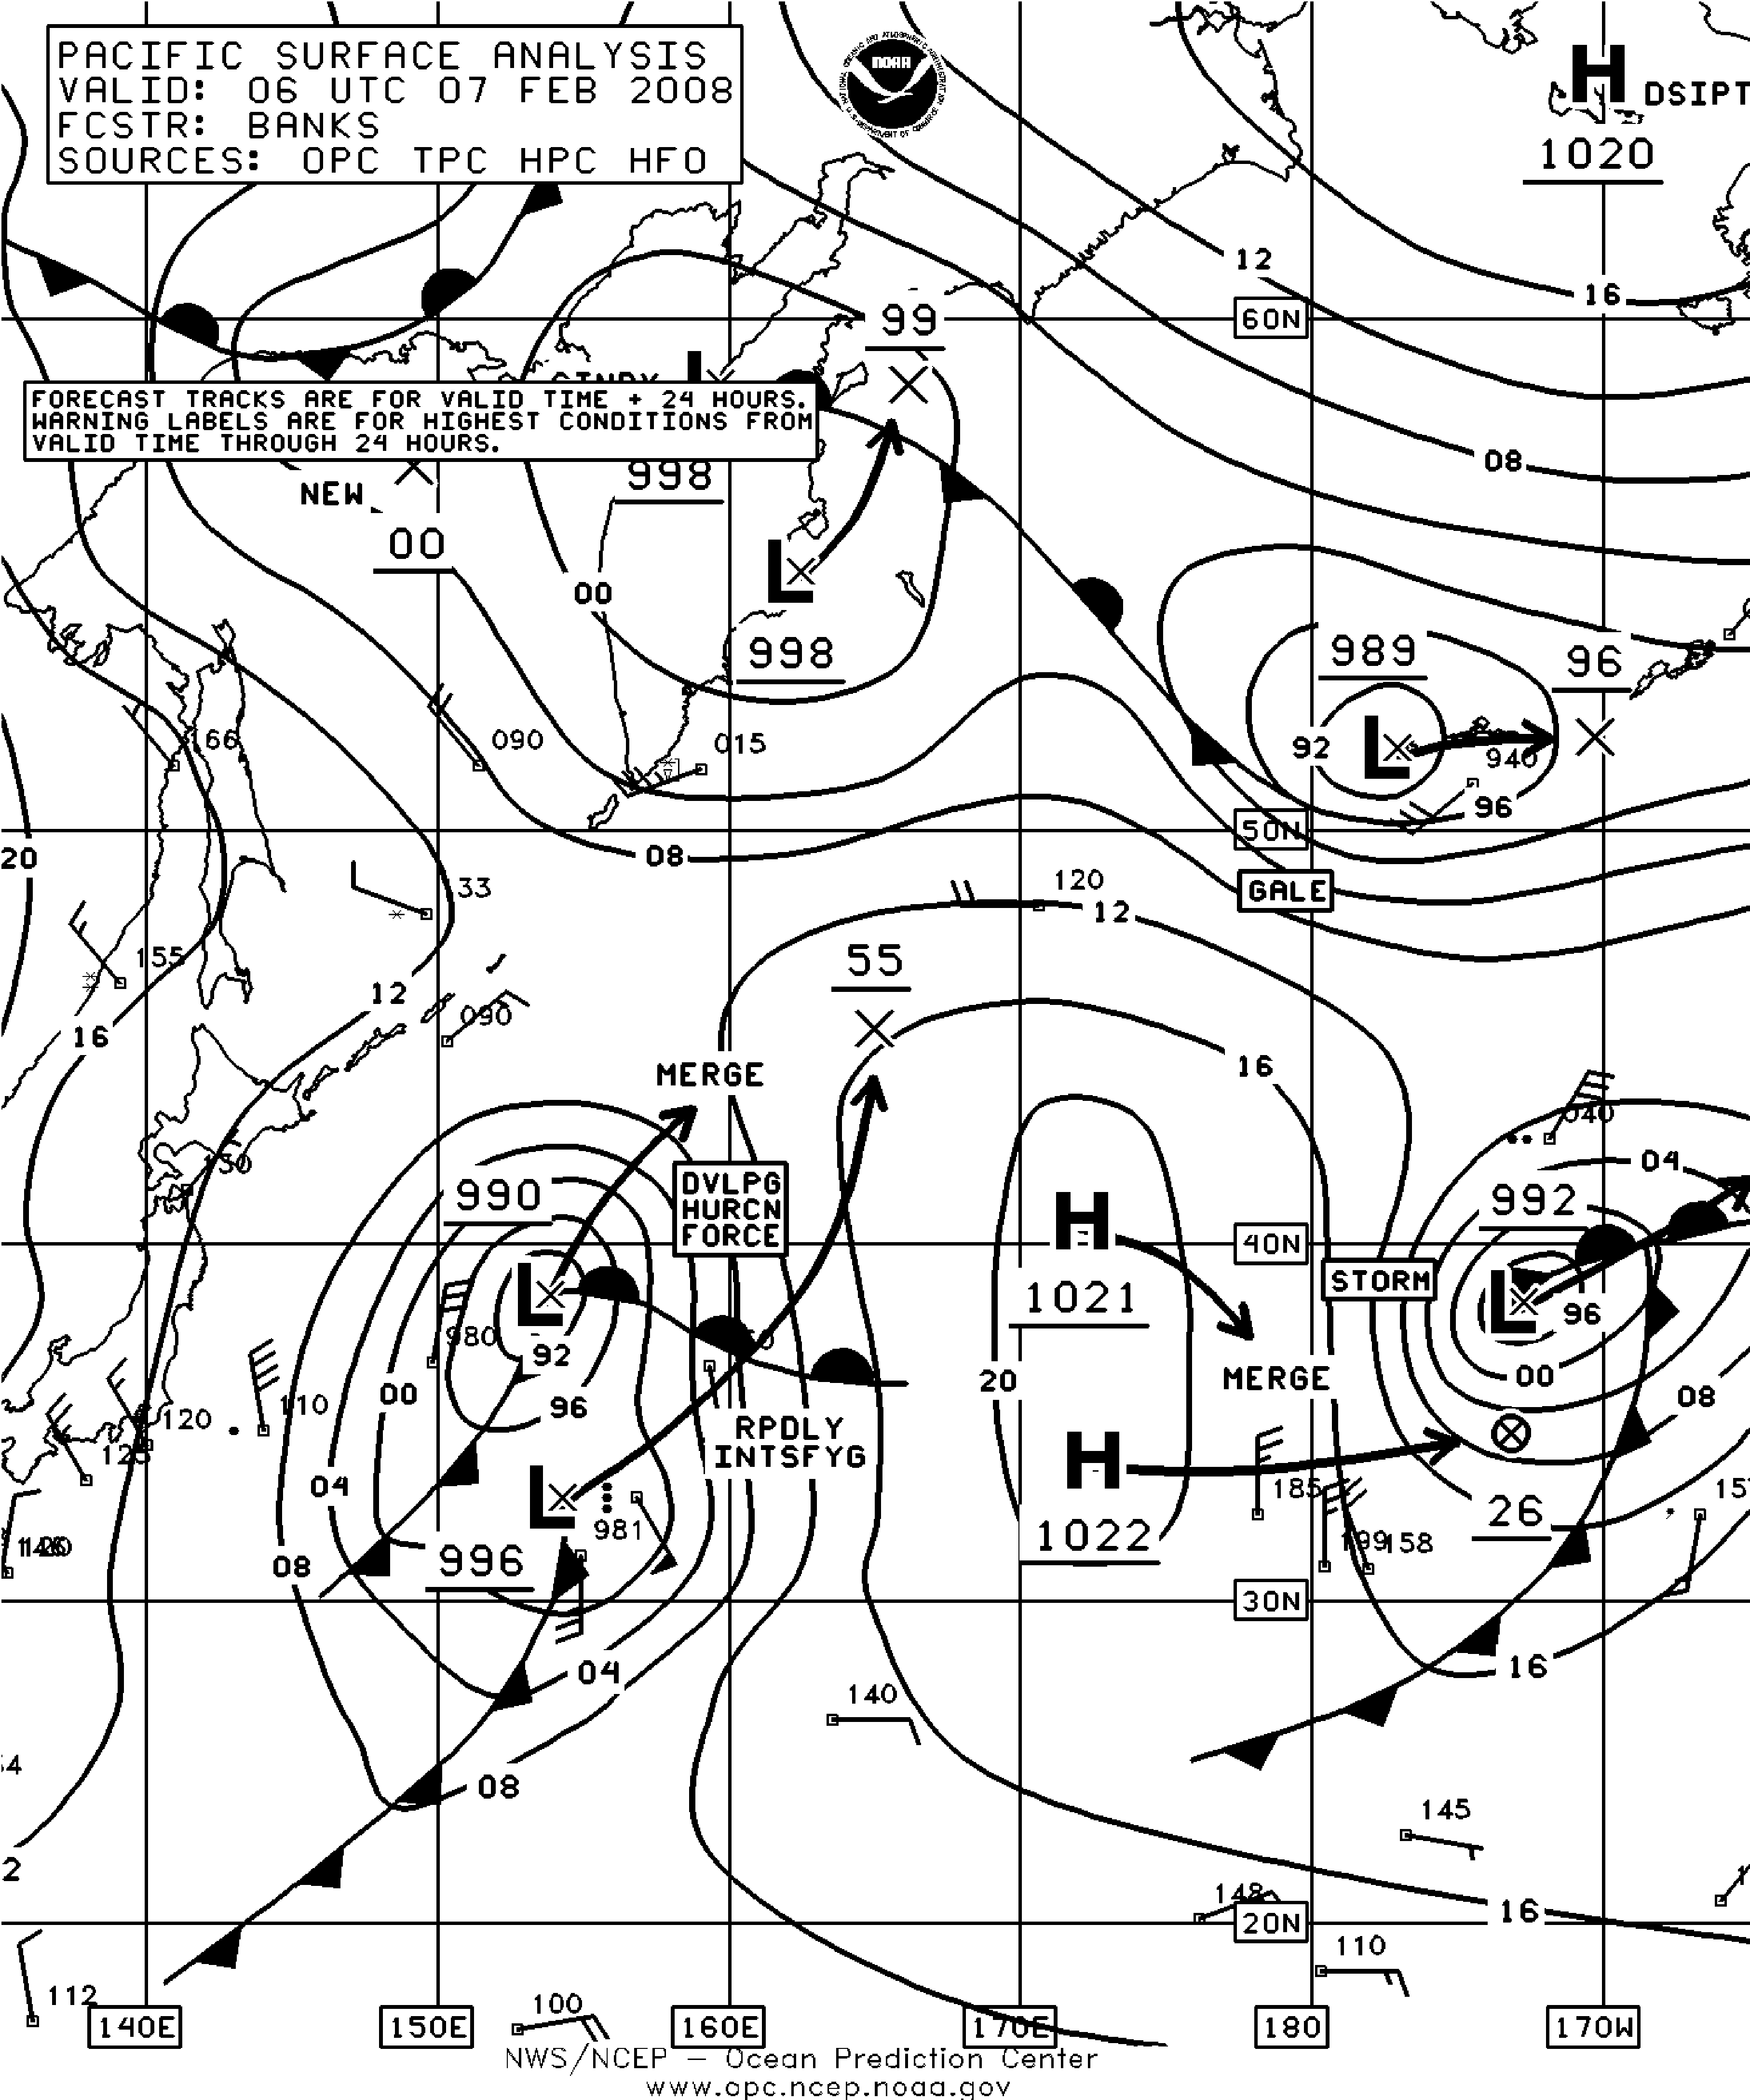
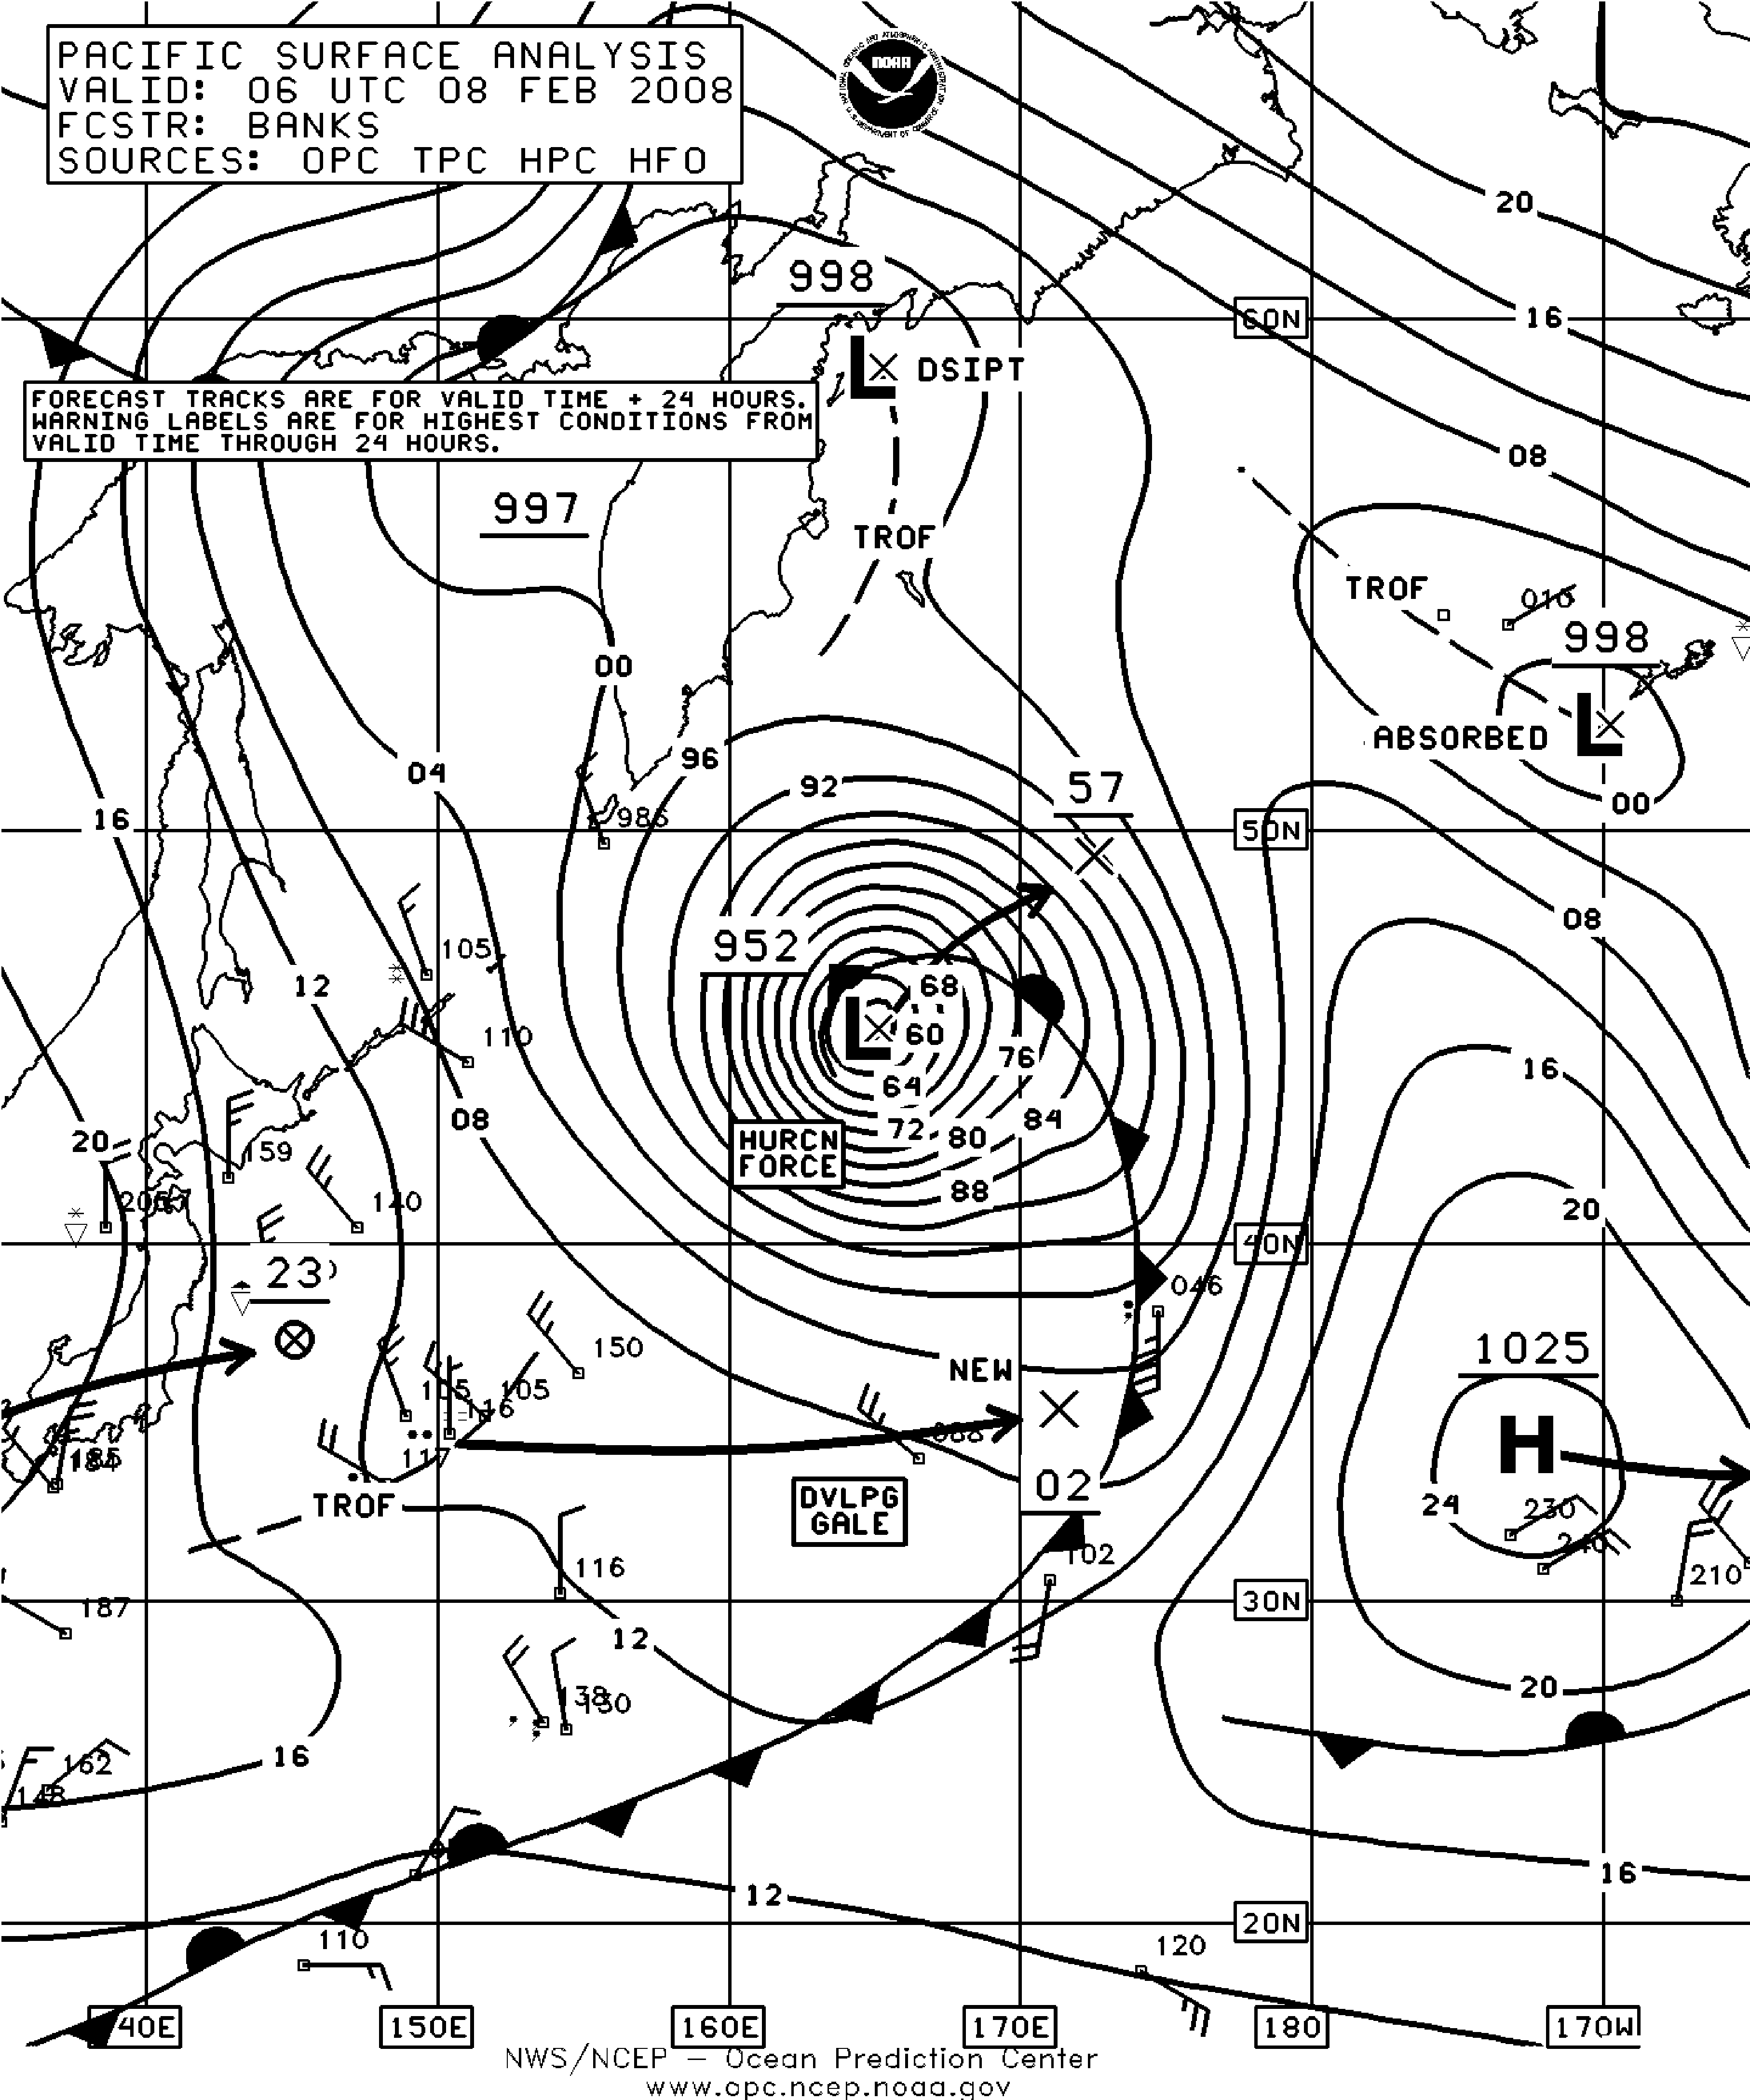
Figure 8. OPC North Pacific Surface Analysis charts (Part 2) valid 0600 UTC February 7 and 8, 2008. (Click to enlarge)
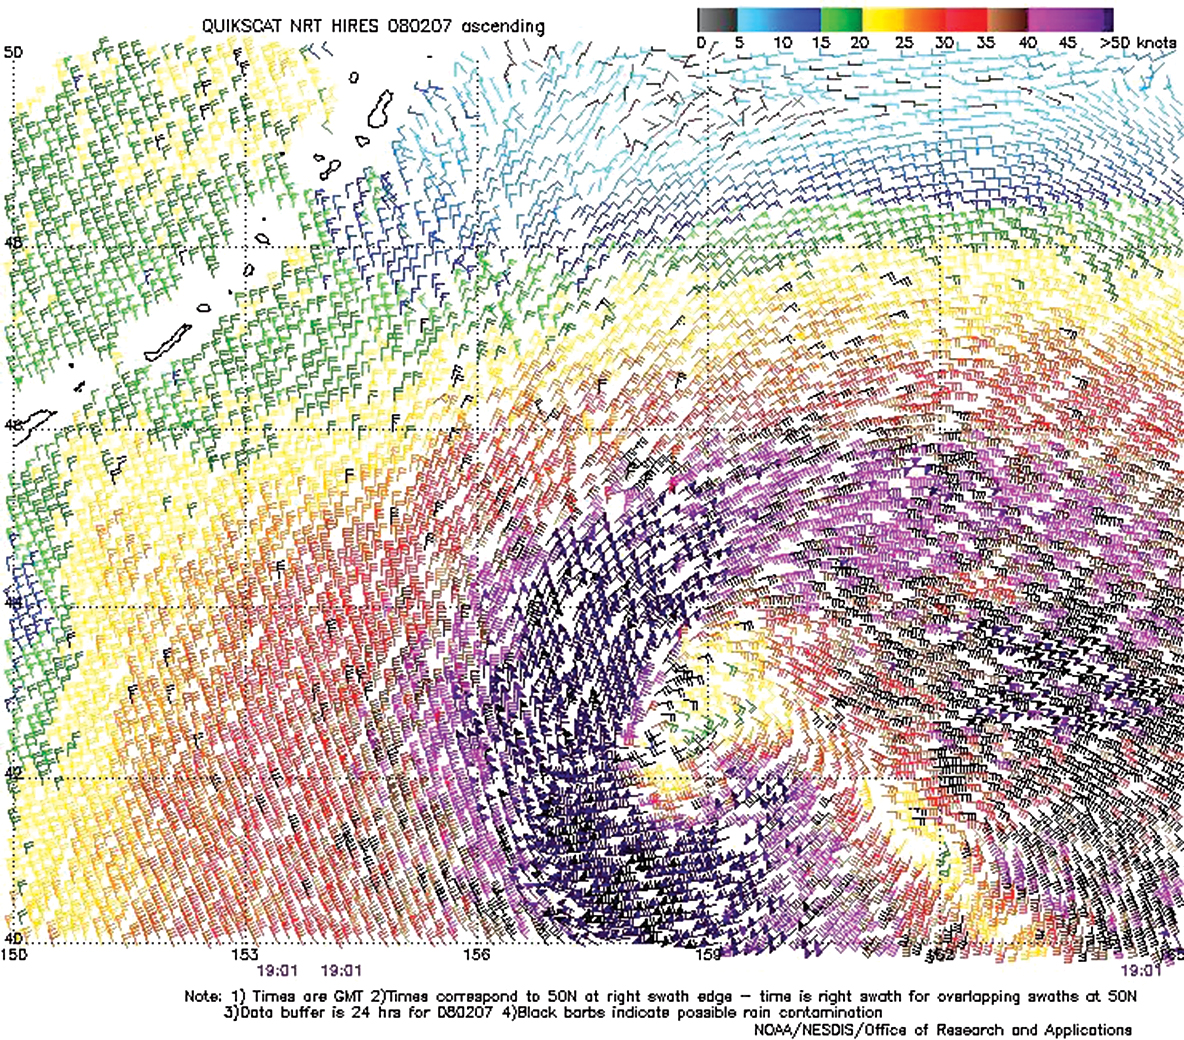
Figure 9. High resolution QuikScat scatterometer image of satellite-sensed winds
around the storm depicted in the second part of Figure 6. The valid time of the pass
is 1647 UTC January 20, 2008, or about four and three-quarters hours later than
the valid time of the second part of Figure 6. The storm center appears near 42N
176W in the lower left side of the image. Image is courtesy of NOAA/NESDIS/
Office of Research and Applications. (Click to enlarge)
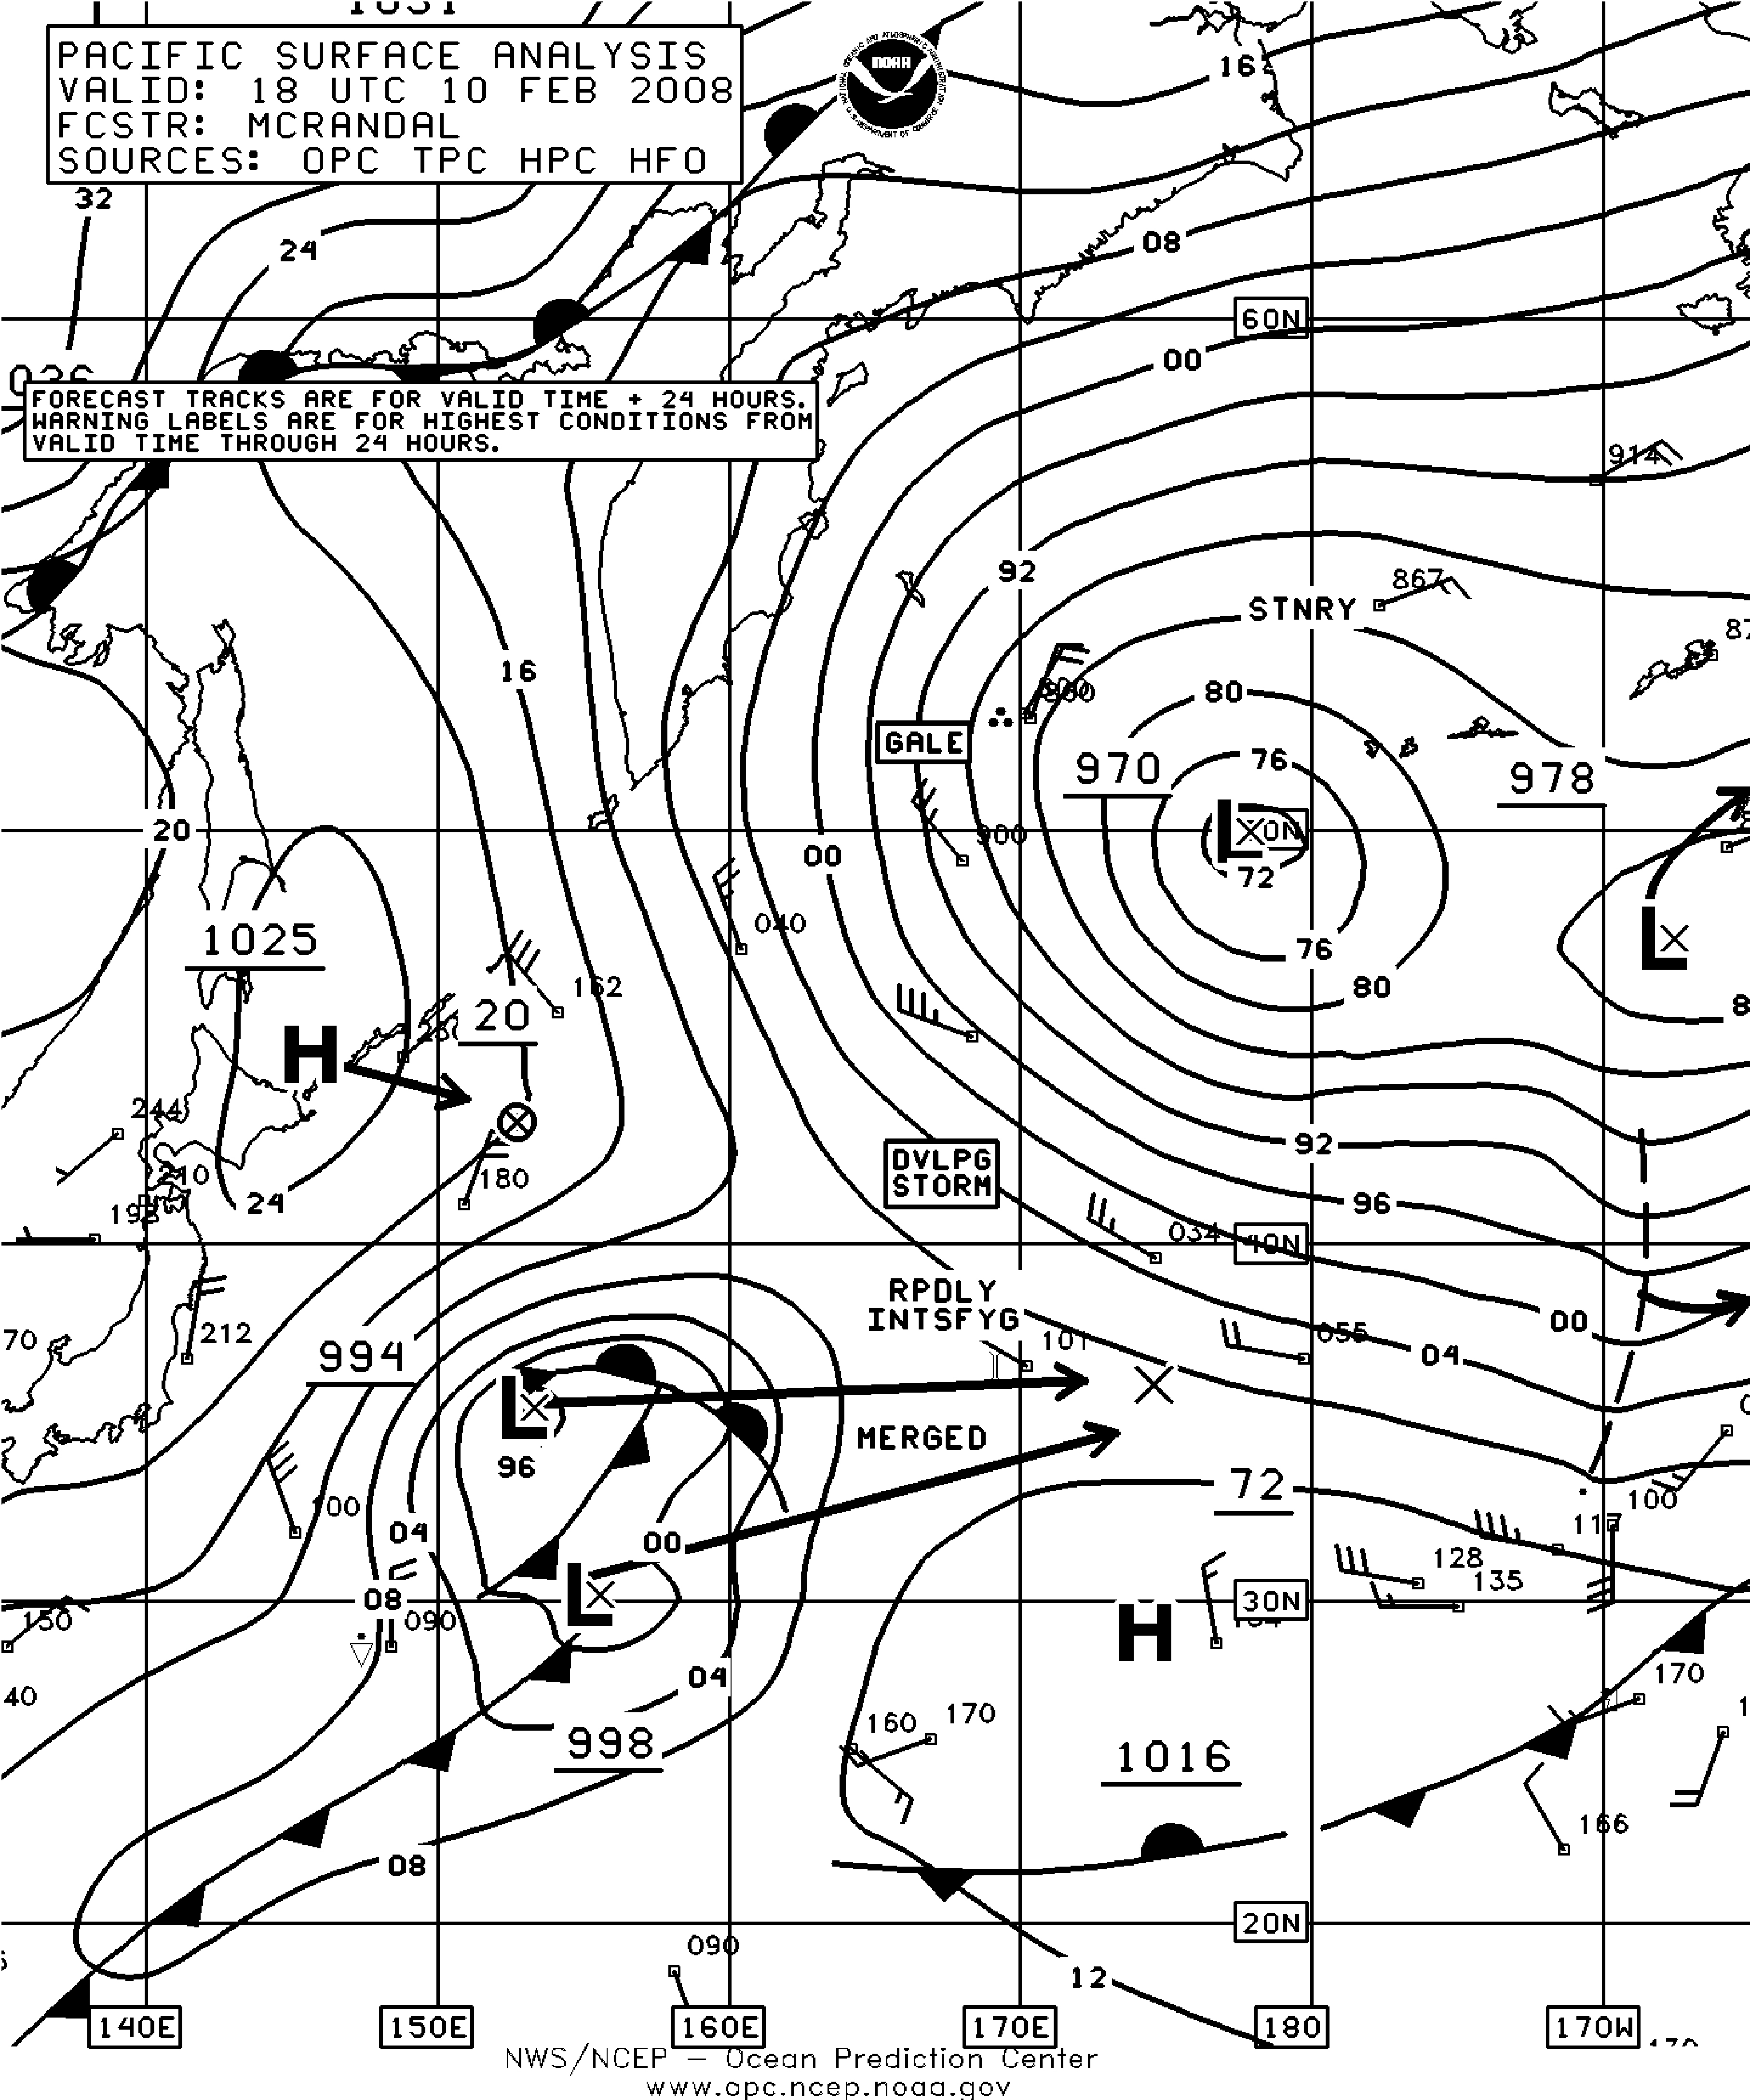
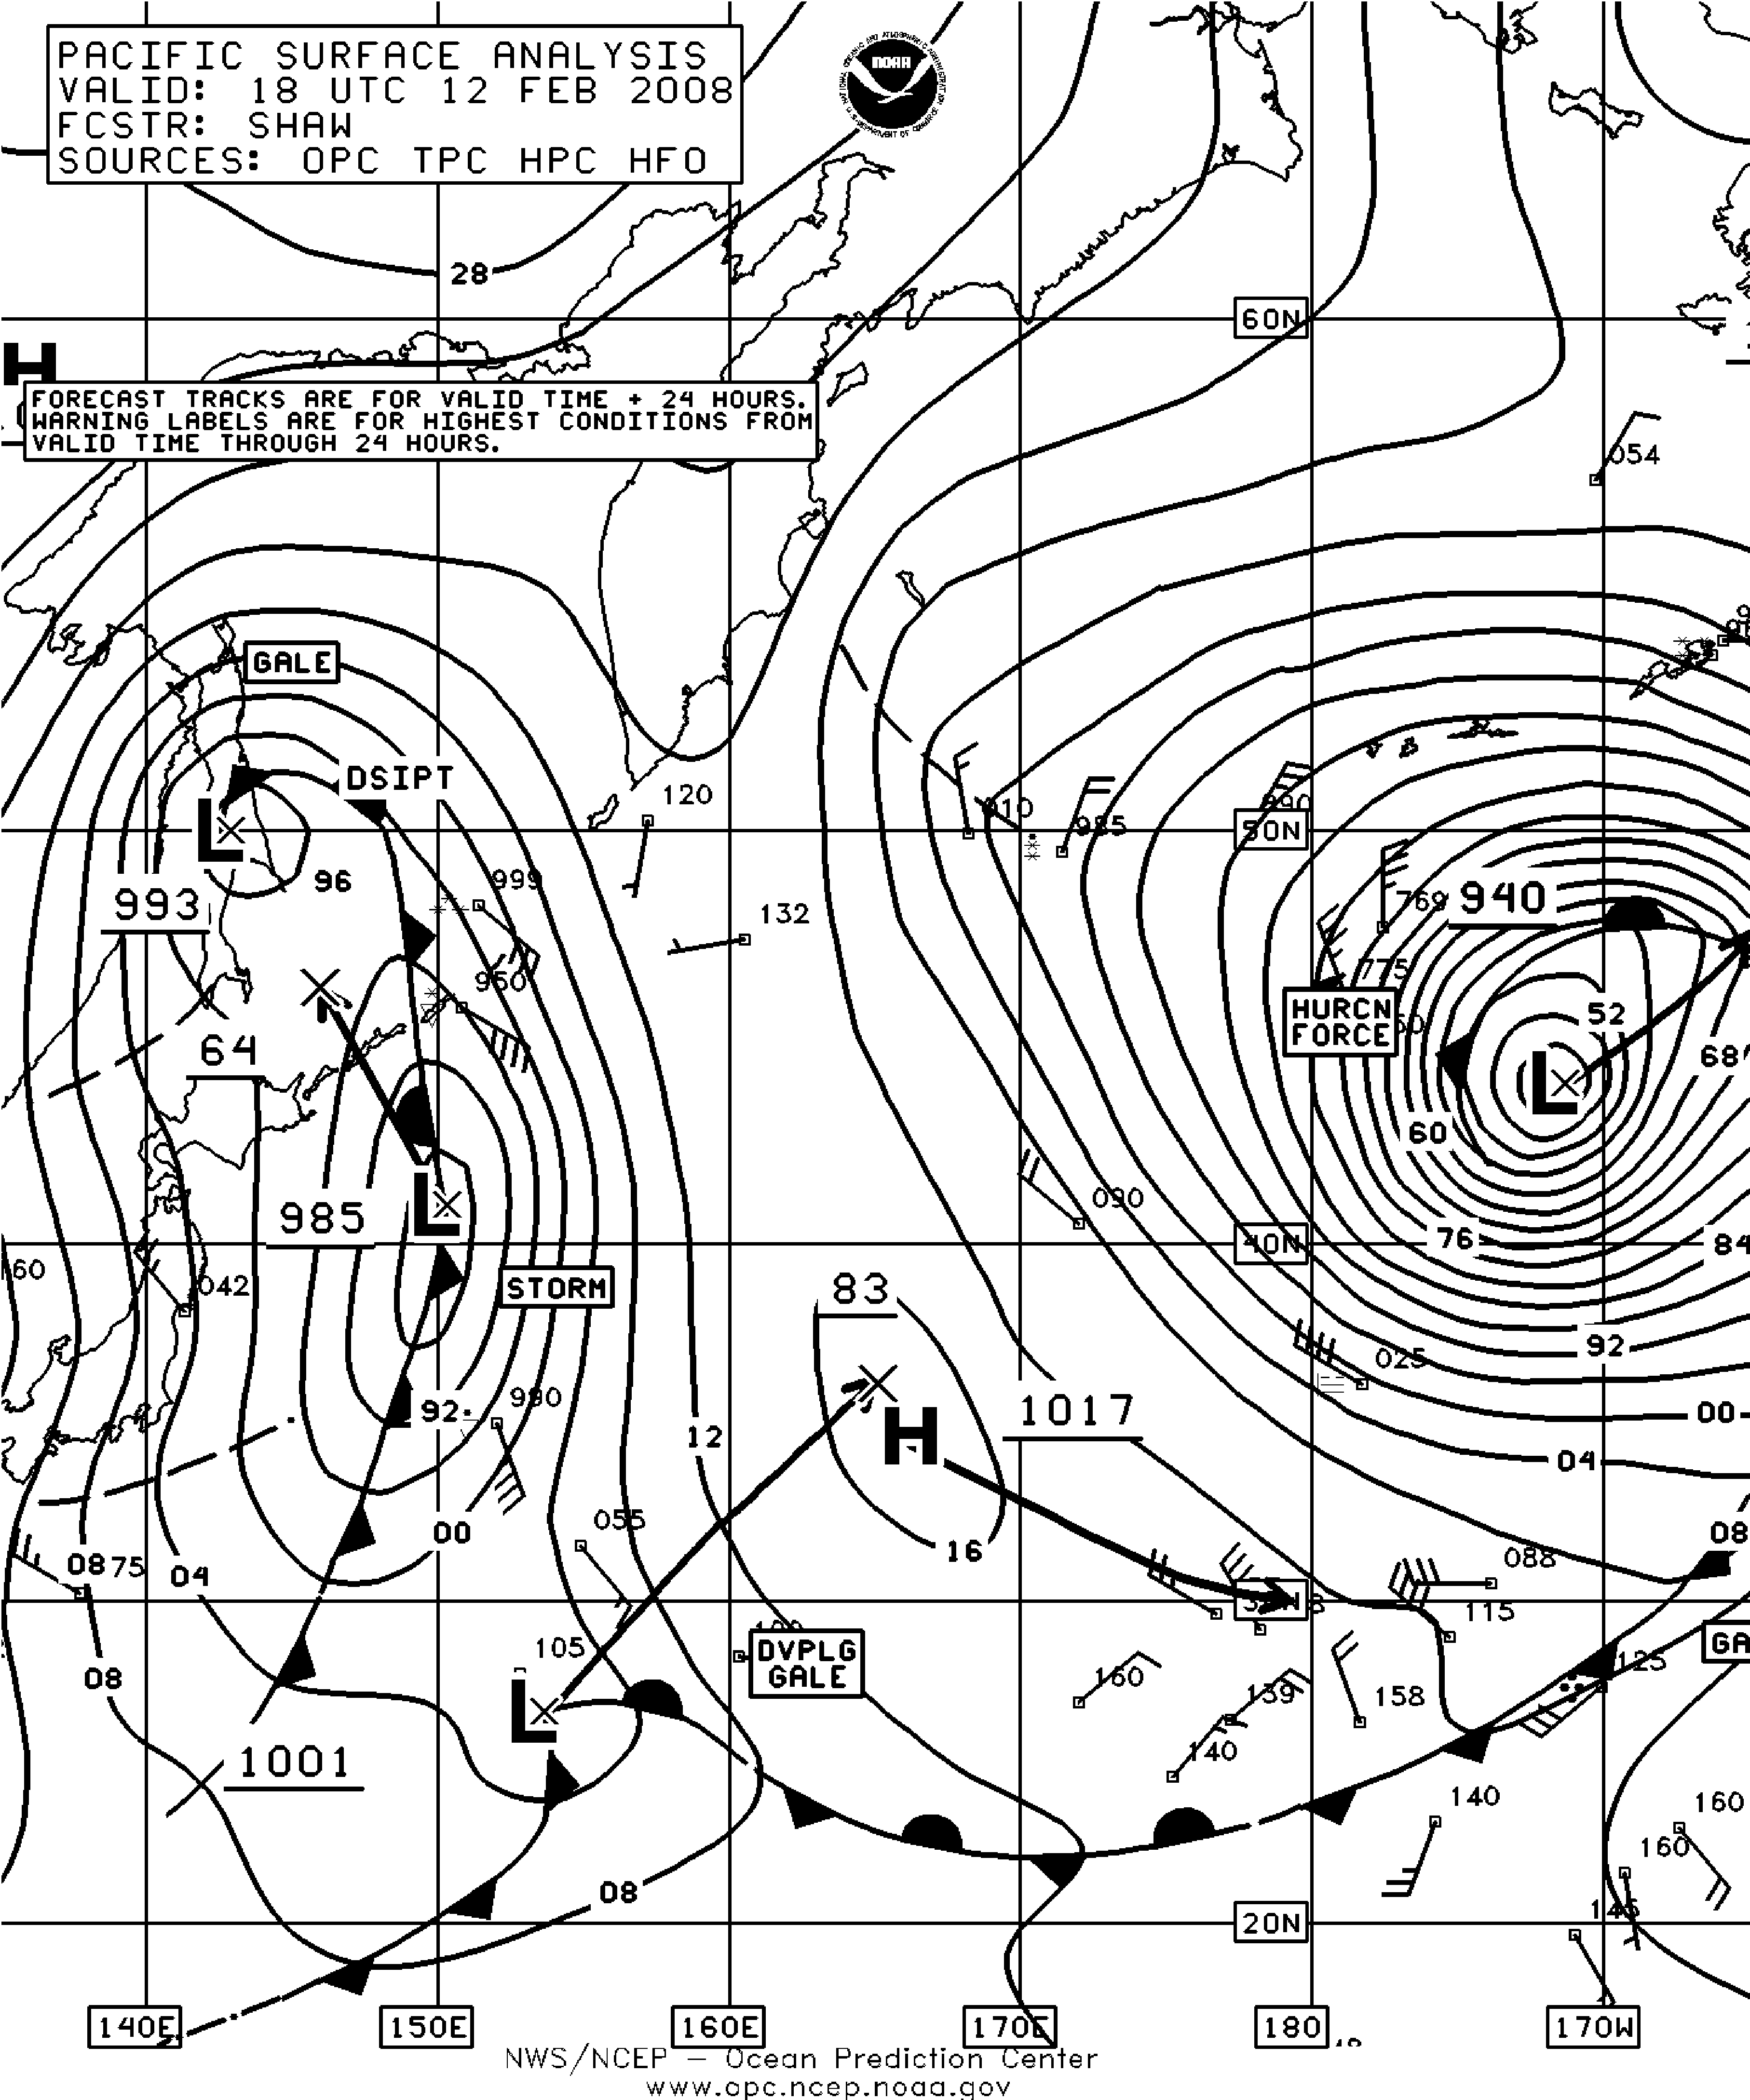
Figure 10. OPC North Pacific Surface Analysis charts (Part 2) valid 1800 UTC February 10 and 12, 2008. (Click to enlarge)
Eastern North Pacific Storm, February 3-6:This cyclone originated near the dateline at 31N late on the 2nd and moved northeast, briefly developing hurricane force winds early on the 5th as it passed near 52N 134W with a 983 hPa center. The lowest central pressure was 978 hPa near 54N 132W at 1800 UTC on the 5th. The cyclone moved inland shortly thereafter. The ship Lily Oldendorff (A8AY3)(41N 140W) reported southwest winds of 60 kts at 0600 UTC on the 5th. The ship SeaBulk Pride (WCY7052)(50N 134W) reported west winds of 55 kts and 9.5 meter seas (31 feet) twelve hours later, while the SeaLand Tacoma (KGTY) encountered southwest winds of 50 kts and 6.0 meter seas. The buoy 46036 (48.4N 133.9W) reported west winds of 45 kts and 5.5 meter seas (18 feet) at 1200 UTC on the 5th, followed by a report of 9.0 meter seas (30 feet) four hours later.
Western North Pacific Storm, February 6-10:Figure 8 depicts the explosive development of this cyclone as the two lows in the first part merged. The central pressure dropped 38 hPa in the twenty four hour period ending at 0600 UTC on the 8th. The second part of Figure 8 shows the cyclone at maximum intensity. The winds around this storm at 1900 UTC on the 7th appear in Figure 9 with winds to 80 kts south of the center and winds to 70 kts even appearing north of the center. The ship Skaubryn (LAJV4)(53N 173E) reported east winds of 50 kts and 9.0 meter seas (29 feet) at 0600 UTC on the 9th. The APL Singapore (WCX8812) reported a northwest wind of 45 kts and 10.5 meter seas (35 feet) near 51N 165E at 1800 UTC on the 9th. Twelve hours later the vessel Baltic Soul (9HCP7) (48N 167E) encountered northwest winds of 50 kts and 14.5 meter seas (47 feet). The cyclone then headed northeast and started to weaken on the 8th, with the winds weakening to gale force as the center passed just south of the central Aleutians on the 10th Figure 10. The low became absorbed by the next major storm on the 11th , to be described below.
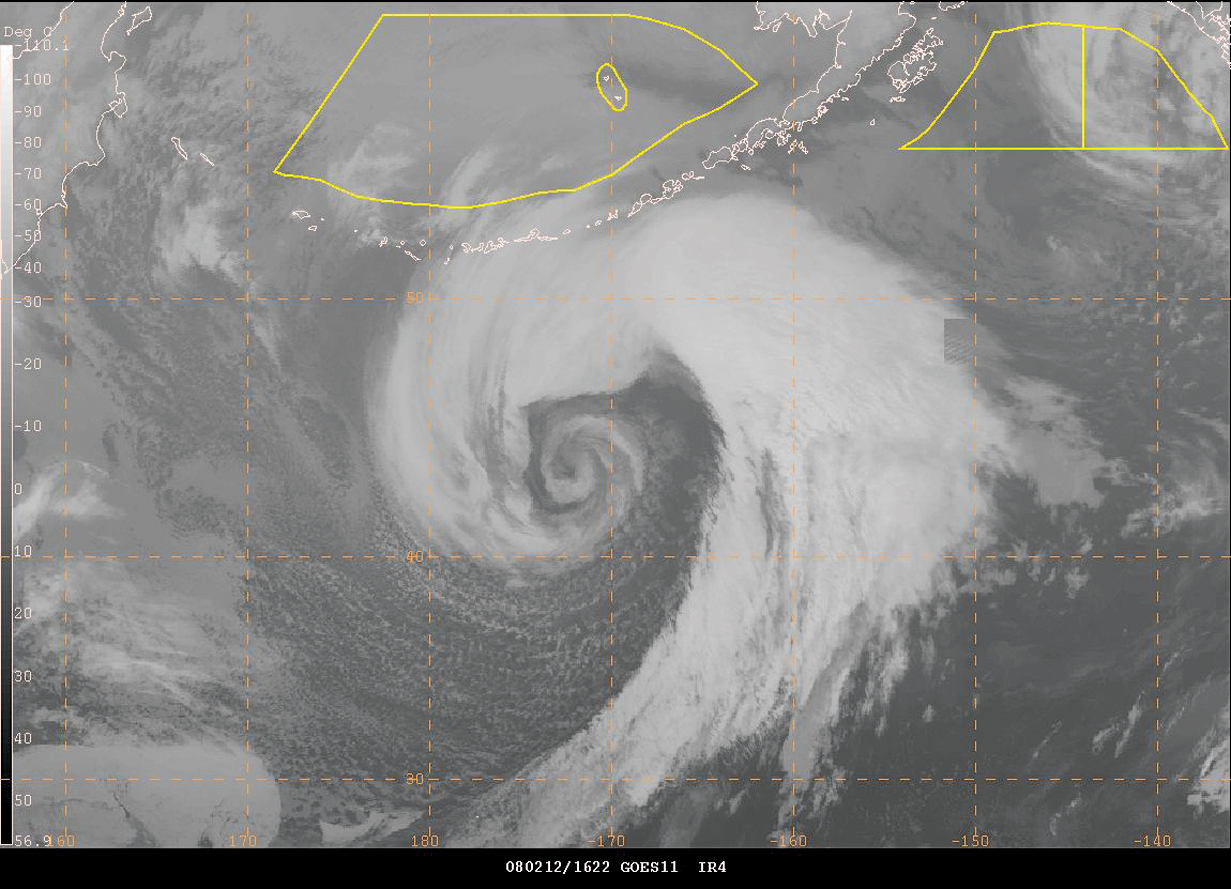
Figure 11. Global mosaic of GOES11 and MTS infrared satellite imagery of the storm in Figure 10 near maximum intensity, valid at 1622 UTC February 12, 2008. Satellite senses temperature on a gray scale ranging from warm (black) to cold (white) in this type of imagery.(Click to enlarge)
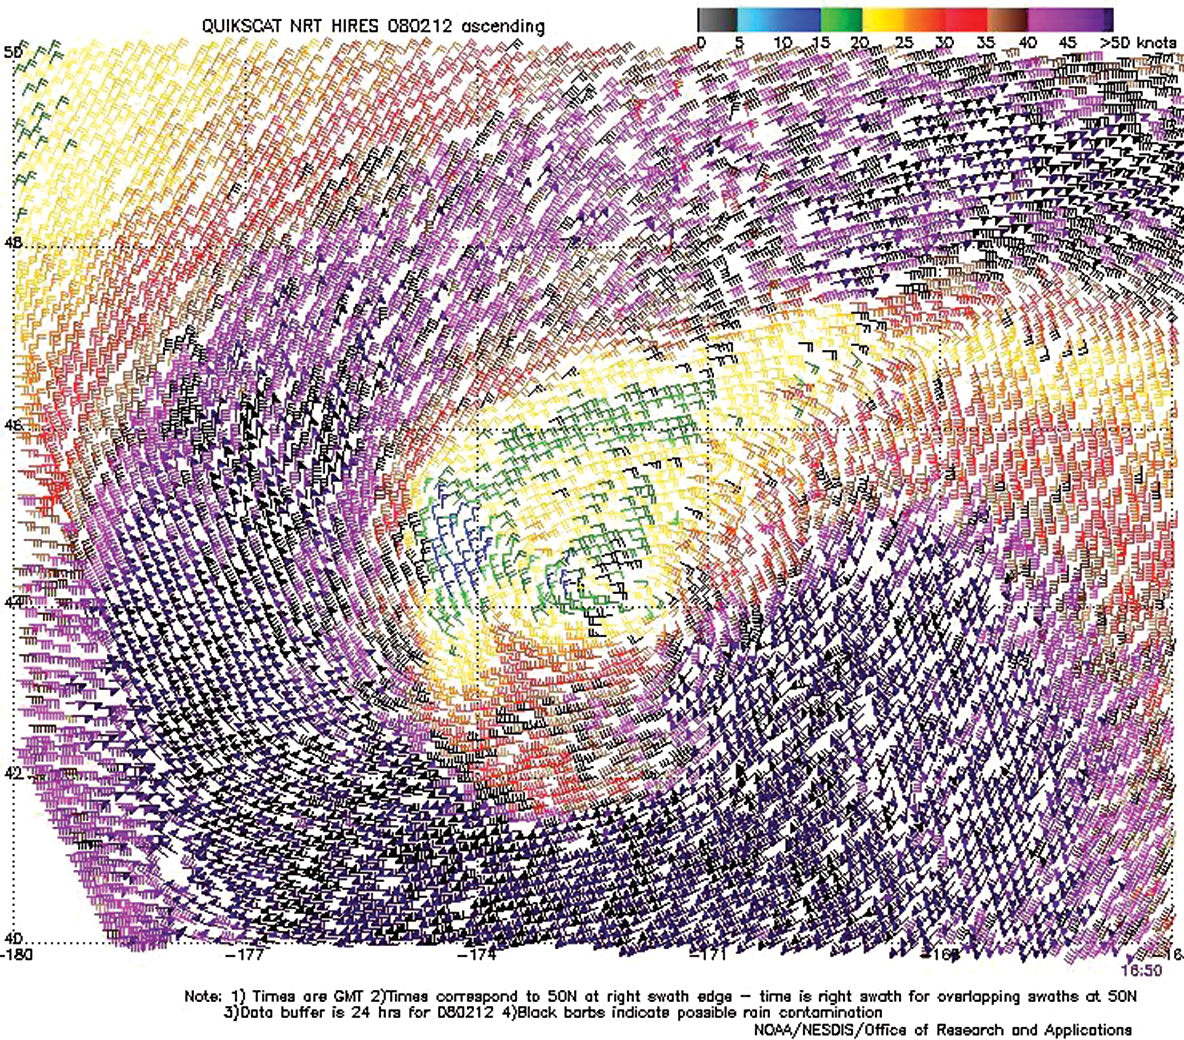
Figure 12. High resolution QuikScat scatterometer image of satellite-sensed winds around the storm shown in the second part of Figure 10. The valid time of the pass is 1650 UTC February 12, 2008, or only about one hour prior to the valid time of the second part of Figure 10. The center of the storm appears at 44N 172W near the center of the image. Image is courtesy of NOAA/NESDIS/ Office of Research and Applications.(Click to enlarge)
North Pacific Storm, February 10-13:Figure 10 shows the explosive development of this storm, in a similar fashion to the preceding event, from the merging of two lows. The central pressure dropped 39 hPa in the twenty four hour period ending at 0000 UTC on the 12th, when the system developed hurricane force winds and a 953 hPa center (40N 180E). The cyclone maintained hurricane force strength through the 12th. The second part of Figure 10 shows the cyclone at maximum intensity with a central pressure down to 940 hPa (27.76 inches), making it the deepest cyclone of the four month period in the North Pacific. Figure 11 is an infrared satellite image of the storm near maximum intensity, showing broad cold-topped frontal bands. There is a cloud band with relatively cold tops wrapping twice around a well defined center and forming a ring, indicative of a very deep system. Figure 12 is a scatterometer image showing a large circulation of storm force winds around the center and hurricane force (up to 75 kts) in the south semicircle of the center. The ship CSCL Kobe (A8AW2)(45N 178W) reported northwest winds of 54 kts and 11.5 meter seas (37 feet) at 1800 UTC on the 12th. The ship Zim Hong Kong (9HGP7)(48N 176W) encountered northwest winds of 50 kts twelve hours later. The drifting buoy 21948 (39.34N 179.07E) reported a pressure of 942.2 hPa at 1800 UTC on the 12th. The cyclone subsequently weakened beginning late on the 12th, with its winds weakening to gale force as the center moved into the Gulf of Alaska late on the 13th. The system then moved inland over Alaska on the 15th.
North Pacific Storm, February 13-16:As a primary storm center developed near Japan on the 12th Figure 10 a southern weaker frontal wave of low pressure formed near 27N 154E at 1800 UTC on the 12th and rapidly intensified while moving northeast, developing into a compact hurricane force cyclone at 1200 UTC on the 14th as the center passed near 44N 173E with a 976 hPa center. A high resolution scatterometer pass about seven hours later revealed west winds of 50 to as high as 80 kts on the south and southeast sides. The cyclone developed a lowest central pressure of 964 hPa as it passed near 47N 180E at 1200 UTC on the 15th, but maximum winds lowered to storm force at that time. The APL Spinel (9VVK) near 37N 179E reported northwest winds of 50 kts and 3.5 meter seas (11 feet) at 1800 UTC on the 14th. The system then redeveloped eastward to a new storm center in the southern Gulf of Alaska the next day. The new cyclone then moved northeast and weakened near the Alaskan coast on the 17th.
Eastern North Pacific Storm, February 18-20: Developing low pressure moved northeast from the south central waters just west of the dateline early on the 18th , developing hurricane force winds by 0000 UTC on the 20th as the center passed near 47N 153W with a lowest central pressure of 960 hPa. About five fours later high resolution scatterometer data revealed west to northwest winds to 65 kts southwest of the center. The World Spirit (ELWG7) reported southeast winds of 60 kts and 9.0 meter seas (30 feet) at 0600 UTC on the 20th. Twelve hours later the vessel Hyundai Emperor (MDWP6)(51N 144W) encountered southwest winds of 35 kts and 10.5 meter seas (37 feet). The maximum winds weakened to storm force on the 20th and then to gale force by early on the 21st as the system stalled in the northern Gulf of Alaska. Dissipation followed by the 23rd.
Western North Pacific Storm, February 22-25: Figure 13 shows this cyclone already well-developed east of Japan. It originated from a complex system consisting of a primary low in the Sea of Japan and a secondary cyclone just east of Japan late on the 22nd. There was a brief period of hurricane force winds with this system late on the 23rd as depicted in Figure 14, which shows northwest winds to 65 kts in the Sea of Japan, near the east coast of Japan and on the northeast corner of the image. The Hoechst Express (DHER) reported northwest winds of 60 kts near 40N 139E at 1200 UTC on the 23rd, followed twelve hours later with a report of north winds of 50 kts and 12.0 meter seas (39 feet). The cyclone moved north while slowly deepening on the 24th, but with its winds below hurricane force. The lowest central pressure was 961 hPa near 49N 169E early on the 25th. The cyclone then weakened near the Kamchatka Peninsula late on the 25th.
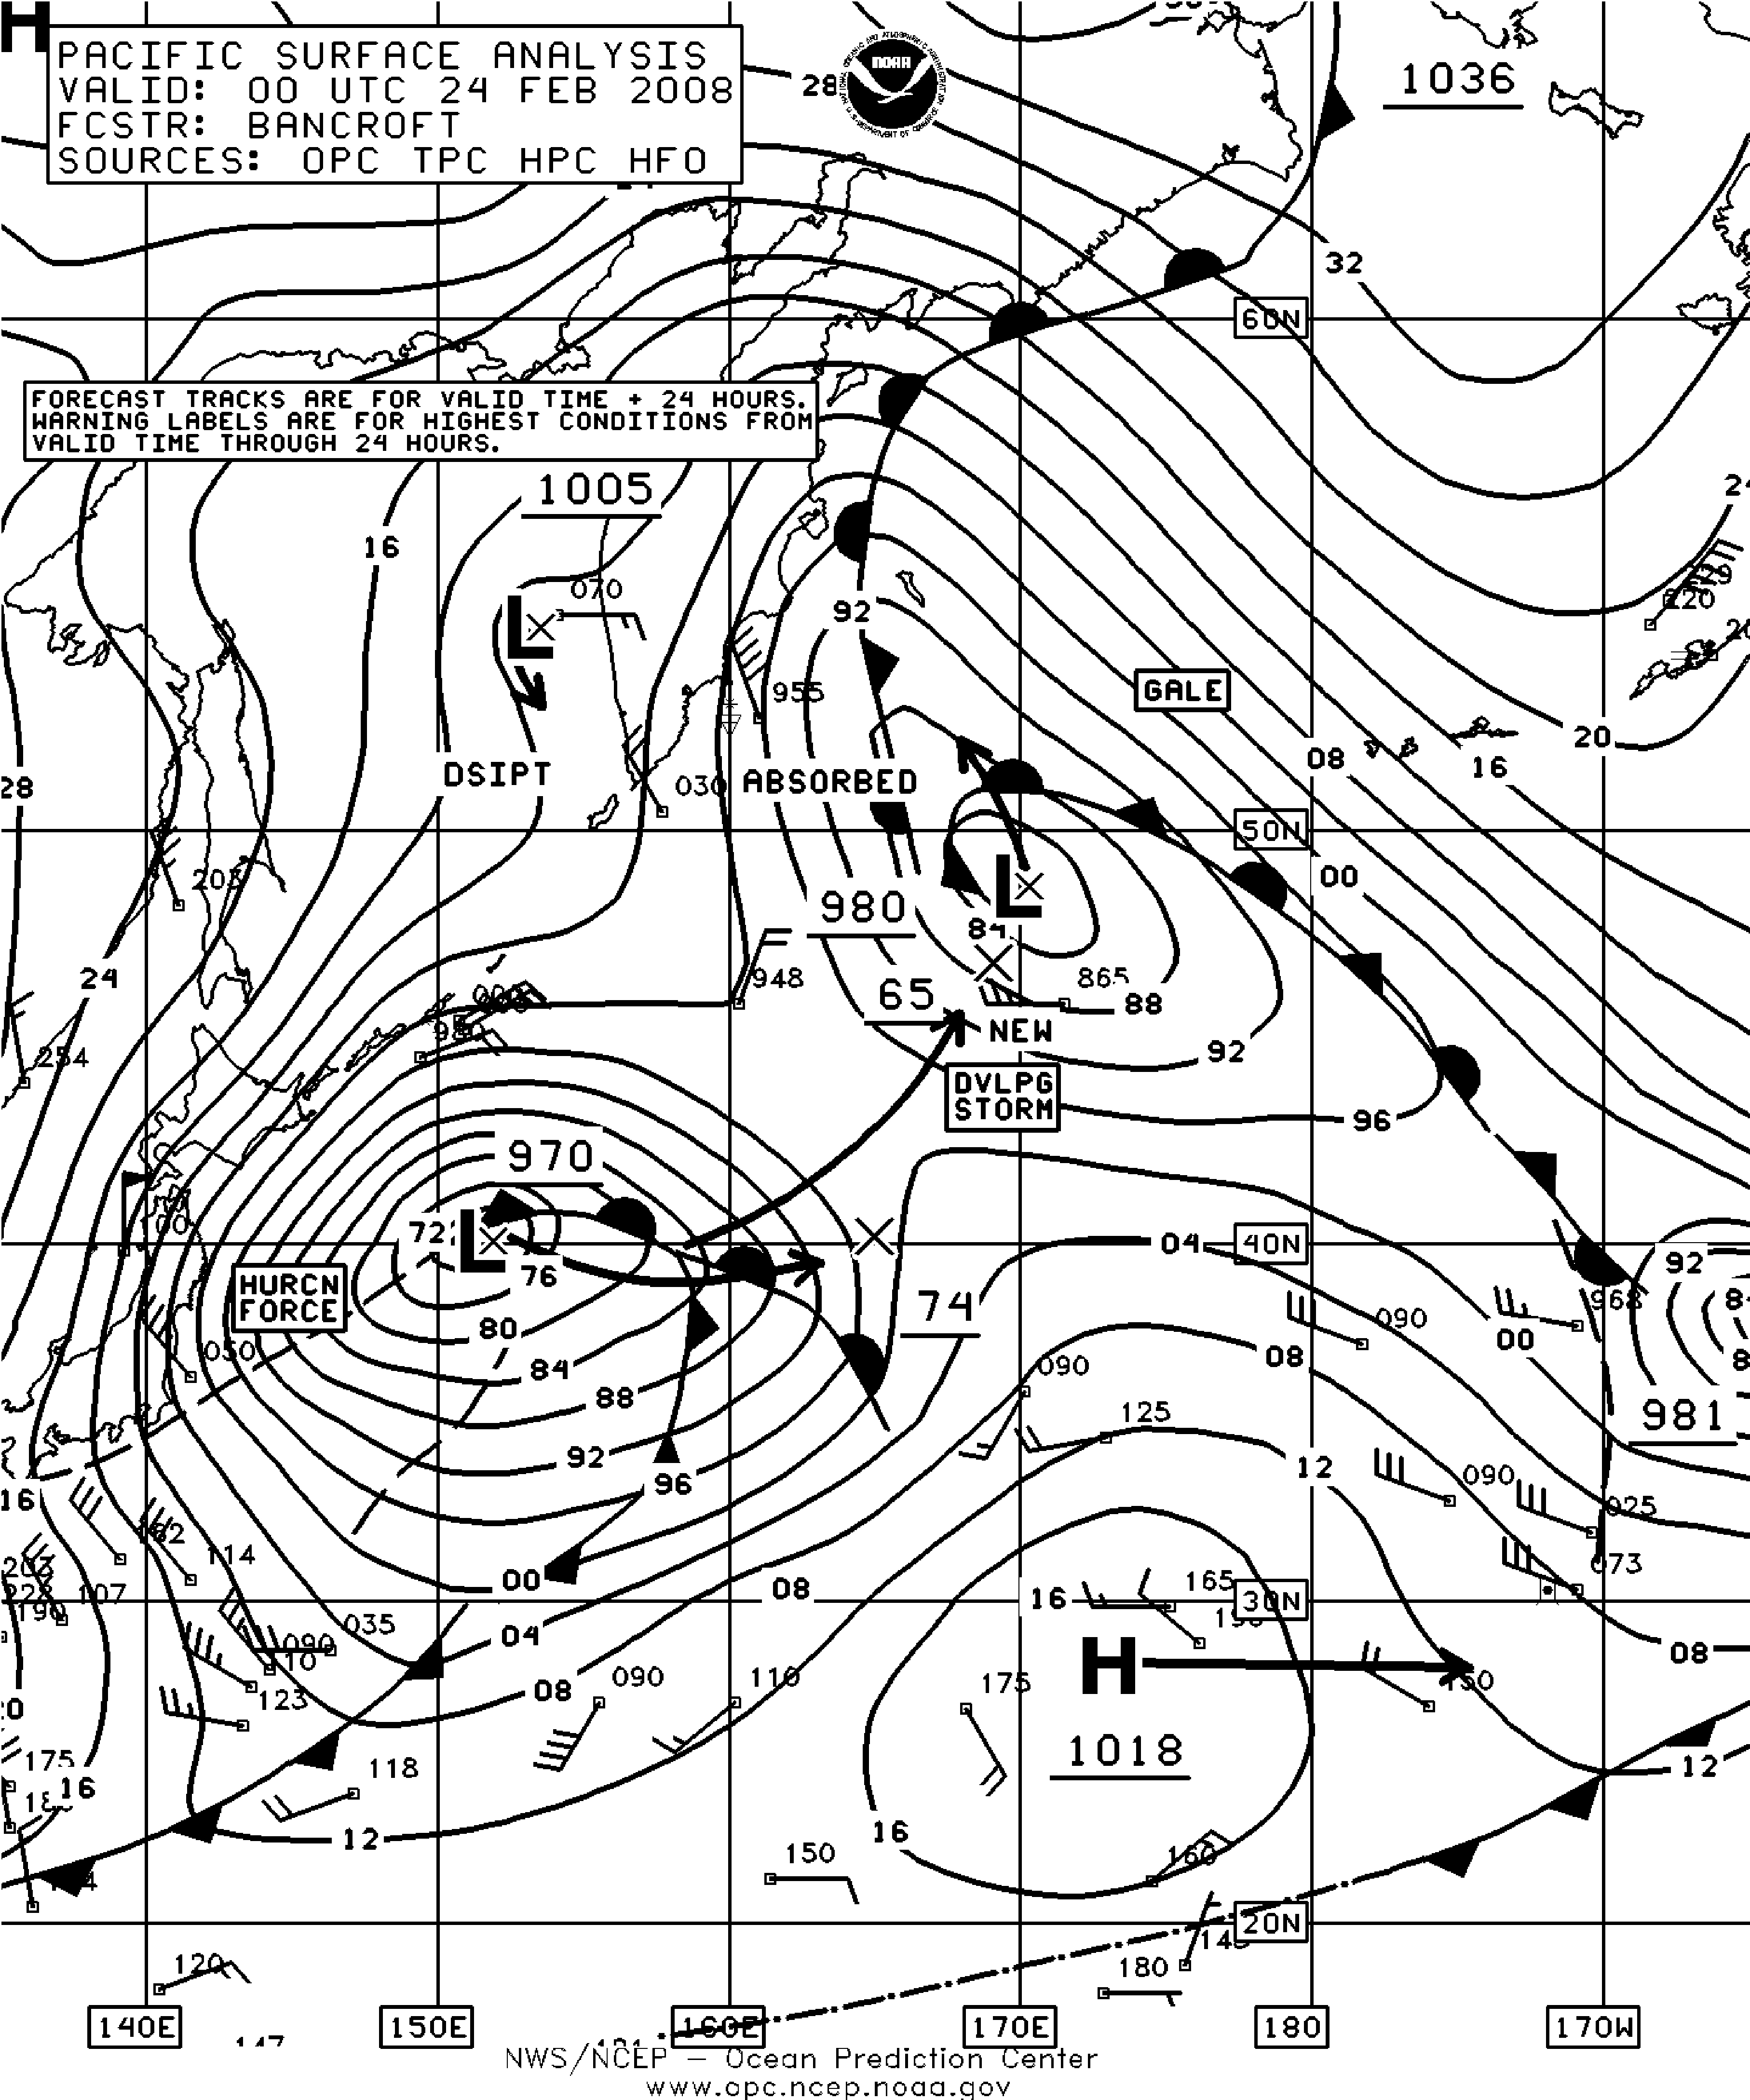
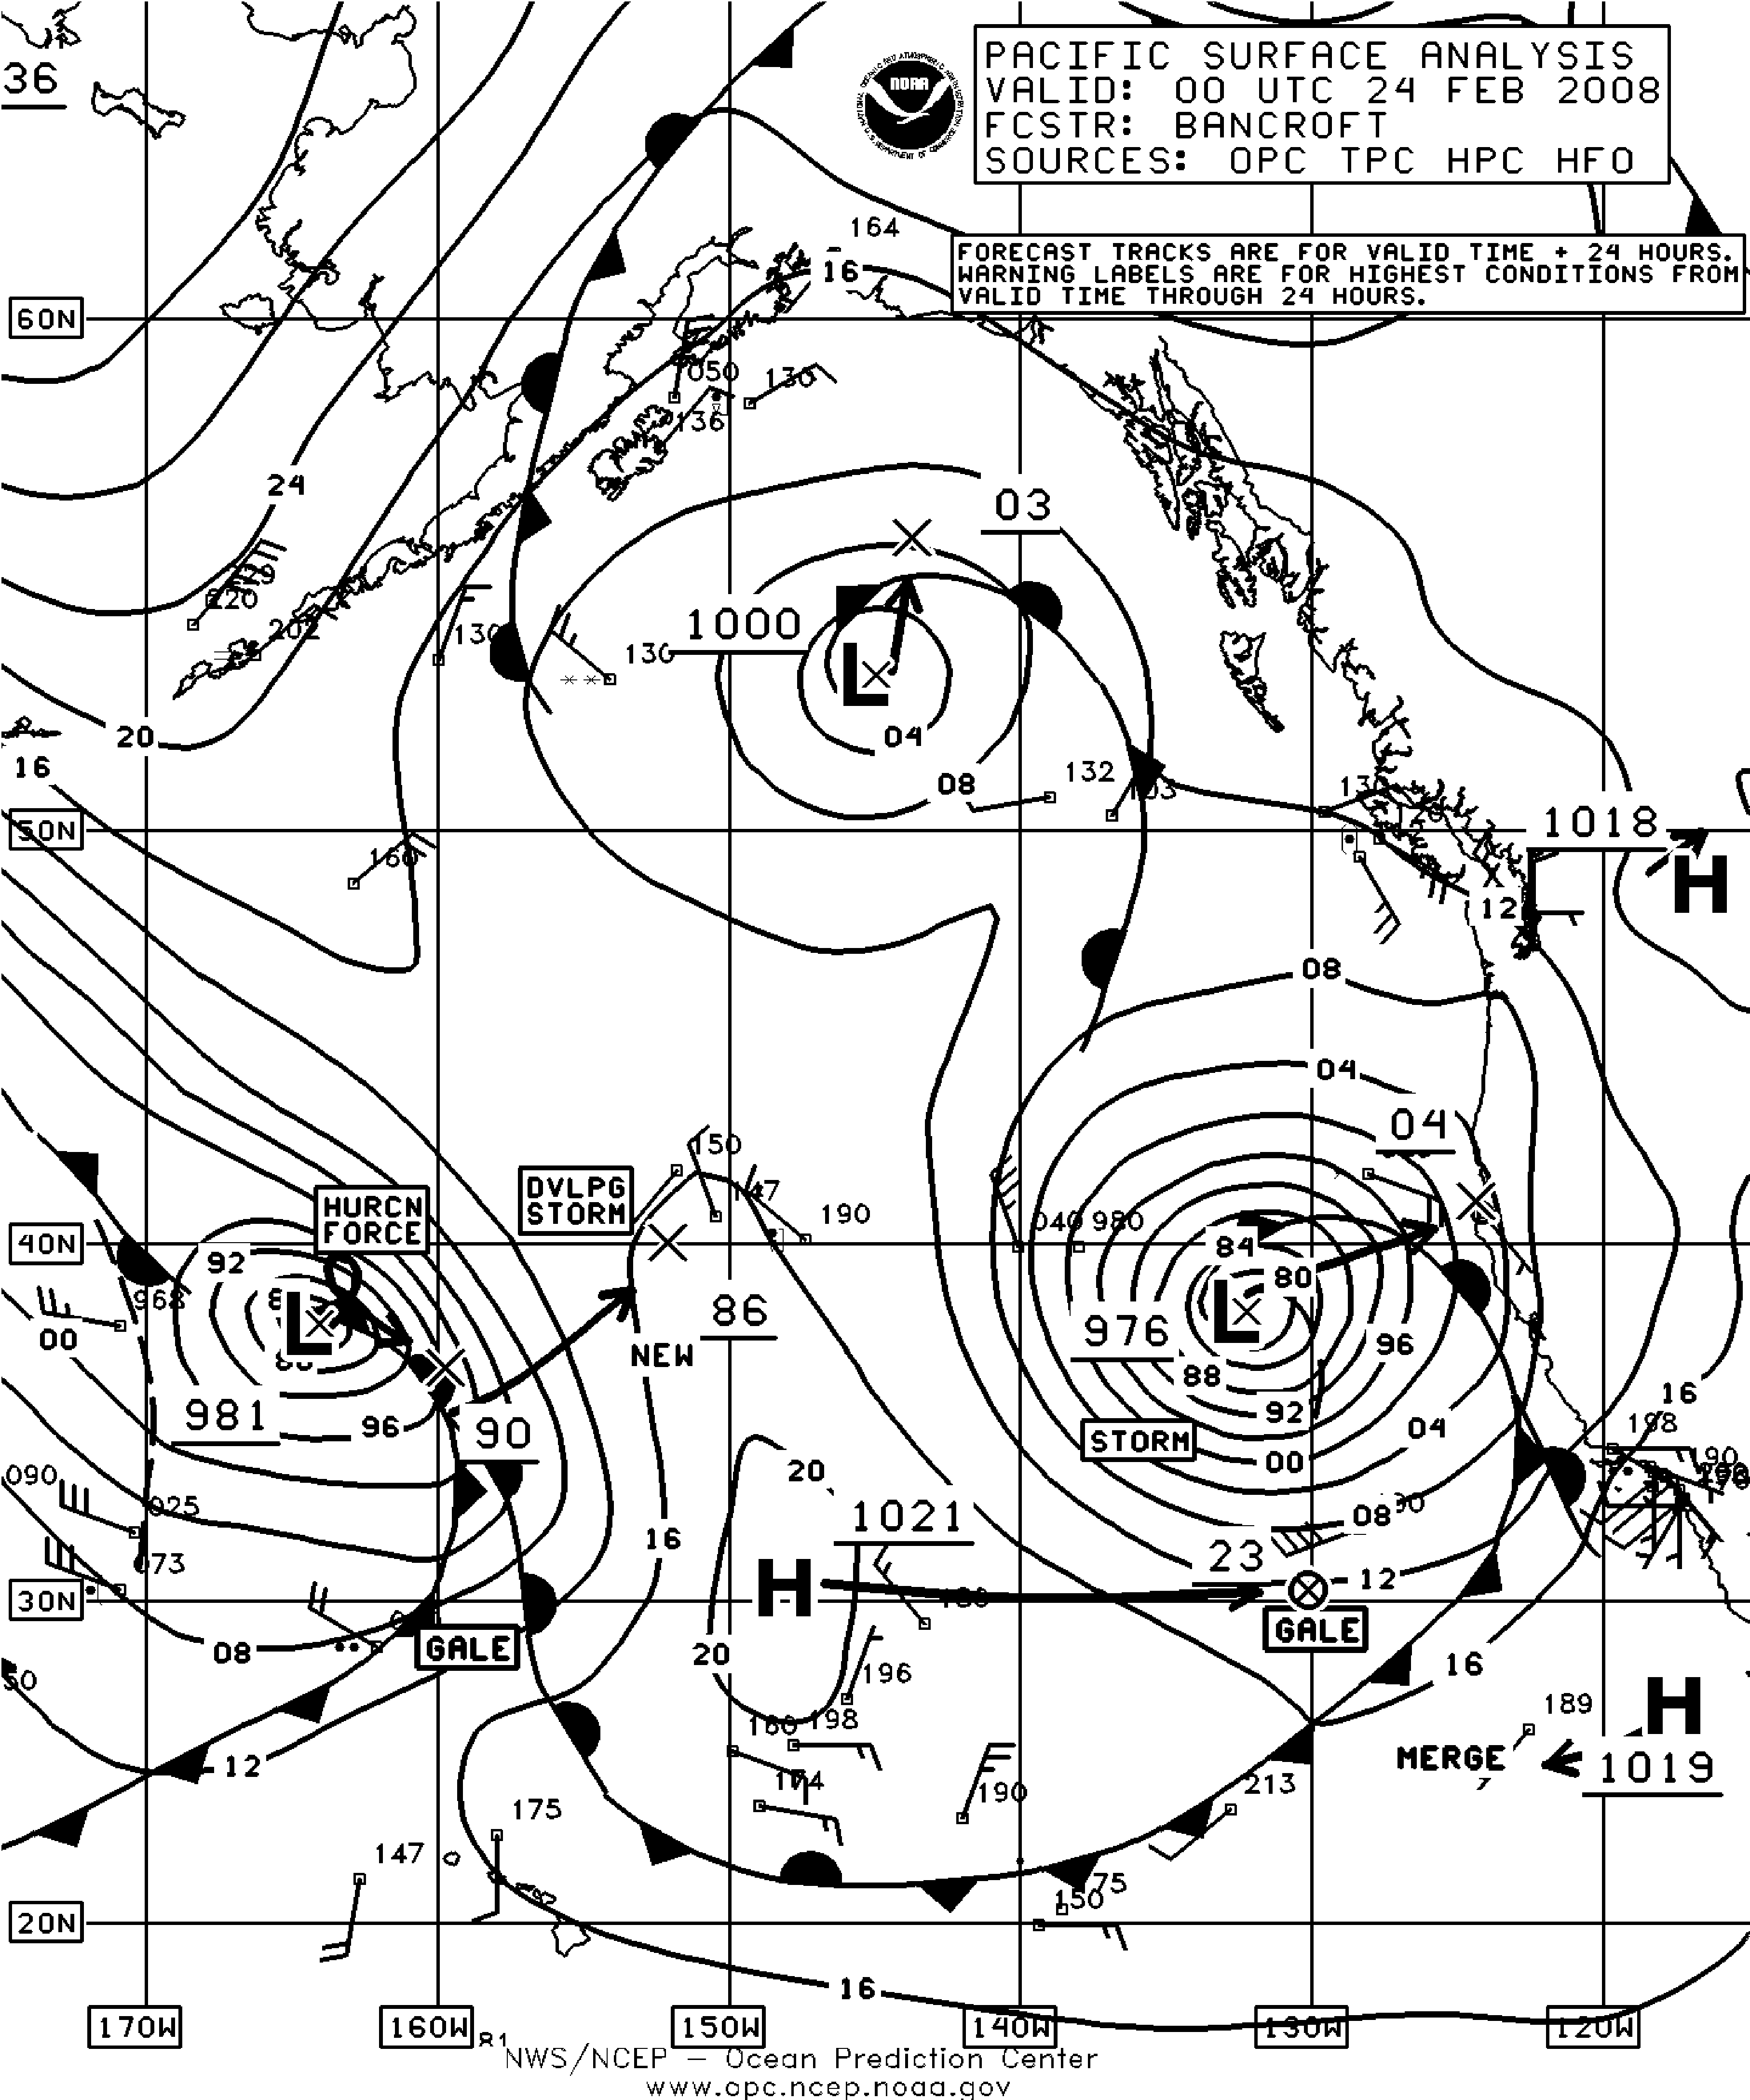
Figure 13. OPC North Pacific Surface Analysis charts (Parts 1 and 2) valid 0000 UTC February 24, 2008. (Click to enlarge)
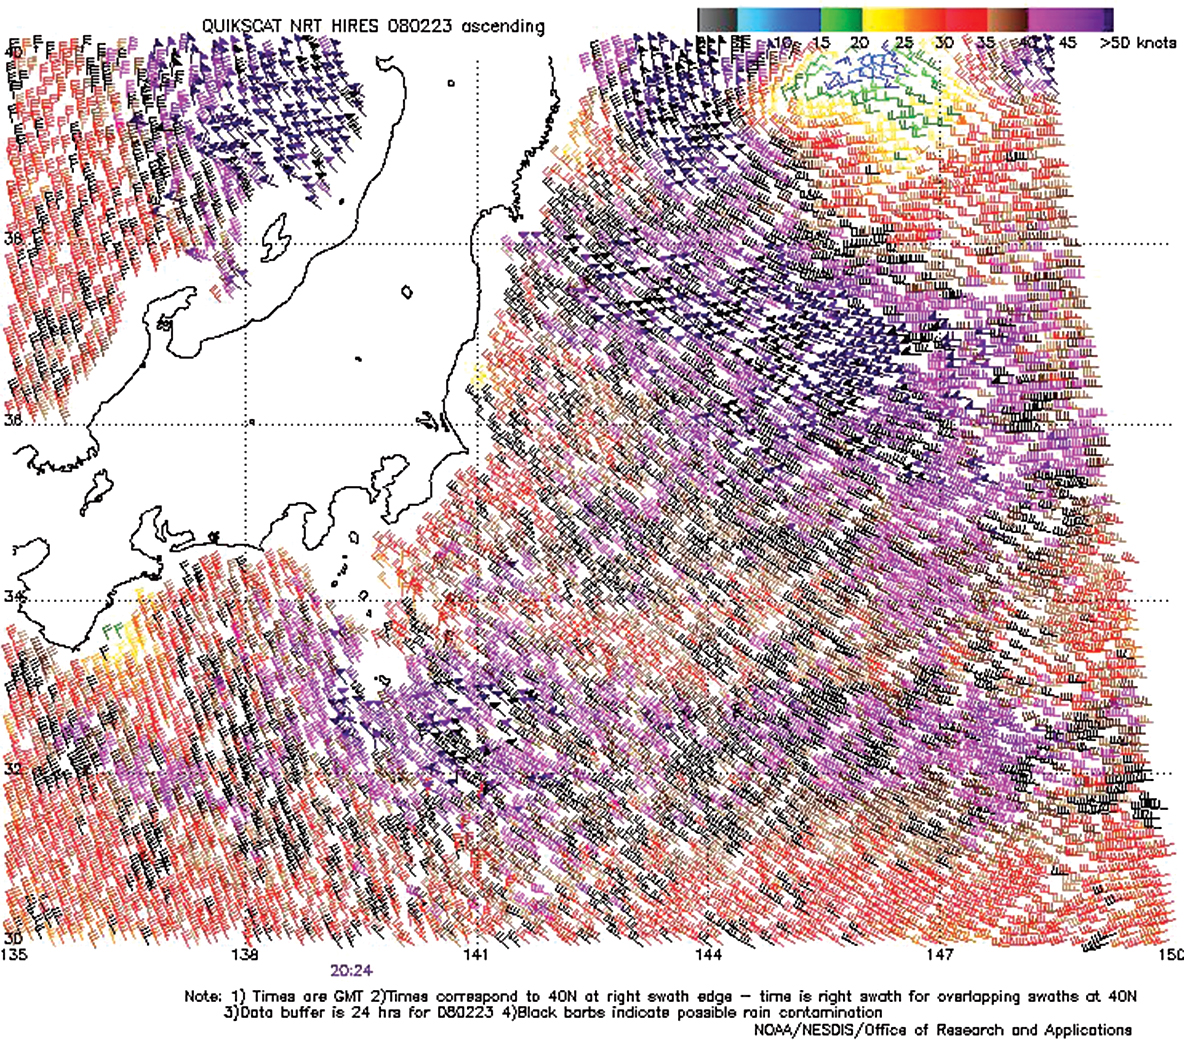
Figure 14. High resolution QuikScat scatterometer image of satellite-sensed winds
around the storm in the western North Pacific shown in Figure 13. The valid time of
the pass is 2024 UTC February 23, 2008, or about three and one-half hours prior
to the valid time of Figure 13. The center of the storm is just off the upper right side
of the portion of the image covered by data. Image is courtesy of NOAA/NESDIS/
Office of Research and Applications.(Click to enlarge)
Eastern North Pacific Storm, February 22-24:This cyclone originated northwest of Hawaii on February 20 and tracked northeast, developing hurricane force winds by 0600 UTC on the 23rd as the center passed near 37N 139W with a 972 hPa central pressure (a drop of 31 hPa in twenty four hours). The cyclone was near the maximum intensity of 970 hPa which occurred six hours later. Hurricane force winds lasted 12 to 18 hours, with a high resolution scatterometer pass from 1500 UTC on the 23rd showing winds 50 to 65 kts on the south and west sides of the center. Figure 13 shows the weakening eastern storm off the California coast. The ship Maersk Dhaka (A8HN5) (34N 133W) reported west winds of 45 kts and 10.5 meter seas (35 feet) at 1200 UTC on the 23rd. The buoy 46059 (38N 130W) reported west winds of 35 kts and 10.5 meter seas (34 feet) at 0500 UTC on the 24th. The cyclone then weakened to a gale near northern California on the 24th.
North Pacific Storm, February 23- 26:This development originated as a secondary low pressure area near 31N 175W on the 22nd, on a front extending from a northwestern Pacific system Figure 13. The center moved northeast and developed hurricane force winds by 0000 UTC on the 24th Figure 13. Scatterometer data from near that time revealed a small area of 50 to 65 kts winds on the north and northwest sides of the center. The cyclone developed a lowest central pressure of 976 hPa six hours later. The system then moved into the southern Gulf of Alaska as a storm force low on the 26th, before dissipating near Southeast Alaska on the 27th.
Western North Pacific Storm, February 26-29:The development of the second most intense North Pacific low is depicted in Figure 15, with the central pressure dropping 48 hPa in twenty four hours. The 500 hPa analysis Figure 16 valid in the middle of the period of rapid intensification reveals upper support for the development in the form of a strong short-wave trough near the coast of Japan and a 100 kts jet at 500 hPa to the south. More details on the use of the 500 hPa charts and relation to surface features can be found in Reference 2. The lowest central pressure was 946 hPa at 0000 UTC on the 28th as the center passed near 49N 154E. The ship Lily Oldendorff (A8AY3)(48N 153E) reported southeast winds of 60 kts at 1200 UTC on the 27th, followed twelve hours later by a report near 46N 153E of west winds of 95 kts and 7.5 meter seas (24 feet). QuikScat winds available early on the 27th revealed winds not as high, up to 70 kts around the Kurile Islands. The ship APL Scotland (9VDD3)(43N 152E) reported northwest winds of 45 kts and 10.0 meter seas (32 feet). The cyclone then moved into the Sea of Okhotsk early on the 28th with its winds weakening to storm force, and then dissipated there by the 29th.
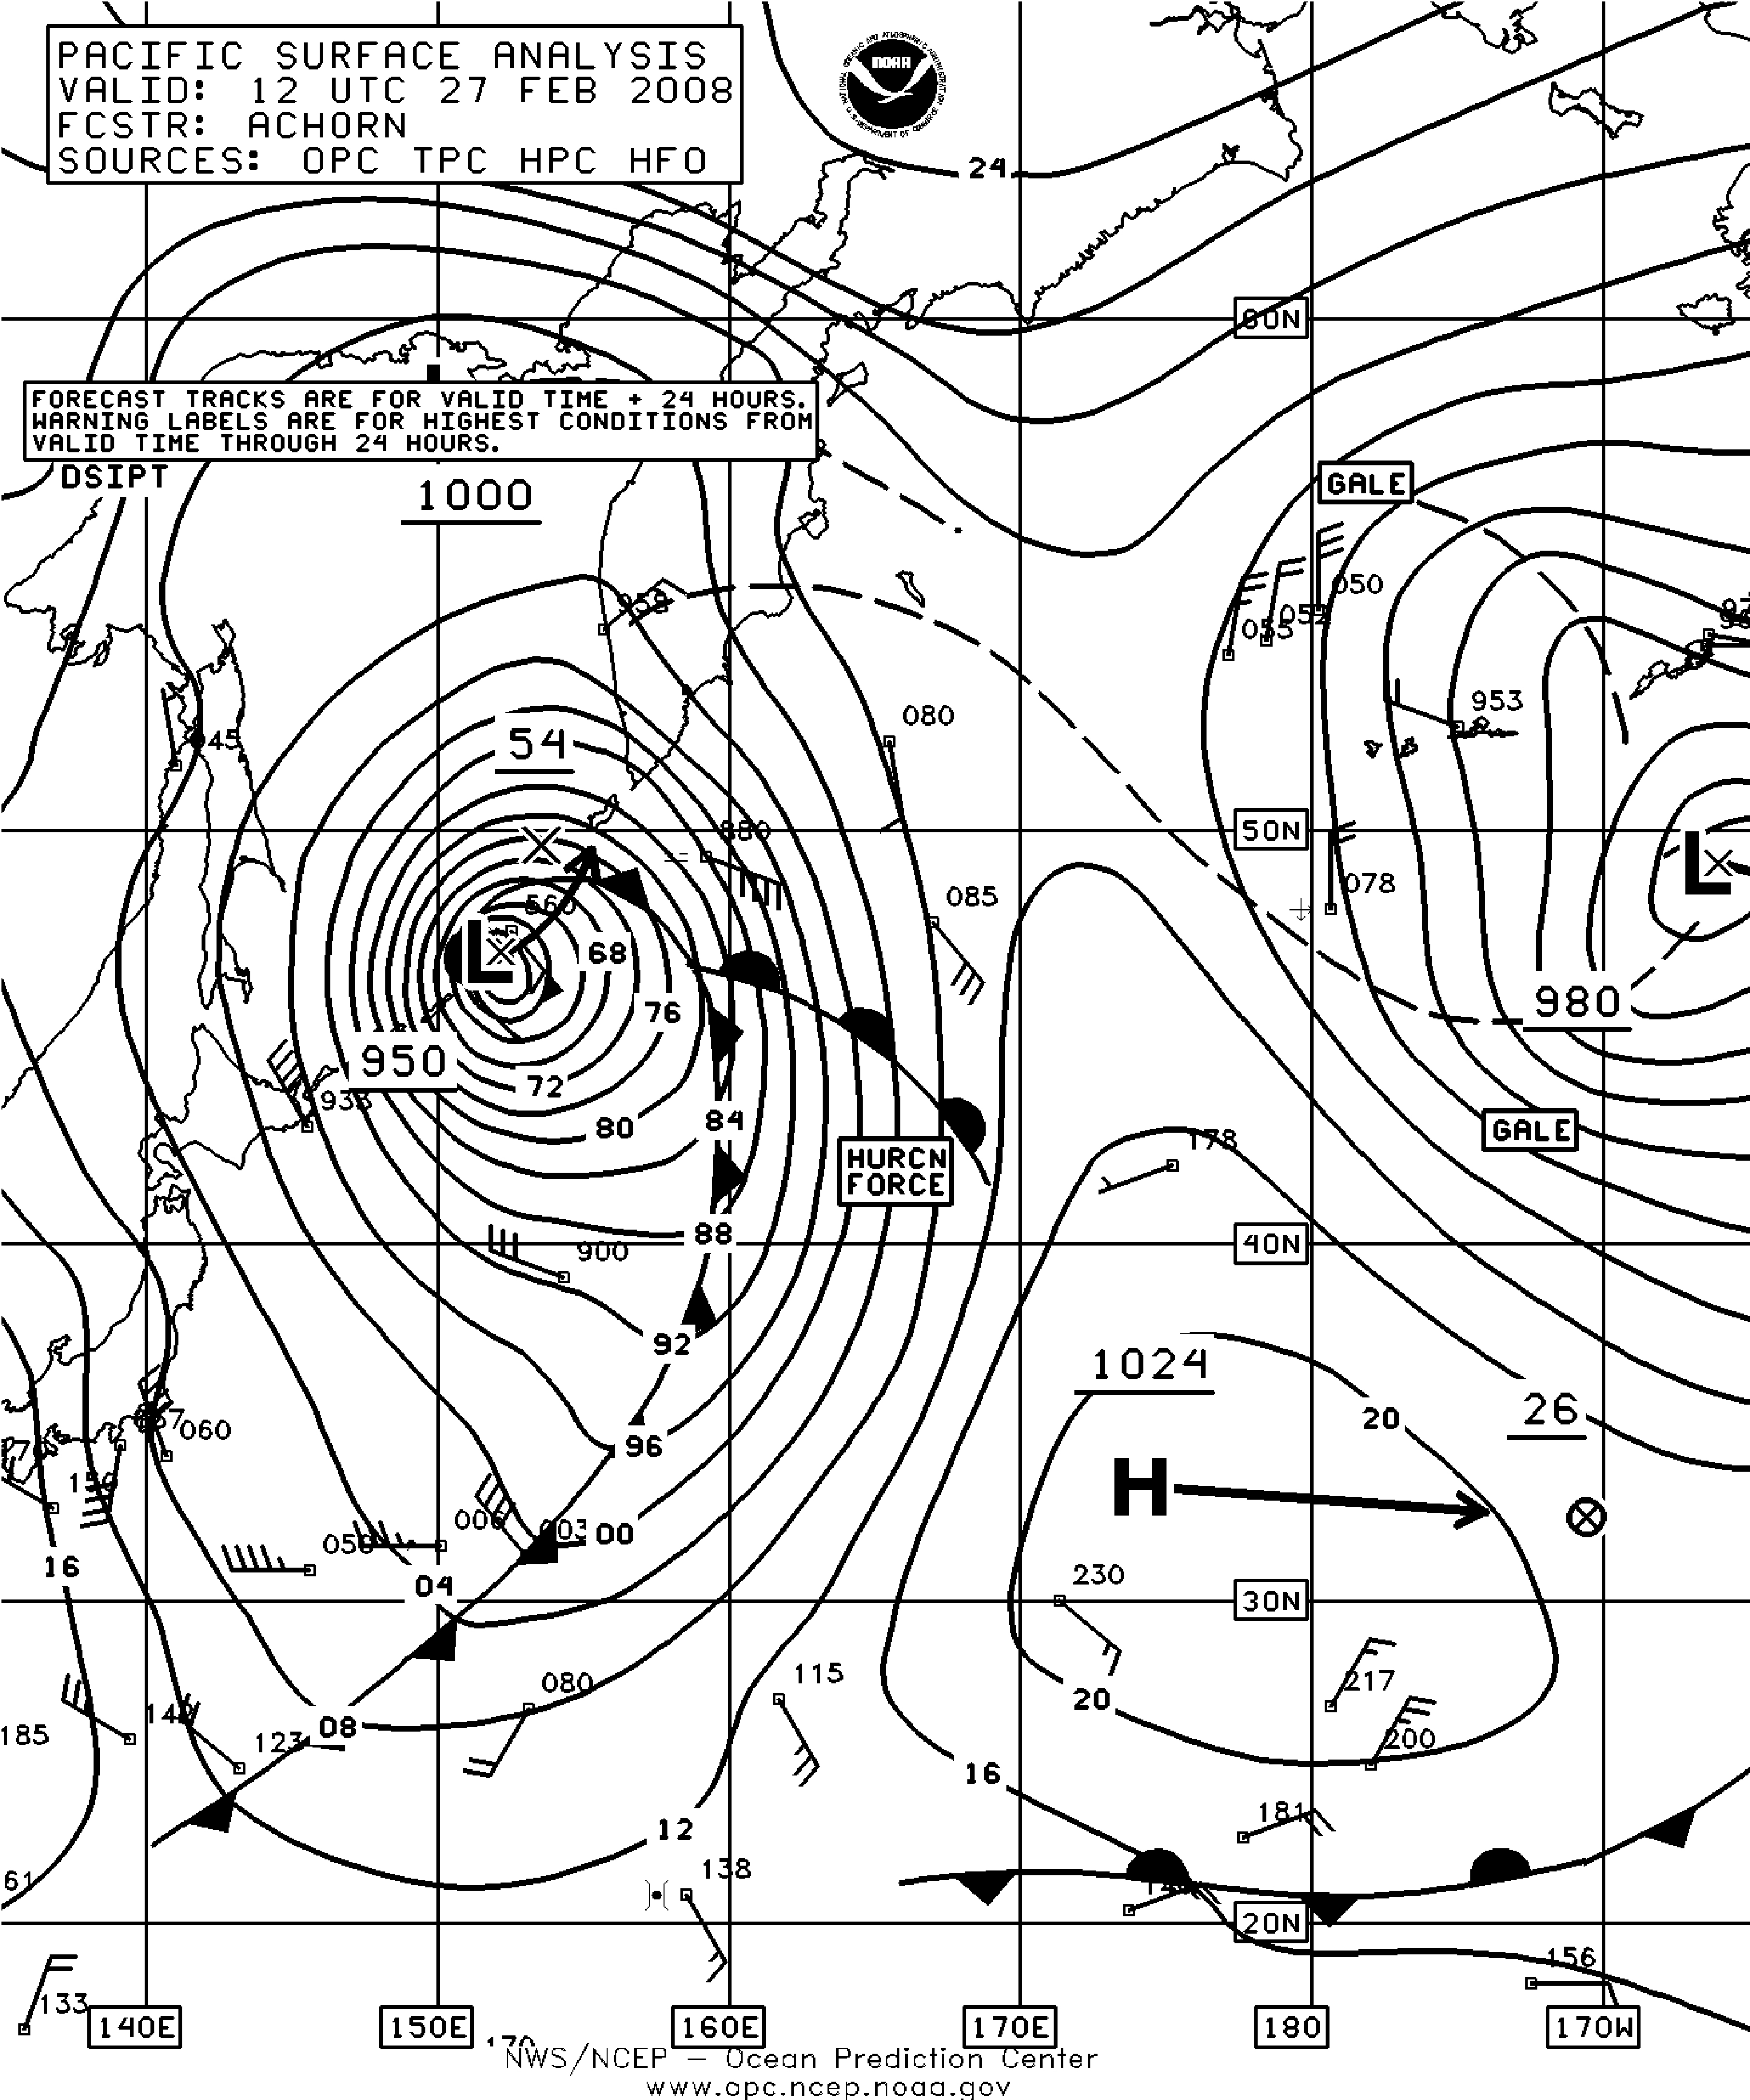
Figure 15. OPC North Pacific Surface Analysis charts (Part 2) valid 1200 UTC February 26 and 27, 2008. (Click to enlarge)
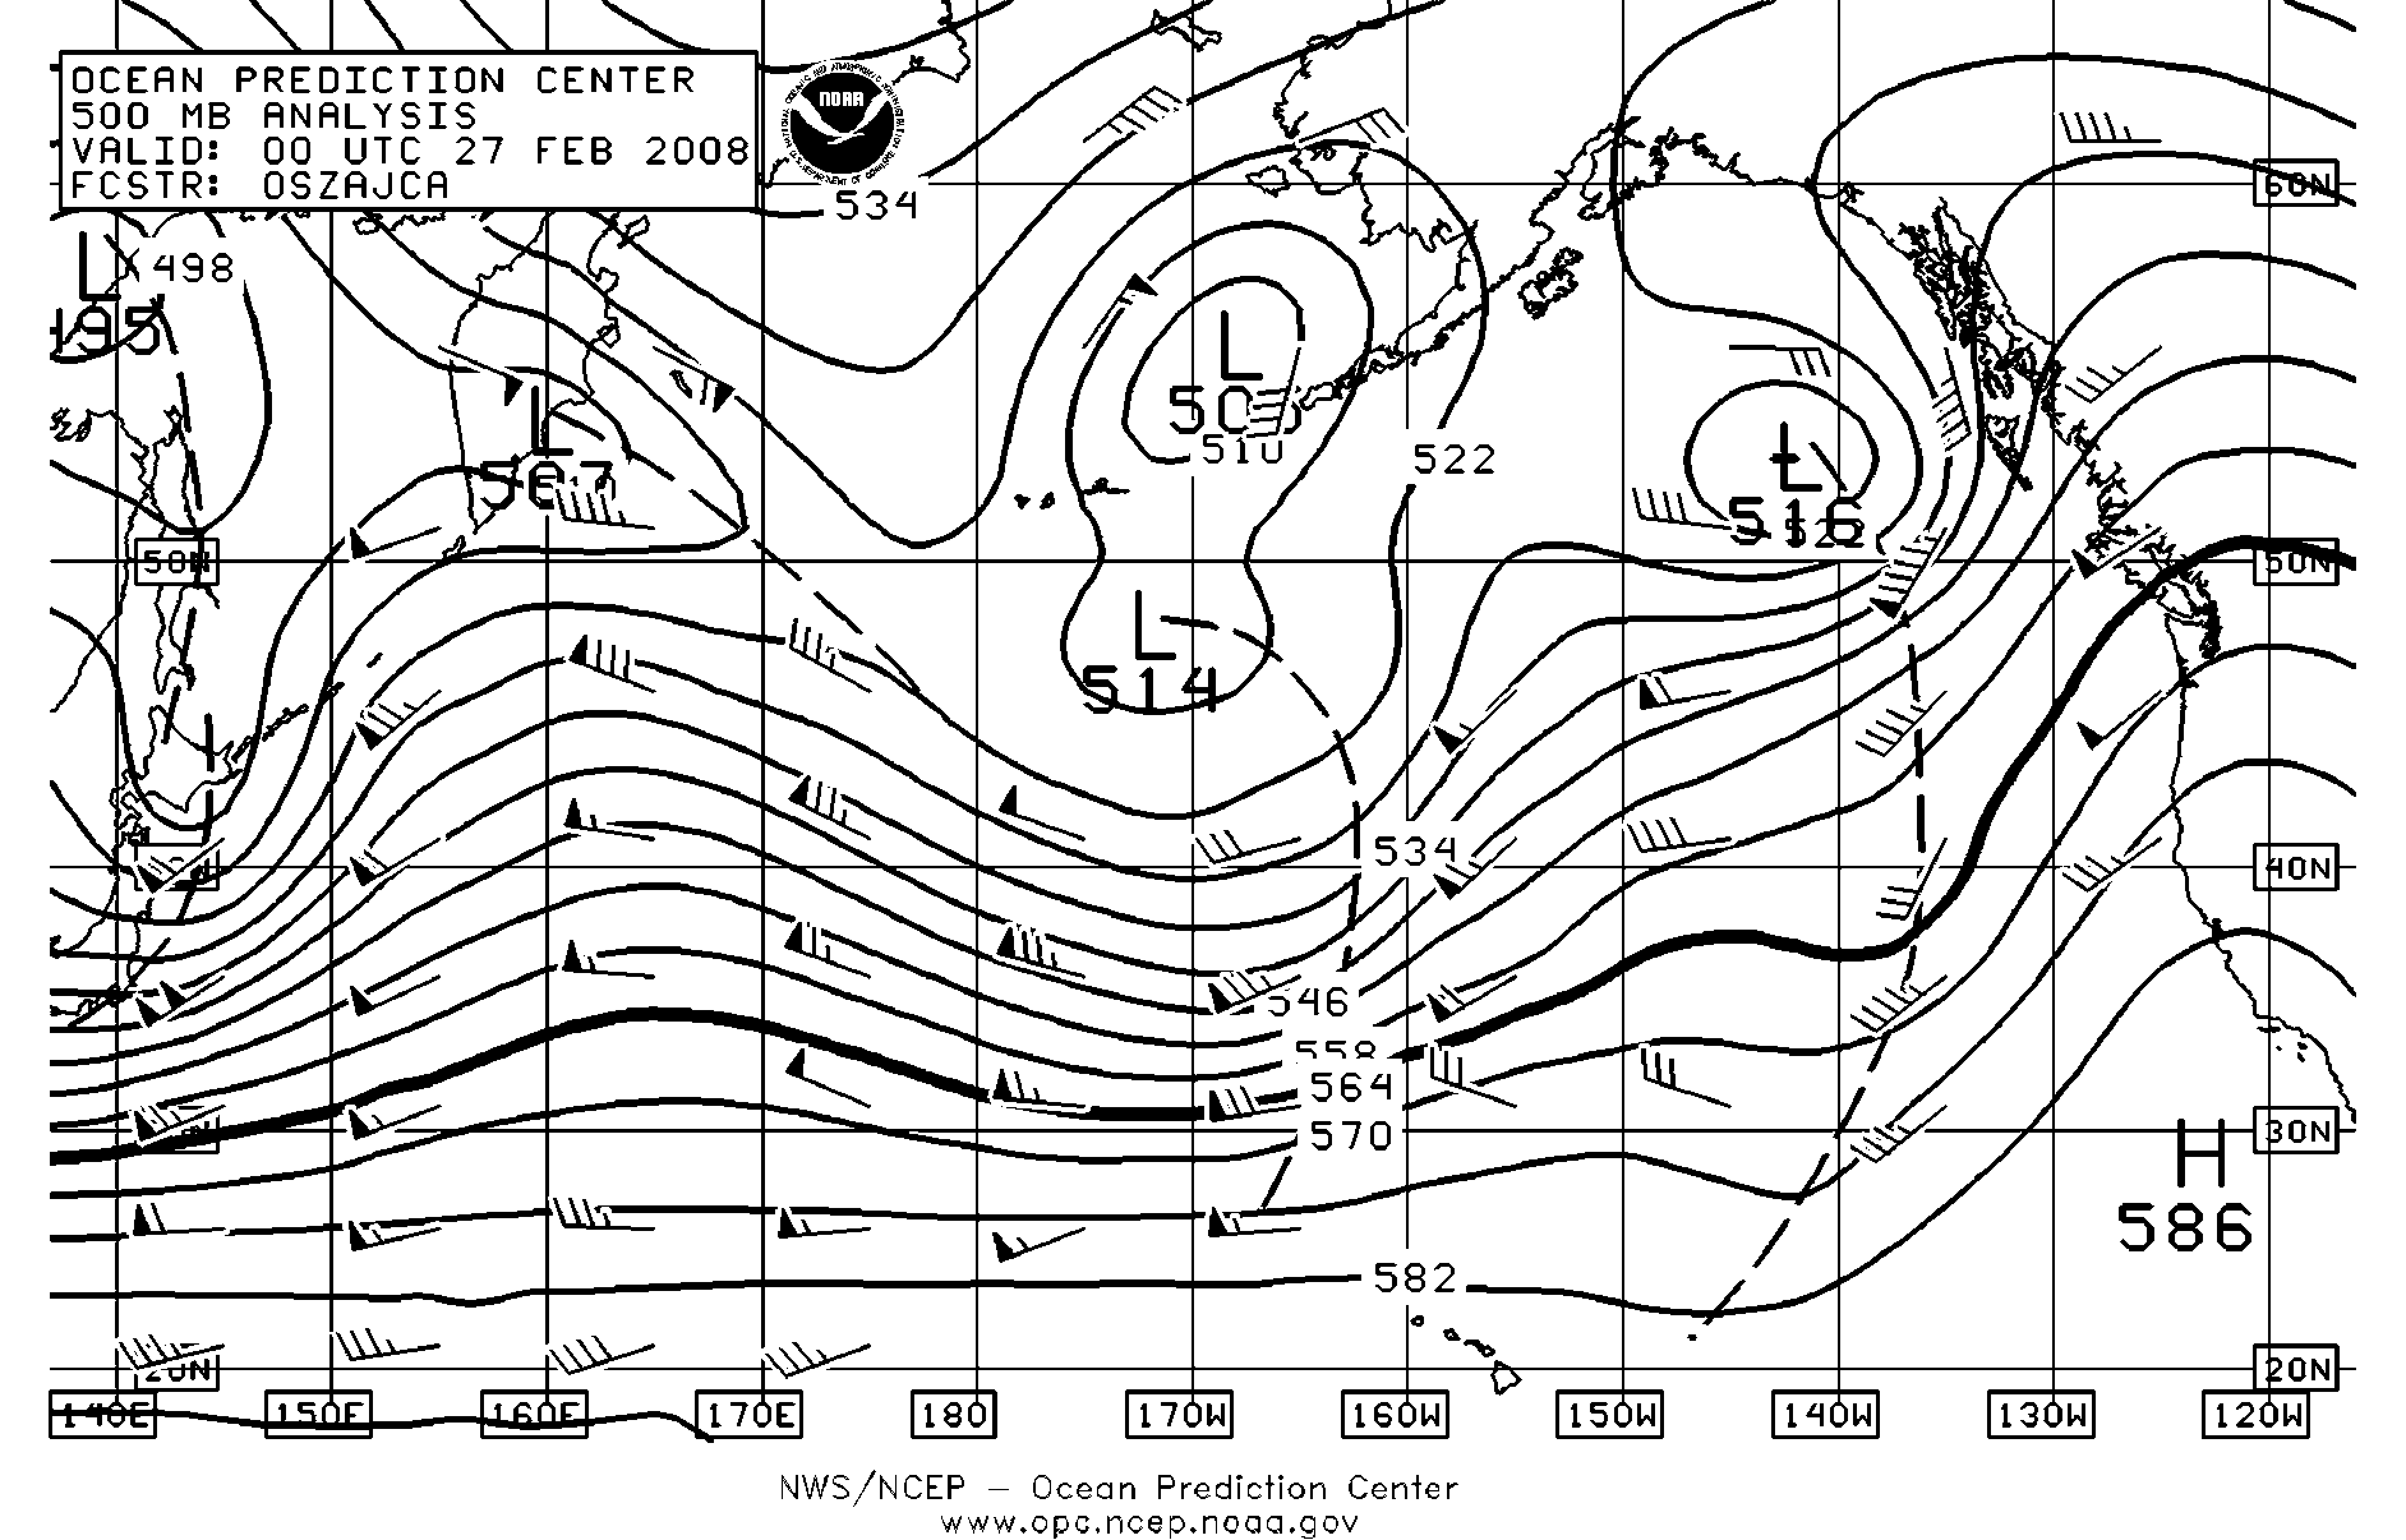
Figure 16. OPC North Pacific 500 hPa Analysis chart valid 0000 UTC February 27, 2008. The valid time is twelve hours prior to the valid time of the second part of Figure 15. The chart is computer-generated with short-wave troughs (dashed lines) manually added. (Click to enlarge)
North Pacific Storm, March 1-3: This cyclone originated east of Japan near 150E early on March 1 and moved northeast, briefly becoming a hurricane force low by 0000 UTC on the 3rd as it passed near 46N 172W with a 960 hPa central pressure. The system then turned north as a storm force low on the 3rd, before weakening to a gale near the eastern Aleutians late on the 3rd.
North Pacific Storm, March 8-12:This cyclone originated near Japan early on the 7th and moved east-northeast, developing hurricane force winds by 0000 UTC on the 9th as the center passed near 37N 170E as a compact 988 hPa low. A partial view of winds in the southwest side of the system late on the 8th using high resolution scatterometer data showed a small area of winds 50 to 70 kts. Figure 17 shows this cyclone over the central waters at 0000 UTC on the 10th. The Ever Deluxe (3FBE8)(38N 166E) reported north winds of 50 kts at 2100 UTC on the 8th. The system developed a lowest central pressure of 979 hPa at 0000 UTC on the 11th near 42N 167W with its winds below hurricane force. The cyclone then elongated eastward and reached the southeast Gulf of Alaska as a gale on the 13th before moving inland over British Columbia on the 14th.
Eastern North Pacific Storm, March 9-11:Figure 16 shows this cyclone in the eastern waters. It originated near 39N 163W twenty four hours prior to Figure 17s valid time. Winds to 65 kts appeared on scatterometer imagery south of the center on the evening of the 9th. Hurricane force winds lasted until early on the 10th, but the lowest central pressure of 981 hPa did not occur until the low passed near 48N 136W at 1800 UTC on the 10th. The ship Hanjin Yantian (DDYZ2)(43N 146W) reported northwest winds of 50 kts and 8.5 meter seas (28 feet) at 0300 UTC on the 10th. This cyclone subsequently moved inland over British Columbia on the 11th.
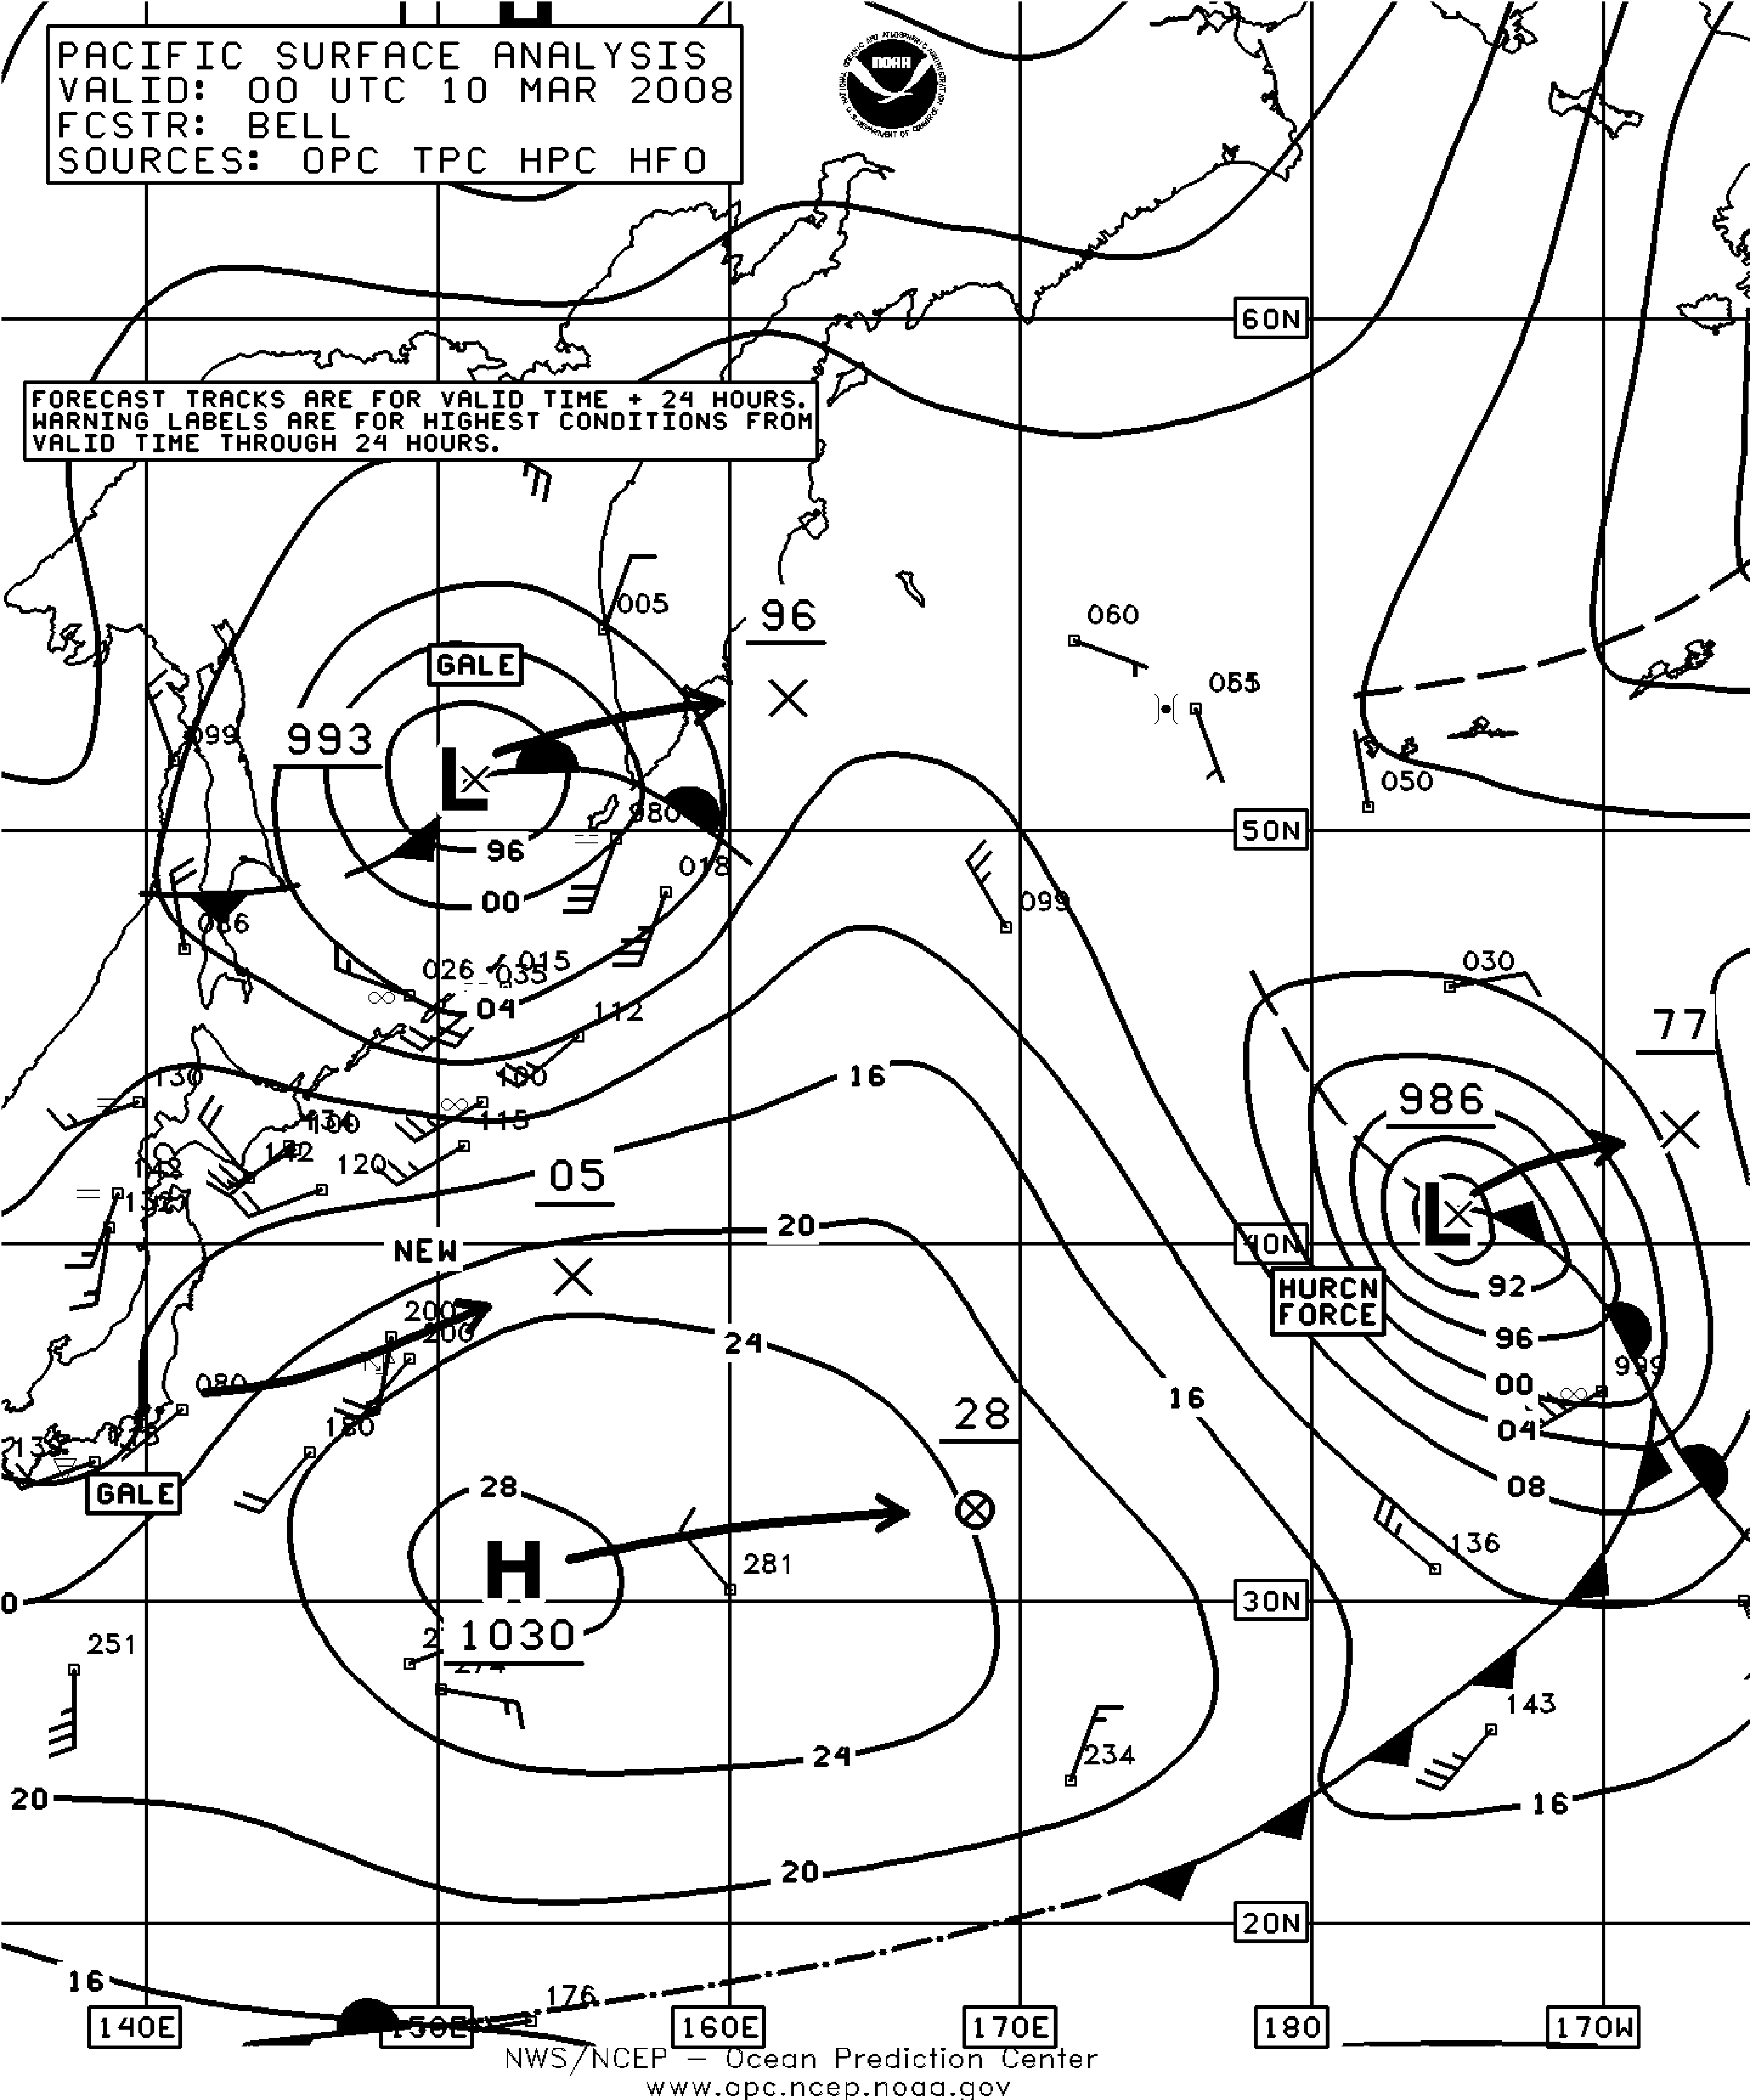
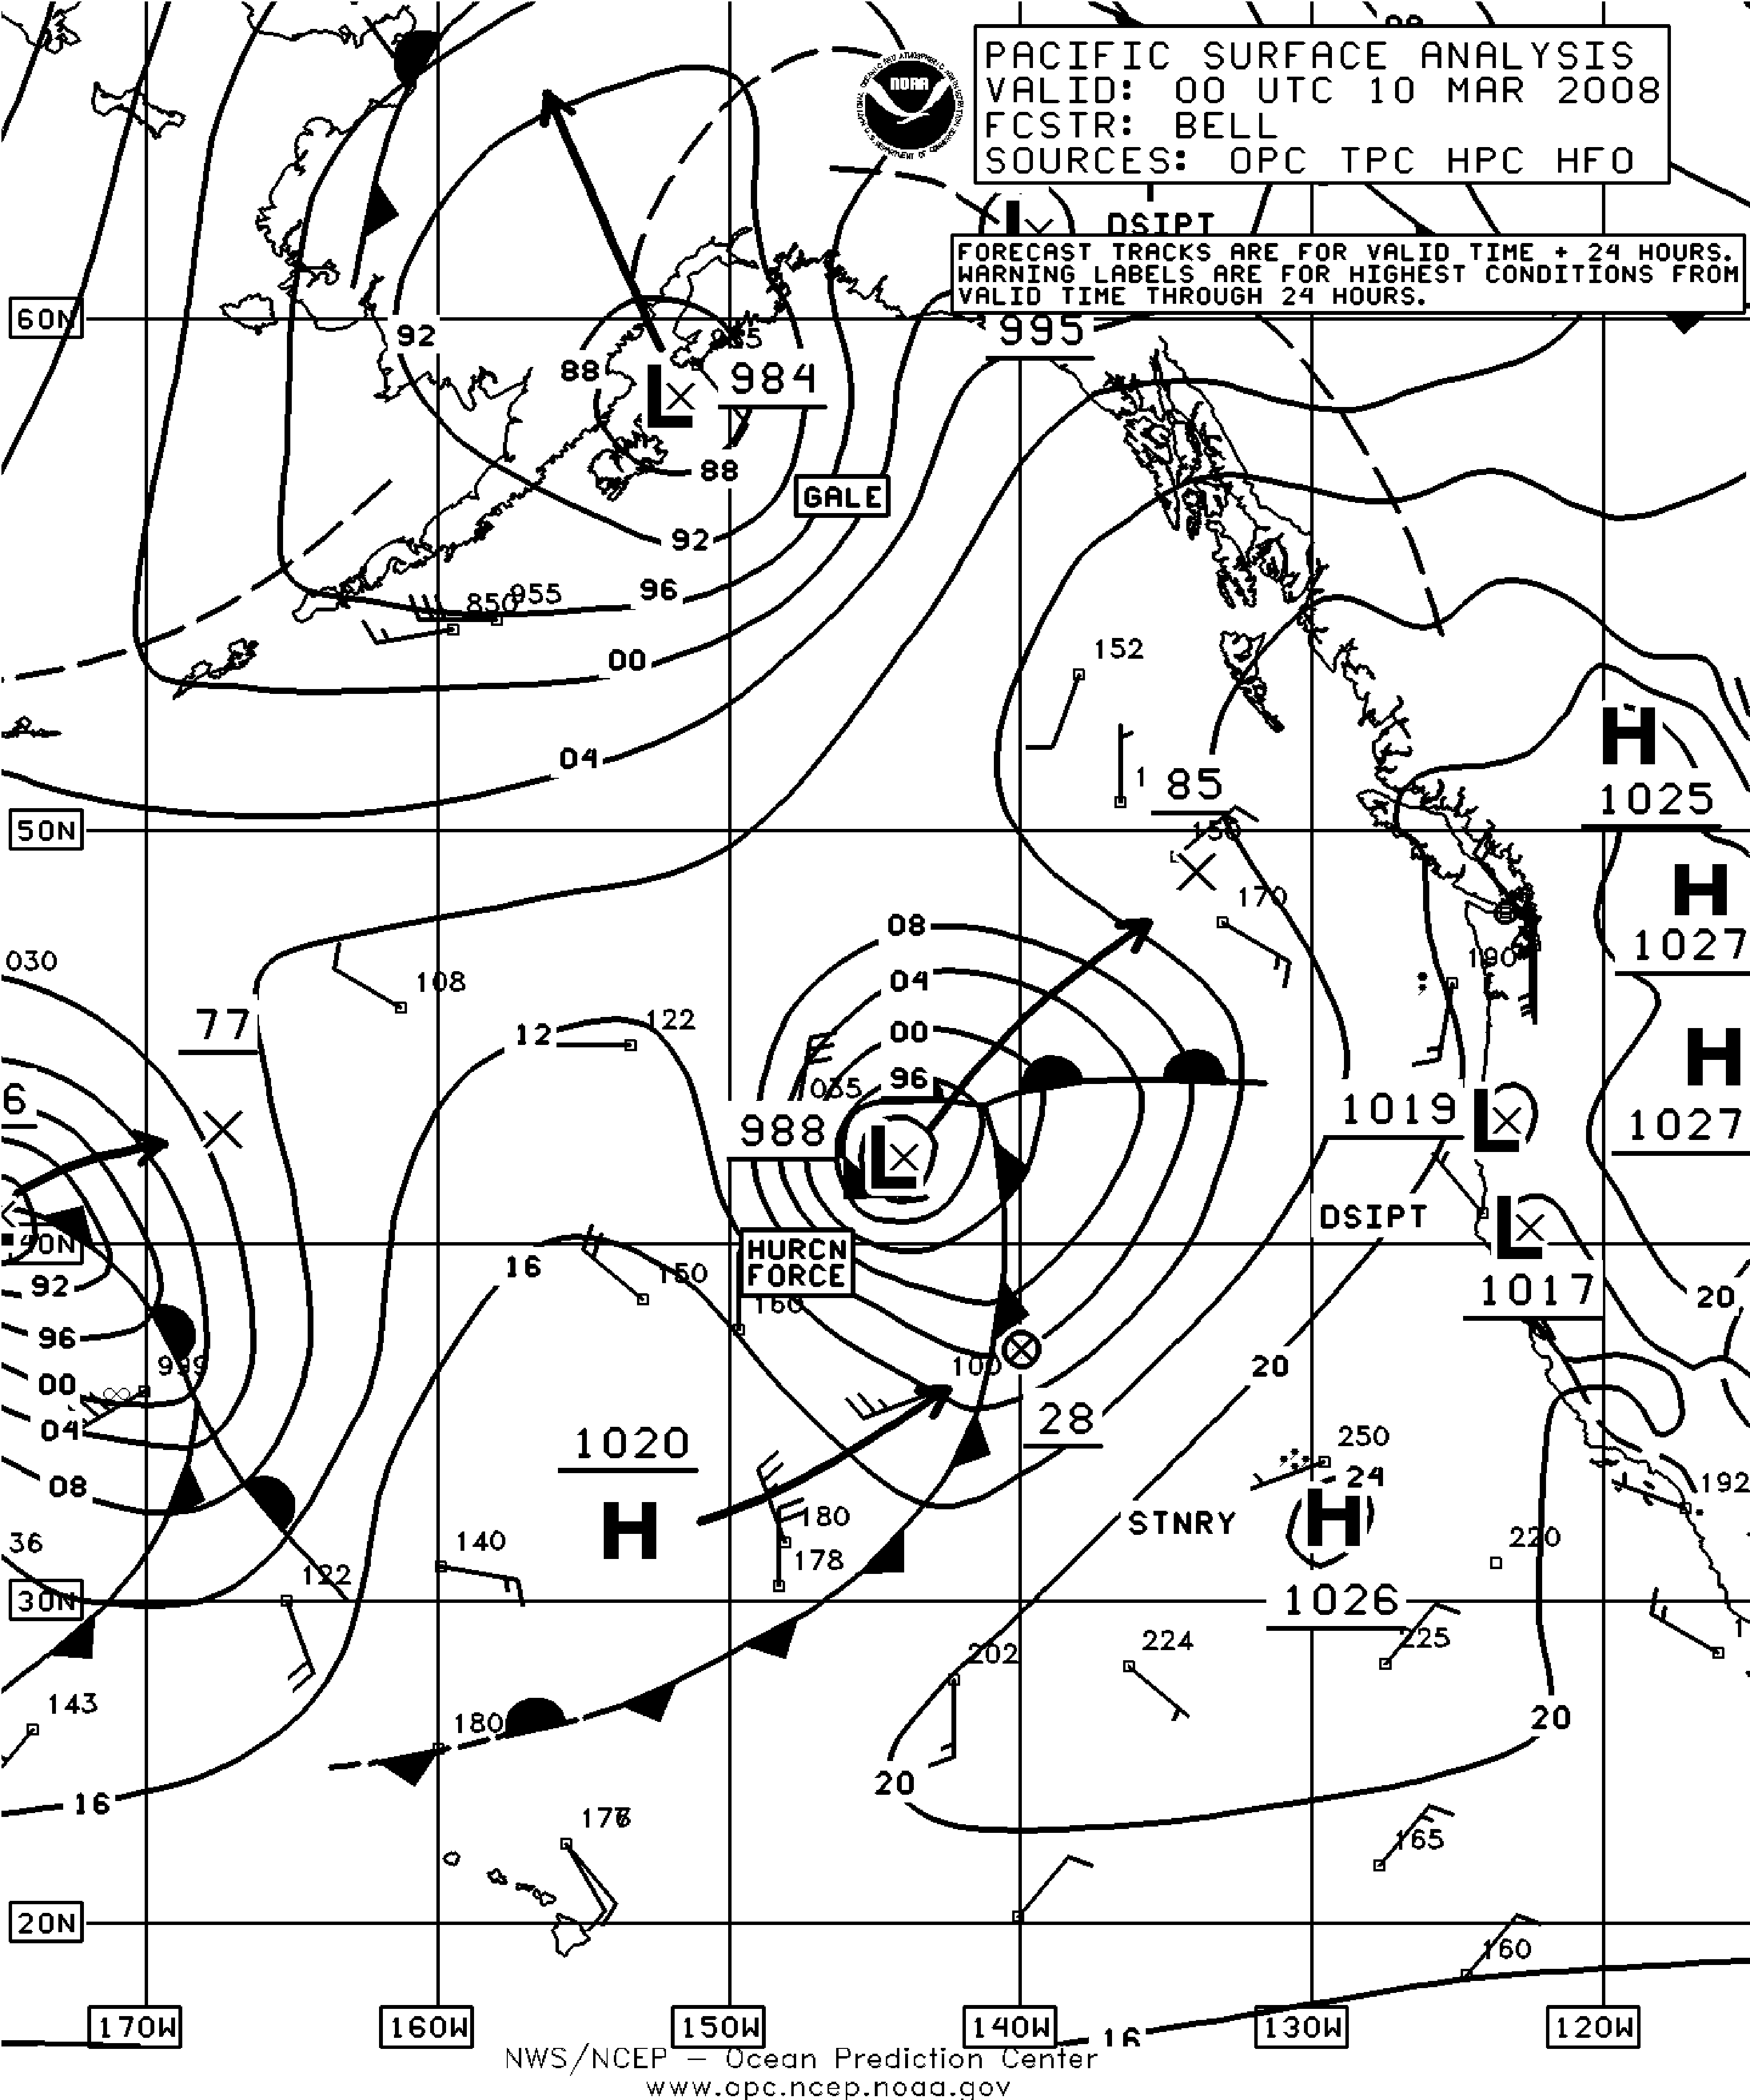
Figure 17. OPC North Pacific Surface Analysis charts (Parts 1 and 2) valid 0000 UTC March 10, 2008. (Click to enlarge)
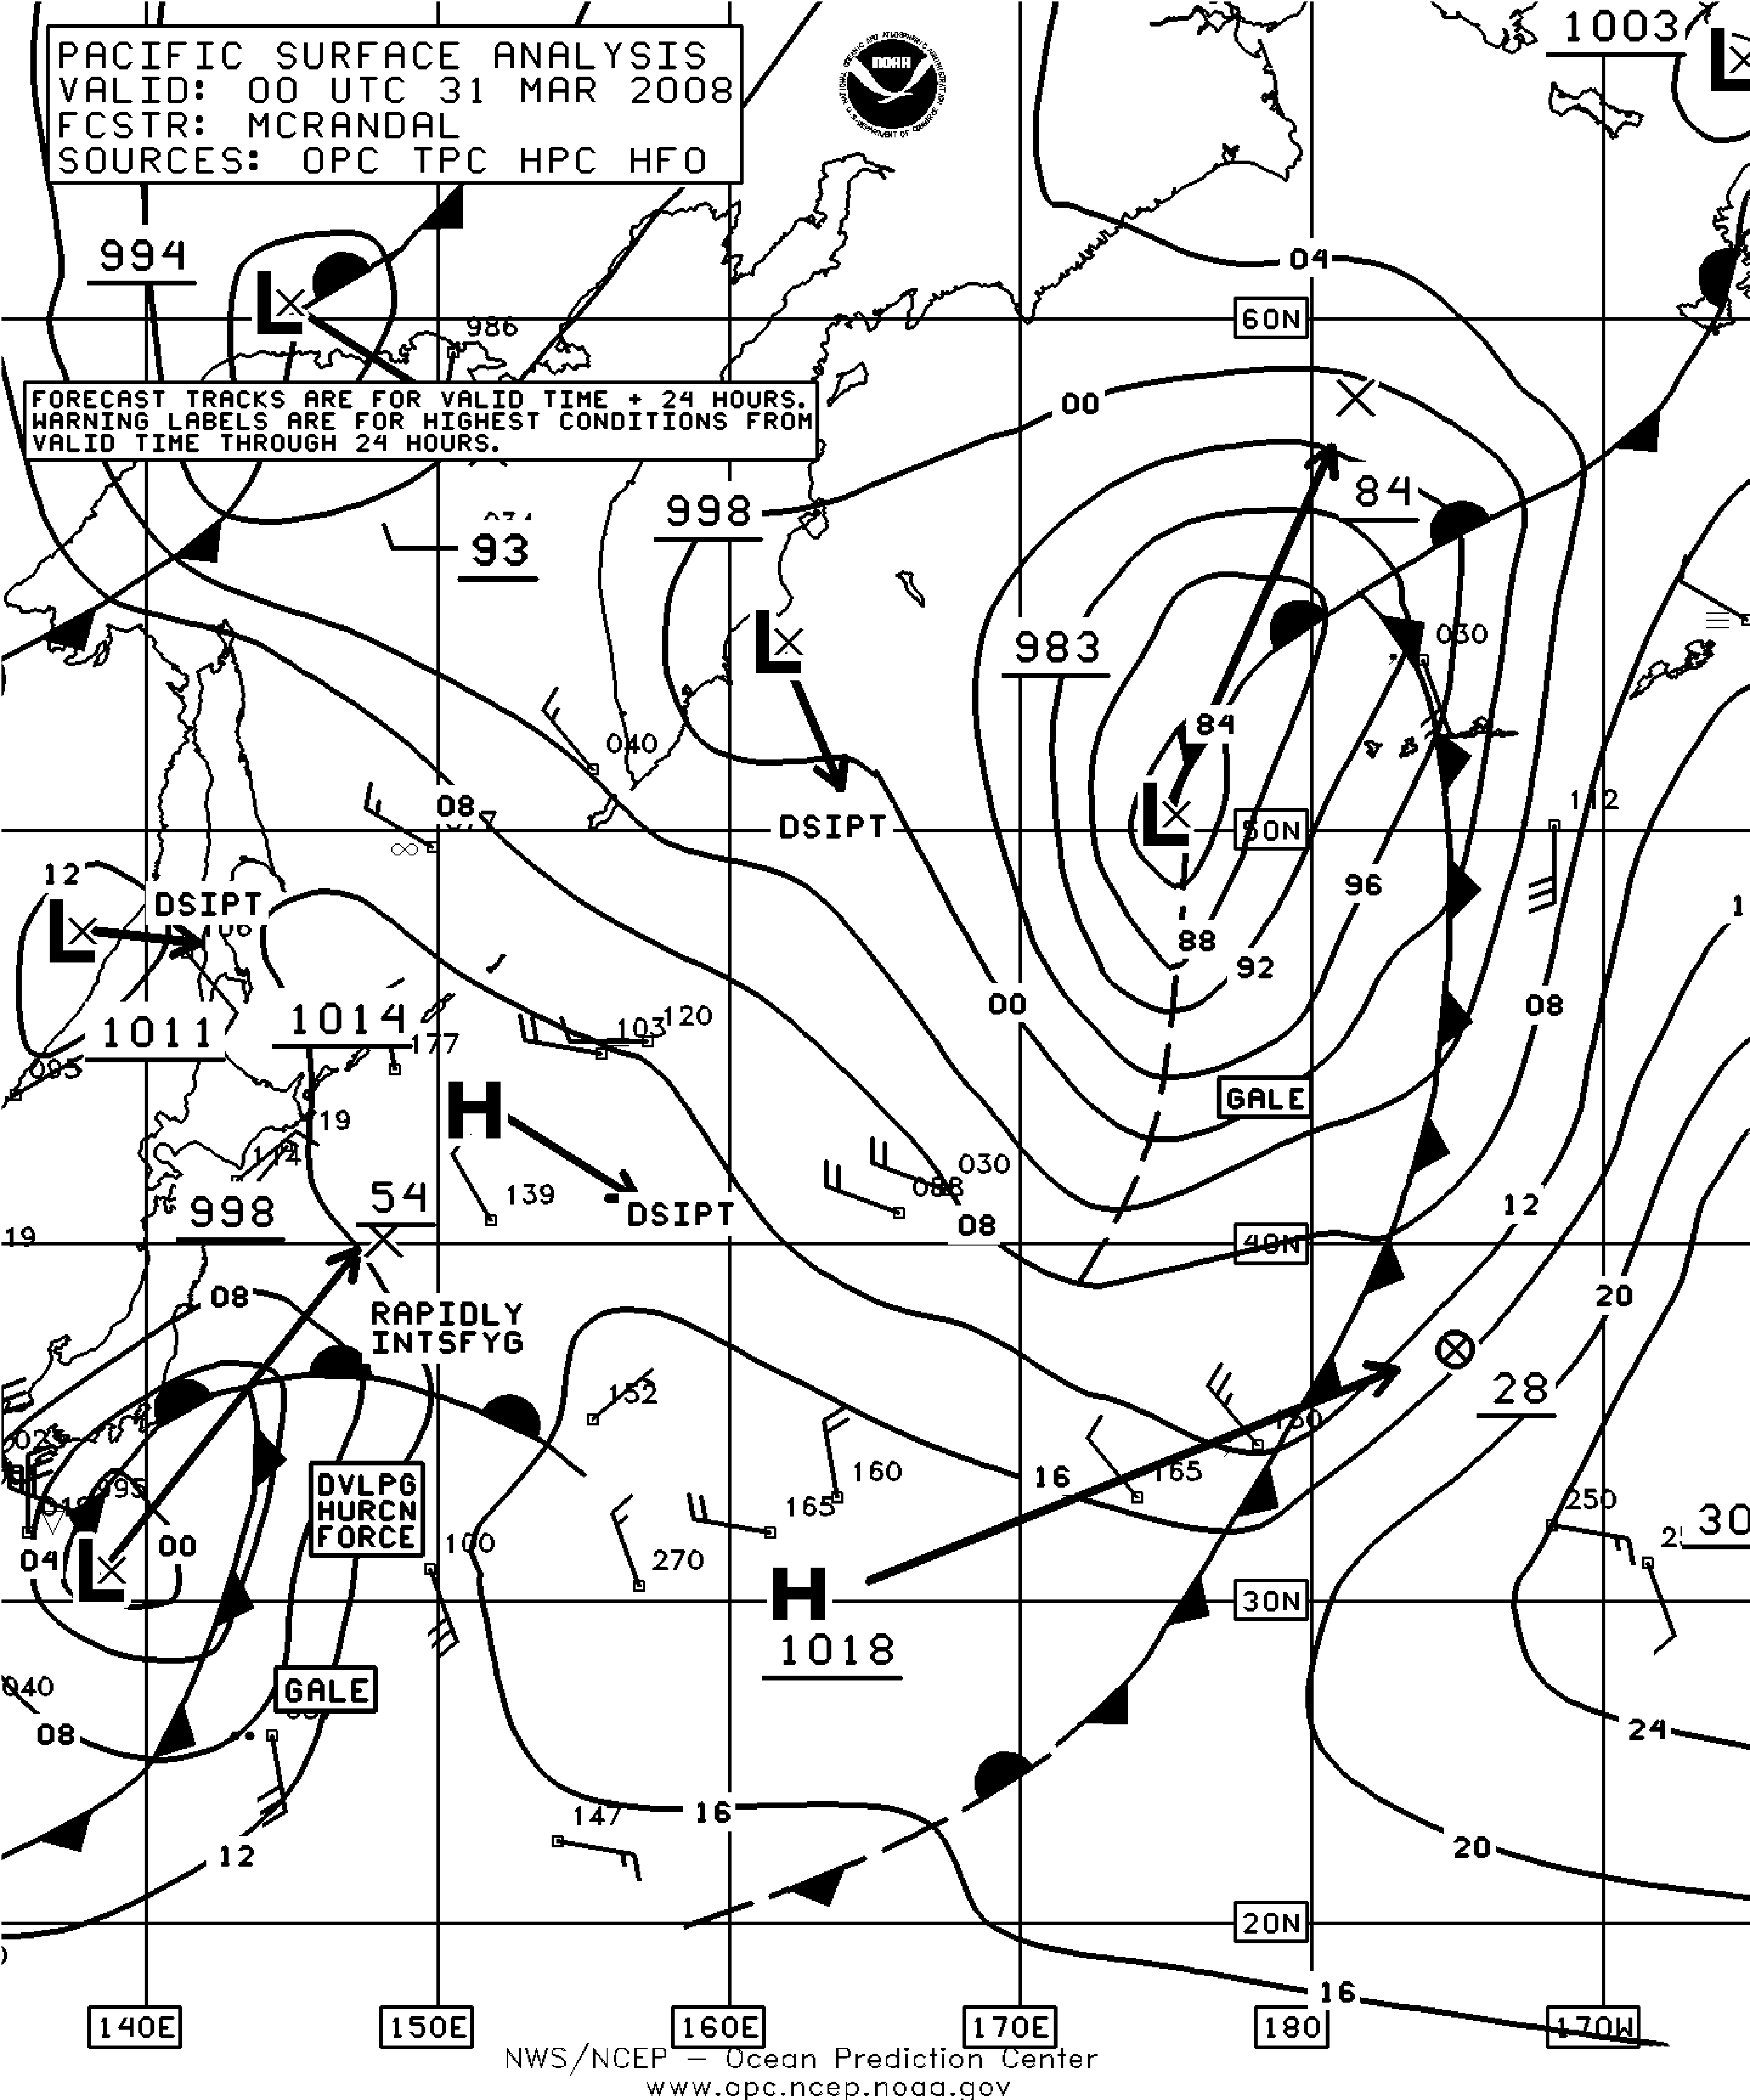
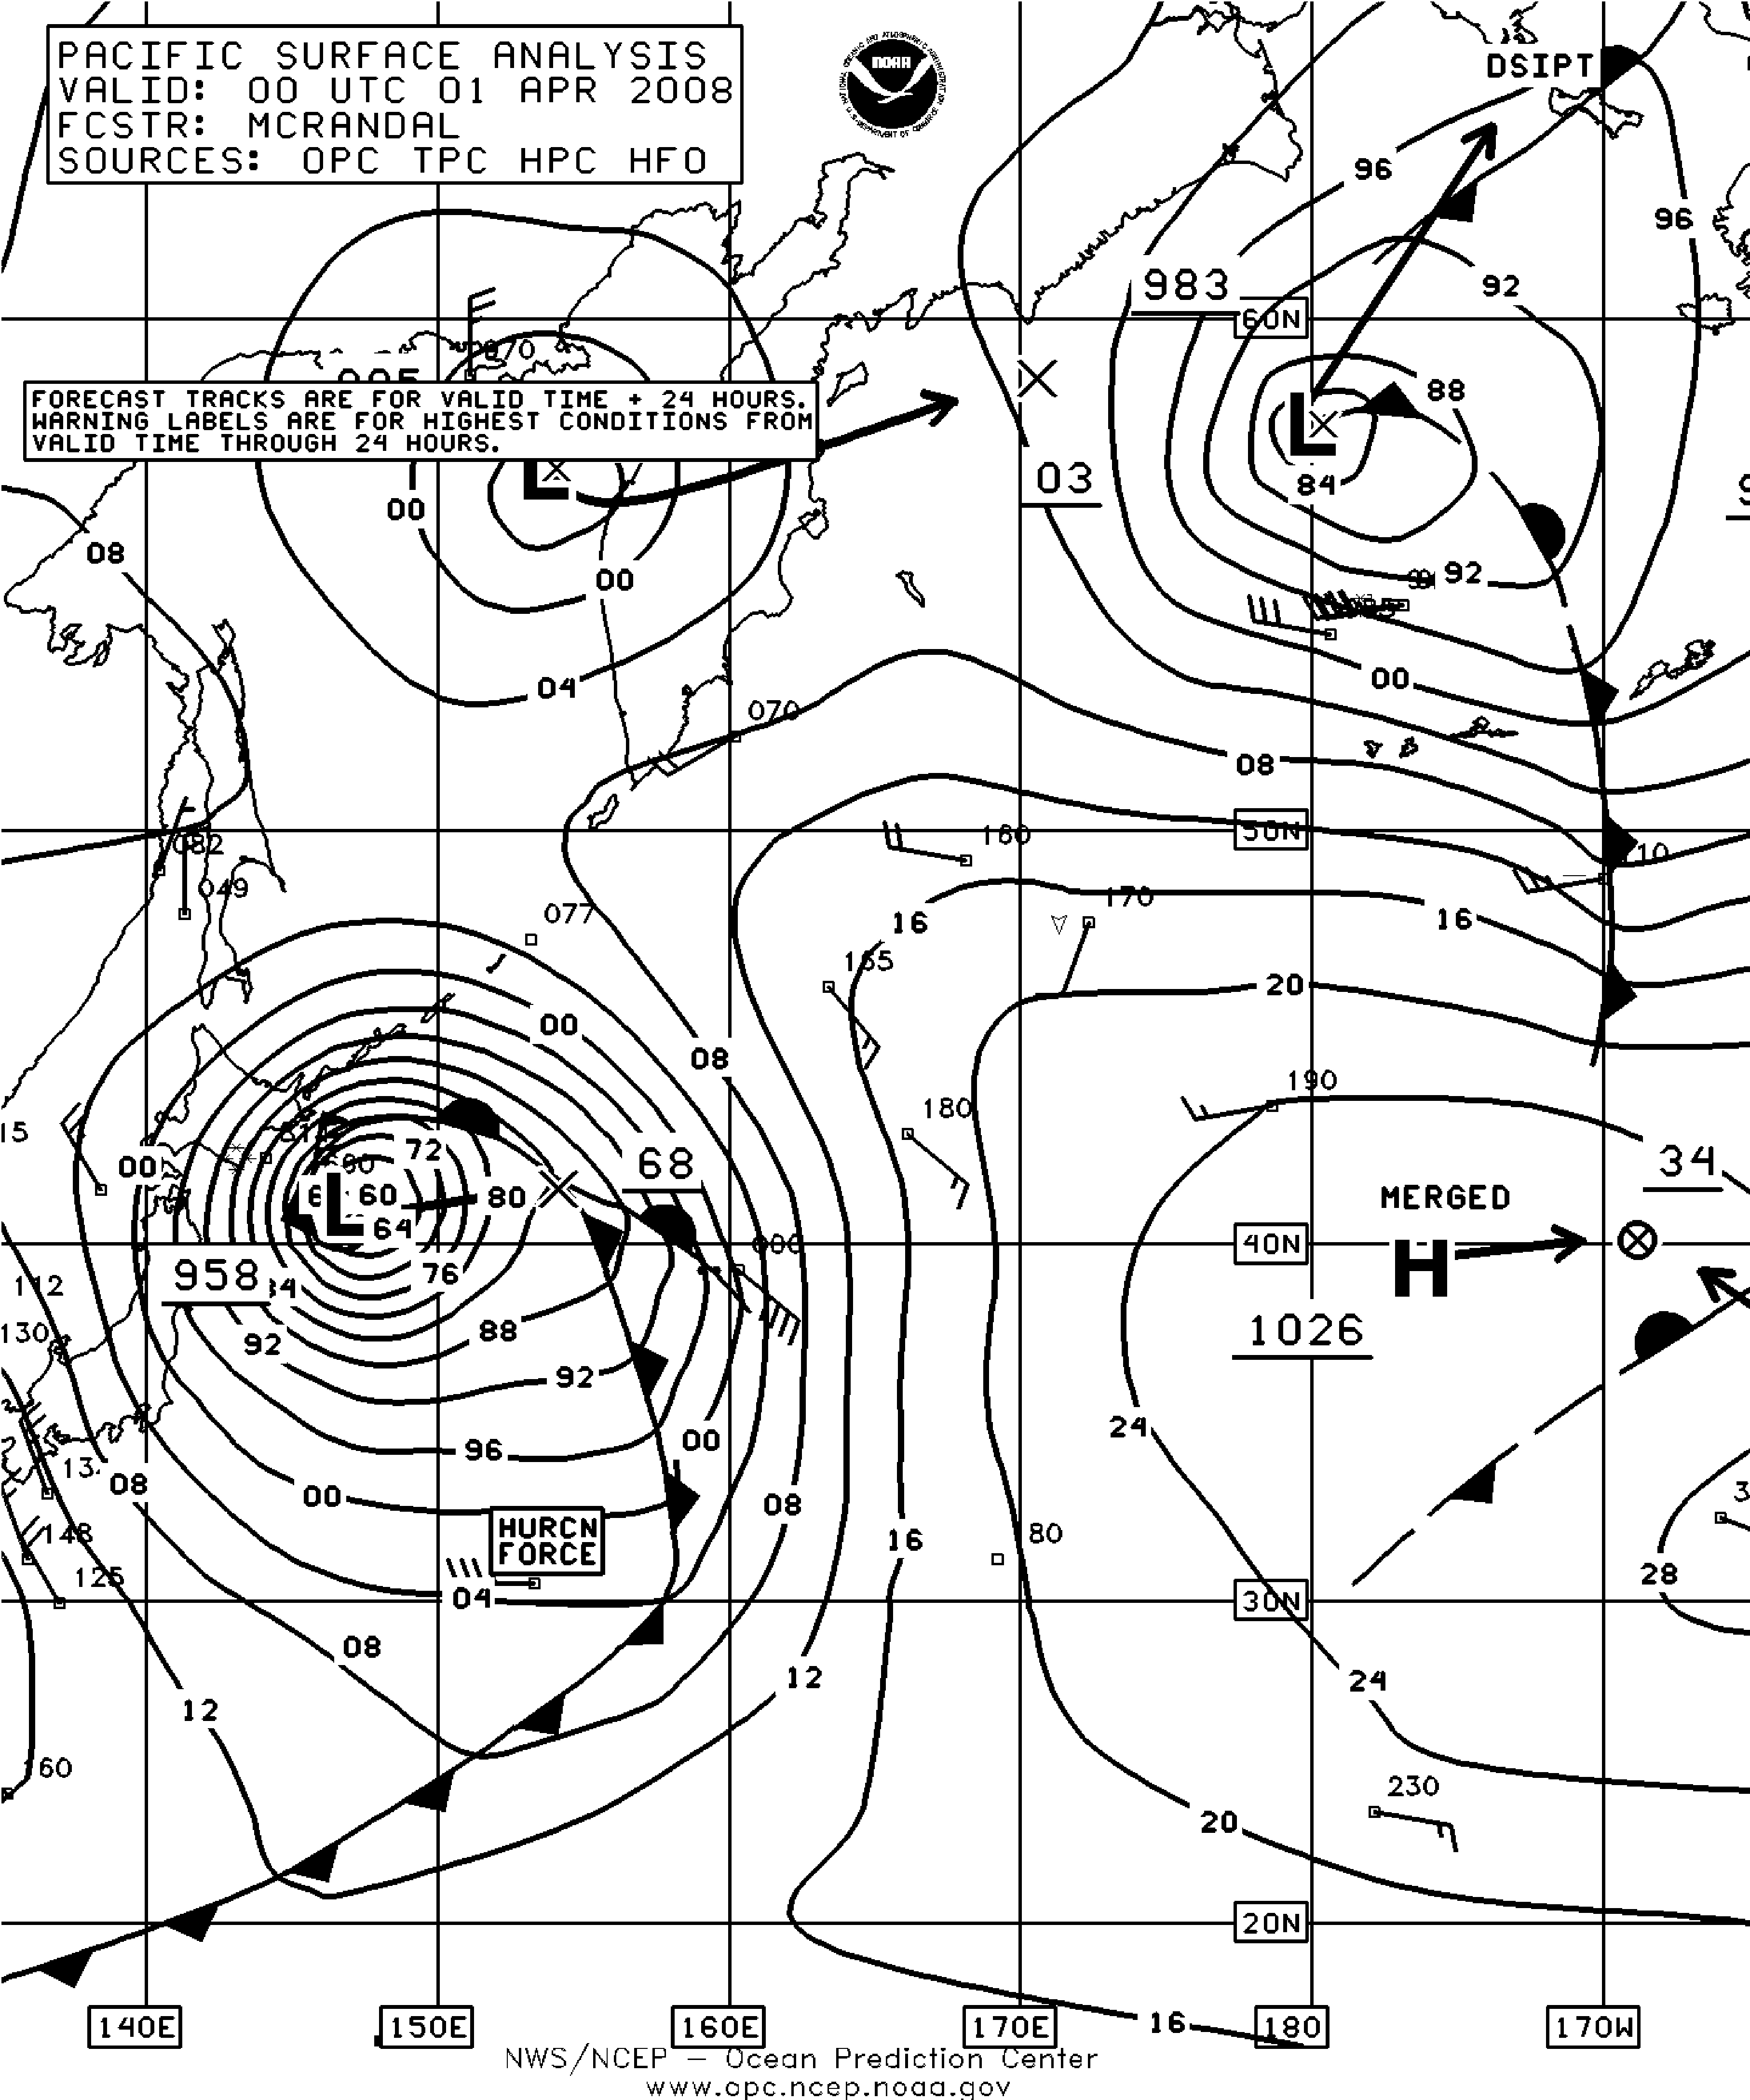
Figure 18. OPC North Pacific Surface Analysis charts (Part 2) valid 0000 UTC March 31 and 0000 UTC April 1, 2008. (Click to enlarge)
Southwestern North Pacific Storm, March 19-21:From its origin south of Japan near 32N early on the 19th, this cyclone moved slowly east and developed hurricane force winds with its compact circulation by 1200 UTC on the 20th as the center passed near 32N 143E with a 988 hPa central pressure. The ship Serenata (3EEE2)(34N 141E) reported north winds of 65 kts at that time. The center developed a lowest pressure of 984 hPa six hours later. At 0000 UTC on the 21st the Unknown Ship (A8009)(35N 142E) reported north winds of 55 kts. The cyclone weakened to a gale on the 21st as it drifted eastward, blocked by a high pressure ridge to the north.
Western North Pacific Storm, March 30-April 2:The rapid development of this cyclone is shown in Figure 18, as the central pressure fell 40 hPa in the twenty four hour period ending at 0000 UTC April 1. The lowest central pressure was 956 hPa six hours later. The ship Polar Spirit (C6WL6)(41N 146E reported north winds of 75 kts at 0000 UTC on the 1st while the ship APL China (WDB3161) encountered northwest winds of 48 kts near 37N 142E. Six hours prior, the same ship reported northwest winds of 45 kts and 6.0 meter seas (19 feet) near 39N 143E. The system then began to weaken and elongate northeast, becoming a gale near 44N 163E at 1800 UTC on the 2nd . The cyclone dissipated on the 3rd.
Back to top