Marine Weather Review North Atlantic Area
January to April 2008
By George P. Bancroft
NOAA National Center for Environmental Prediction
Introduction
The dominant storm track during the stormy months of January to March was from southwest to northeast, taking most cyclonic systems toward the area from the British Isles to Iceland between Greenland and the northern British Isles. Many of these originated near the Canadian Maritime Provinces or U.S. East Coast and developed hurricane force winds while passing over the central and northeastern waters. Each of the three months had a cyclone with central pressure below 950 hPa and January may have had a second one on the last day as indicated below.
There was a lack of intense activity moving north into the Davis Strait. April featured a more variable pattern with blocking at higher latitudes causing low pressure systems to move slowly and erratically. The nuhPaer of hurricane force lows dropped off sharply to one, after the preceding three months produced 9, 6 and 5, respectively. Although the North Pacific produced more hurricane force systems during this period, the North Atlantic produced deeper cyclones (with lower central pressure), as it has in the past. There were no tropical cyclones during the four month period, a time of year when there normally are none.
Significant Events of the Period
Storm near Greenland, January 1: A low which formed east of Greenland late in DecehPaer 2007 briefly produced hurricane force winds near the southern tip of Greenland early on January 1 before the cyclone moved north and weakened Figure 1. The observed winds (from scatterometer imagery) were similar to those in the March 1-3 event Figures 9 and 10 when that system and its associated winds were near Greenland.
North Atlantic Storms, January 1-5: A low pressure area intensified while moving out over the North Atlantic east of Newfoundland as depicted in Figure 1. The second part of Figure 1 shows the cyclone at maximum intensity with a central pressure down to 964 hPa. Table 1 reveals observations of hurricane force winds as the system was passing to the north of the Grand Banks. The cyclone later turned more southeast and weakened, before dissipating over northern France early on the 4th. A second storm system followed immediately after on a similar track at first, passing northeast of the island of Newfoundland early on the 3rd attaining a maximum intensity of 962 hPa when passing about 500 nmi northwest of Ireland early on 4th. QuikScat data revealed an isolated 65 kts wind just south of the center near that time. The ship CAP Melville (A8DK4) (47N 29W) reported a southwest wind of 50 kts and 11.5 meter seas (37 feet) at 0000 UTC on the 4th. The vessel Emden (3ERP5) (49N 21W) encountered west winds of 50 kts and 8.5 meter seas (28 feet) six hours later. The buoy 62095 (53.1N 15.9W) reported west winds of 40 kts and seas of 11.5 meters (38 feet) at 2100 UTC on the 4th. The cyclone subsequently weakened to a gale north of Great Britain on the 5th and passed northeast of Iceland late on January 6.
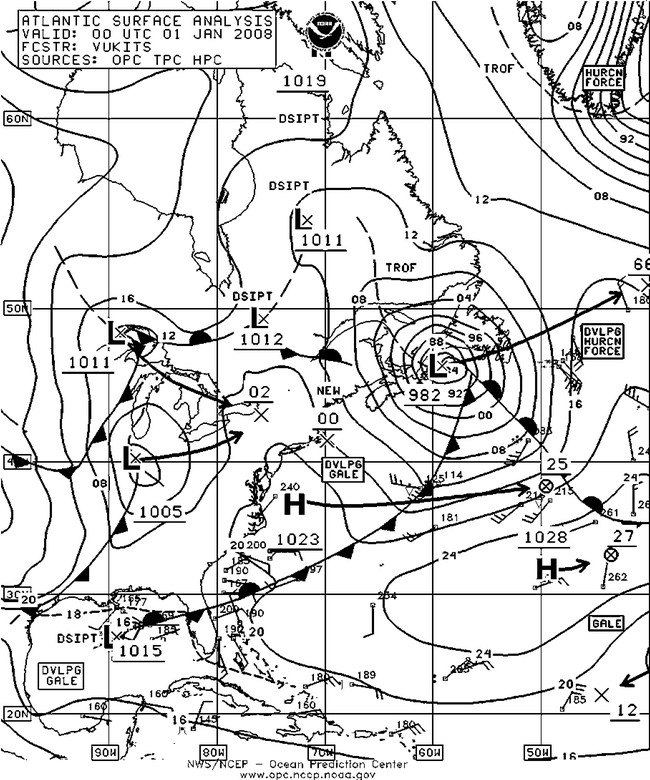
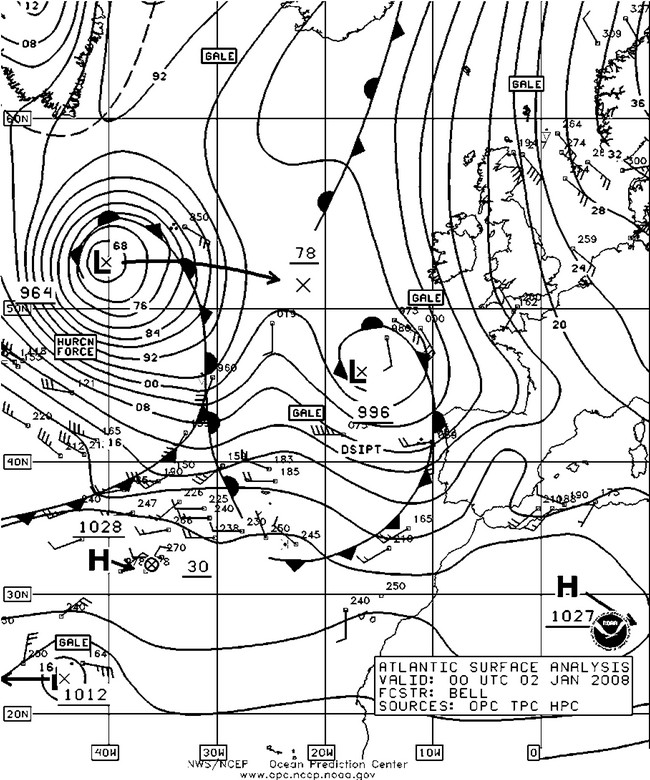
Figure 1. OPC North Atlantic Surface Analysis charts (Part 2 - west) valid 0000 UTC January 1 and 2, 2008. (Click to enlarge)
| Observation | Position | Date/Time (UTC) | wind (kts) | Seas (m/ft) |
|---|---|---|---|---|
| Hibernia (VEP717) | 46.7N 48.7W | 01/1200 | SW 80 | |
| GSF Grand Banks (YJUF7) | 46.8N 48.0W | 01/0600 | SE | 50 |
| Louis M. Lauzier (VOXS) | 46.7N 48.0W | 01/1200 | W 50 | 6.5/21 |
| Terra Nova (VCXF) | 46.4N 48.4W | 01/1200 | W 60 | |
| Marie Maersk (OULL2) | 46.5N 51.6W | 01/0600 | W 55 | 10.5/35 |
| Ever Dynamic (3FUB8) | 48N 46W 49N 43W |
01/1200 01/1800 |
SW 50 SW 60 |
7.5/24 9.0/29 |
| Ada Gorthon (SLCI) | 45N 57W | 01/0600 | W 50 | 6.0/19 |
| Cosco Bremerhaven P3ZY6 | 47N 49W | 01/1800 | W 45 maximum |
8.5/28 |
| Buoy 44139 | 44.1N 57W | 01/0300 01/0800 |
||
| Buoy 44138 | 44.2N 53.5W | 01/0900 01/1400 |
W 40 maximum |
6.5/22 8.5/28 |
| Buoy 44141 | 43N 58W | 01/0300 | NW 41 | |
| Buoy 44251 | 46.4N 53.4W | 01/0800 | W 47 | |
| Buoy 44704 | 44.8N 40.4W | 02/0200 | W 50 | |
| Buoy 44705 | 52.7N 42.9W | 01/1400 | E 50 |
Northeastern Atlantic Storm, January 8-9:This cyclone formed near the island of Newfoundland late on January 6 and did not rapidly develop until it reached the eastern waters, with the central pressure dropping an impressive 48 hPa in the twenty four hour period ending at 1800 UTC on the 8th. Figure 2 shows the cyclone with hurricane force winds at maximum intensity while over the North Sea. The highest wind report was from buoy 64049 (57.1N 2.2E) with a southwest wind of 70 kts at 1200 UTC on the 9th. Other selected observations taken in this storm are listed in Table 2. The cyclone then weakened while tracking northeast, weakening to a gale twelve hours later and moving inland over Norway by the 11th.
North Atlantic Storm of January 11-15: A developing low moved northeast off the southern Labrador coast late on January 12 and briefly developed 65 kts northeast winds north of the center as it passed 250 nmi south of Cape Farewell at 0000 UTC on the 14th with a 982 hPa central pressure, as revealed in scatterometer data. The system then redeveloped to the east before moving into Great Britain and dissipating on the 16th.
North Atlantic Storm, January 16-19: This cyclone formed south of Newfoundland near 40N early on the 16th and developed storm force winds later that day. While passing just southeast of the Grand Banks on the 17th the platform Hibernia (VEP717)(46.7N 48.7W) reported north winds of 50 kts. The cyclone then weakened while heading east over the central waters and developed a new center to the northeast late on the 17th. The new storm center developed a central pressure of 966 hPa near 61N 4E at 0000 UTC on the 19th, when the buoy 62138 (58.4N 1.7W) reported west winds of 55 kts. OPC briefly classified the cyclone as a hurricane force low at that time. The system weakened inland over Norway shortly thereafter.
| Observation | Position | Date/Time (UTC) | wind (kts) | Seas (m/ft) |
|---|---|---|---|---|
| Maria Gorthon (SLCH) | 57N 11W | 09/0000 | W 50 | 7.5/24 |
| Unknown Ship (LF4C) | 58N 2E | 09/1200 | SW 45 | 9.0/29 |
| Buoy 62095 | 53.1N 15.9W | 08/1100 | W 40 | 6.0/20 |
| Buoy 62081 | 51.0N 13.3W | 08/1500 | W 40 | 8.0/27 |
| Buoy 62093 | 54.9N 9.9W | 08/2100 | SW 55 | 6.5/21 |
| Buoy 62116 | 57.7N 1.4E | 09/0800 09/1400 | SW 50 W 50 | 6.5/21 10.0/32 |
| Buoy 62156 | 58.4N 2.6W | 09/1200 | W 55 | |
| Buoy 62119 | 57N 2E | 09/1300 | 9.5/31 | |
| Buoy 62143 | 57.7N 1.8E | 09/1200 | 12.5/41 | |
| Buoy 63119 | 57.4N 0.6E | 09/1200 | SW 50 | 11.5/38 |
| Observation | Position | Date/Time (UTC) | wind (kts) | Seas (m/ft) |
| Leonid Galchenko (UCUC) | 57N 17W | 31/0600 | NW | 52 |
| Pavel Kutakhov (UCTS) | 60N 7W | 31/0600 31/0600 | SW Pressure 945.4 hPa | 40 |
| Schiehallion (MWYG6) | 60N 4W | 31/0700 | S | 48 |
| Buoy 64049 | 57.1N 2.2E | 01/0000 | SW | 65 |
| Buoy 62133 | 57.1N 1.0E | 31/0600 | SW 48 | 5.0/16 |
| Buoy 62093 | 54.9N 9.9W | 31/0000 | SW 45 maximum | 8.5/28 |
| Buoy 62108 | 57.0N 10.8W | 31/0200 | 9.0/30 | |
| Buoy 63056 | 59.5N 1.6E | 31/0700 31/0900 | S 40 maximum | 6.0/20 7.5/24 |
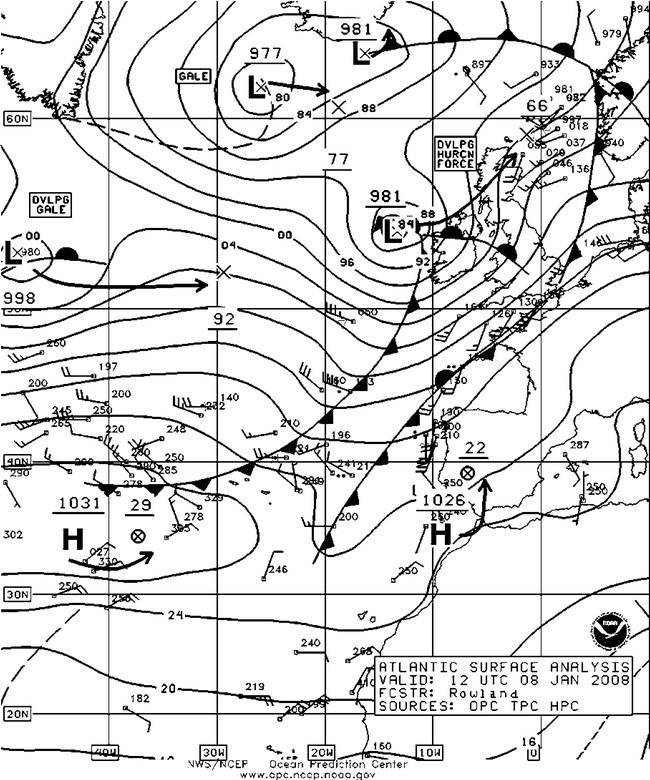
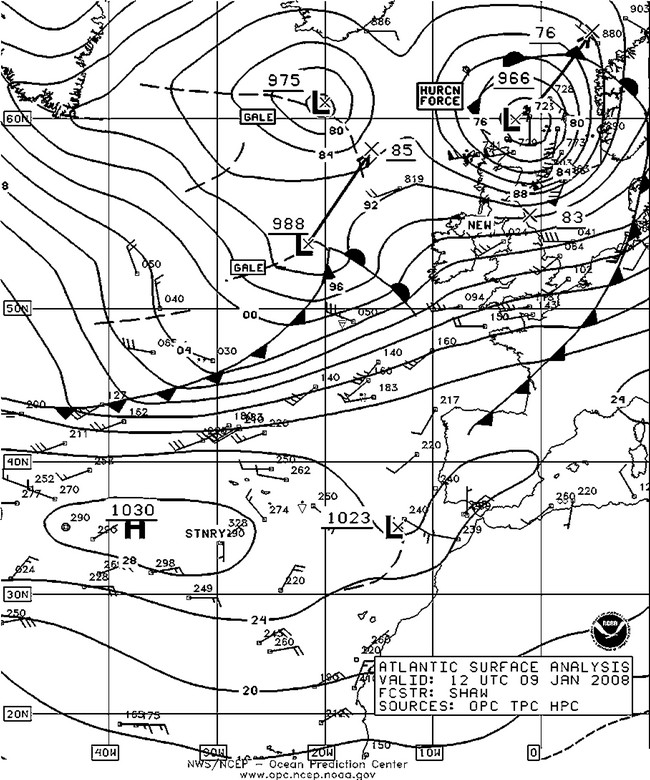
Figure 2. OPC North Atlantic Surface Analysis charts (Part 1 - east) valid 1200 UTC January 8 and 9, 2008. (Click to enlarge)
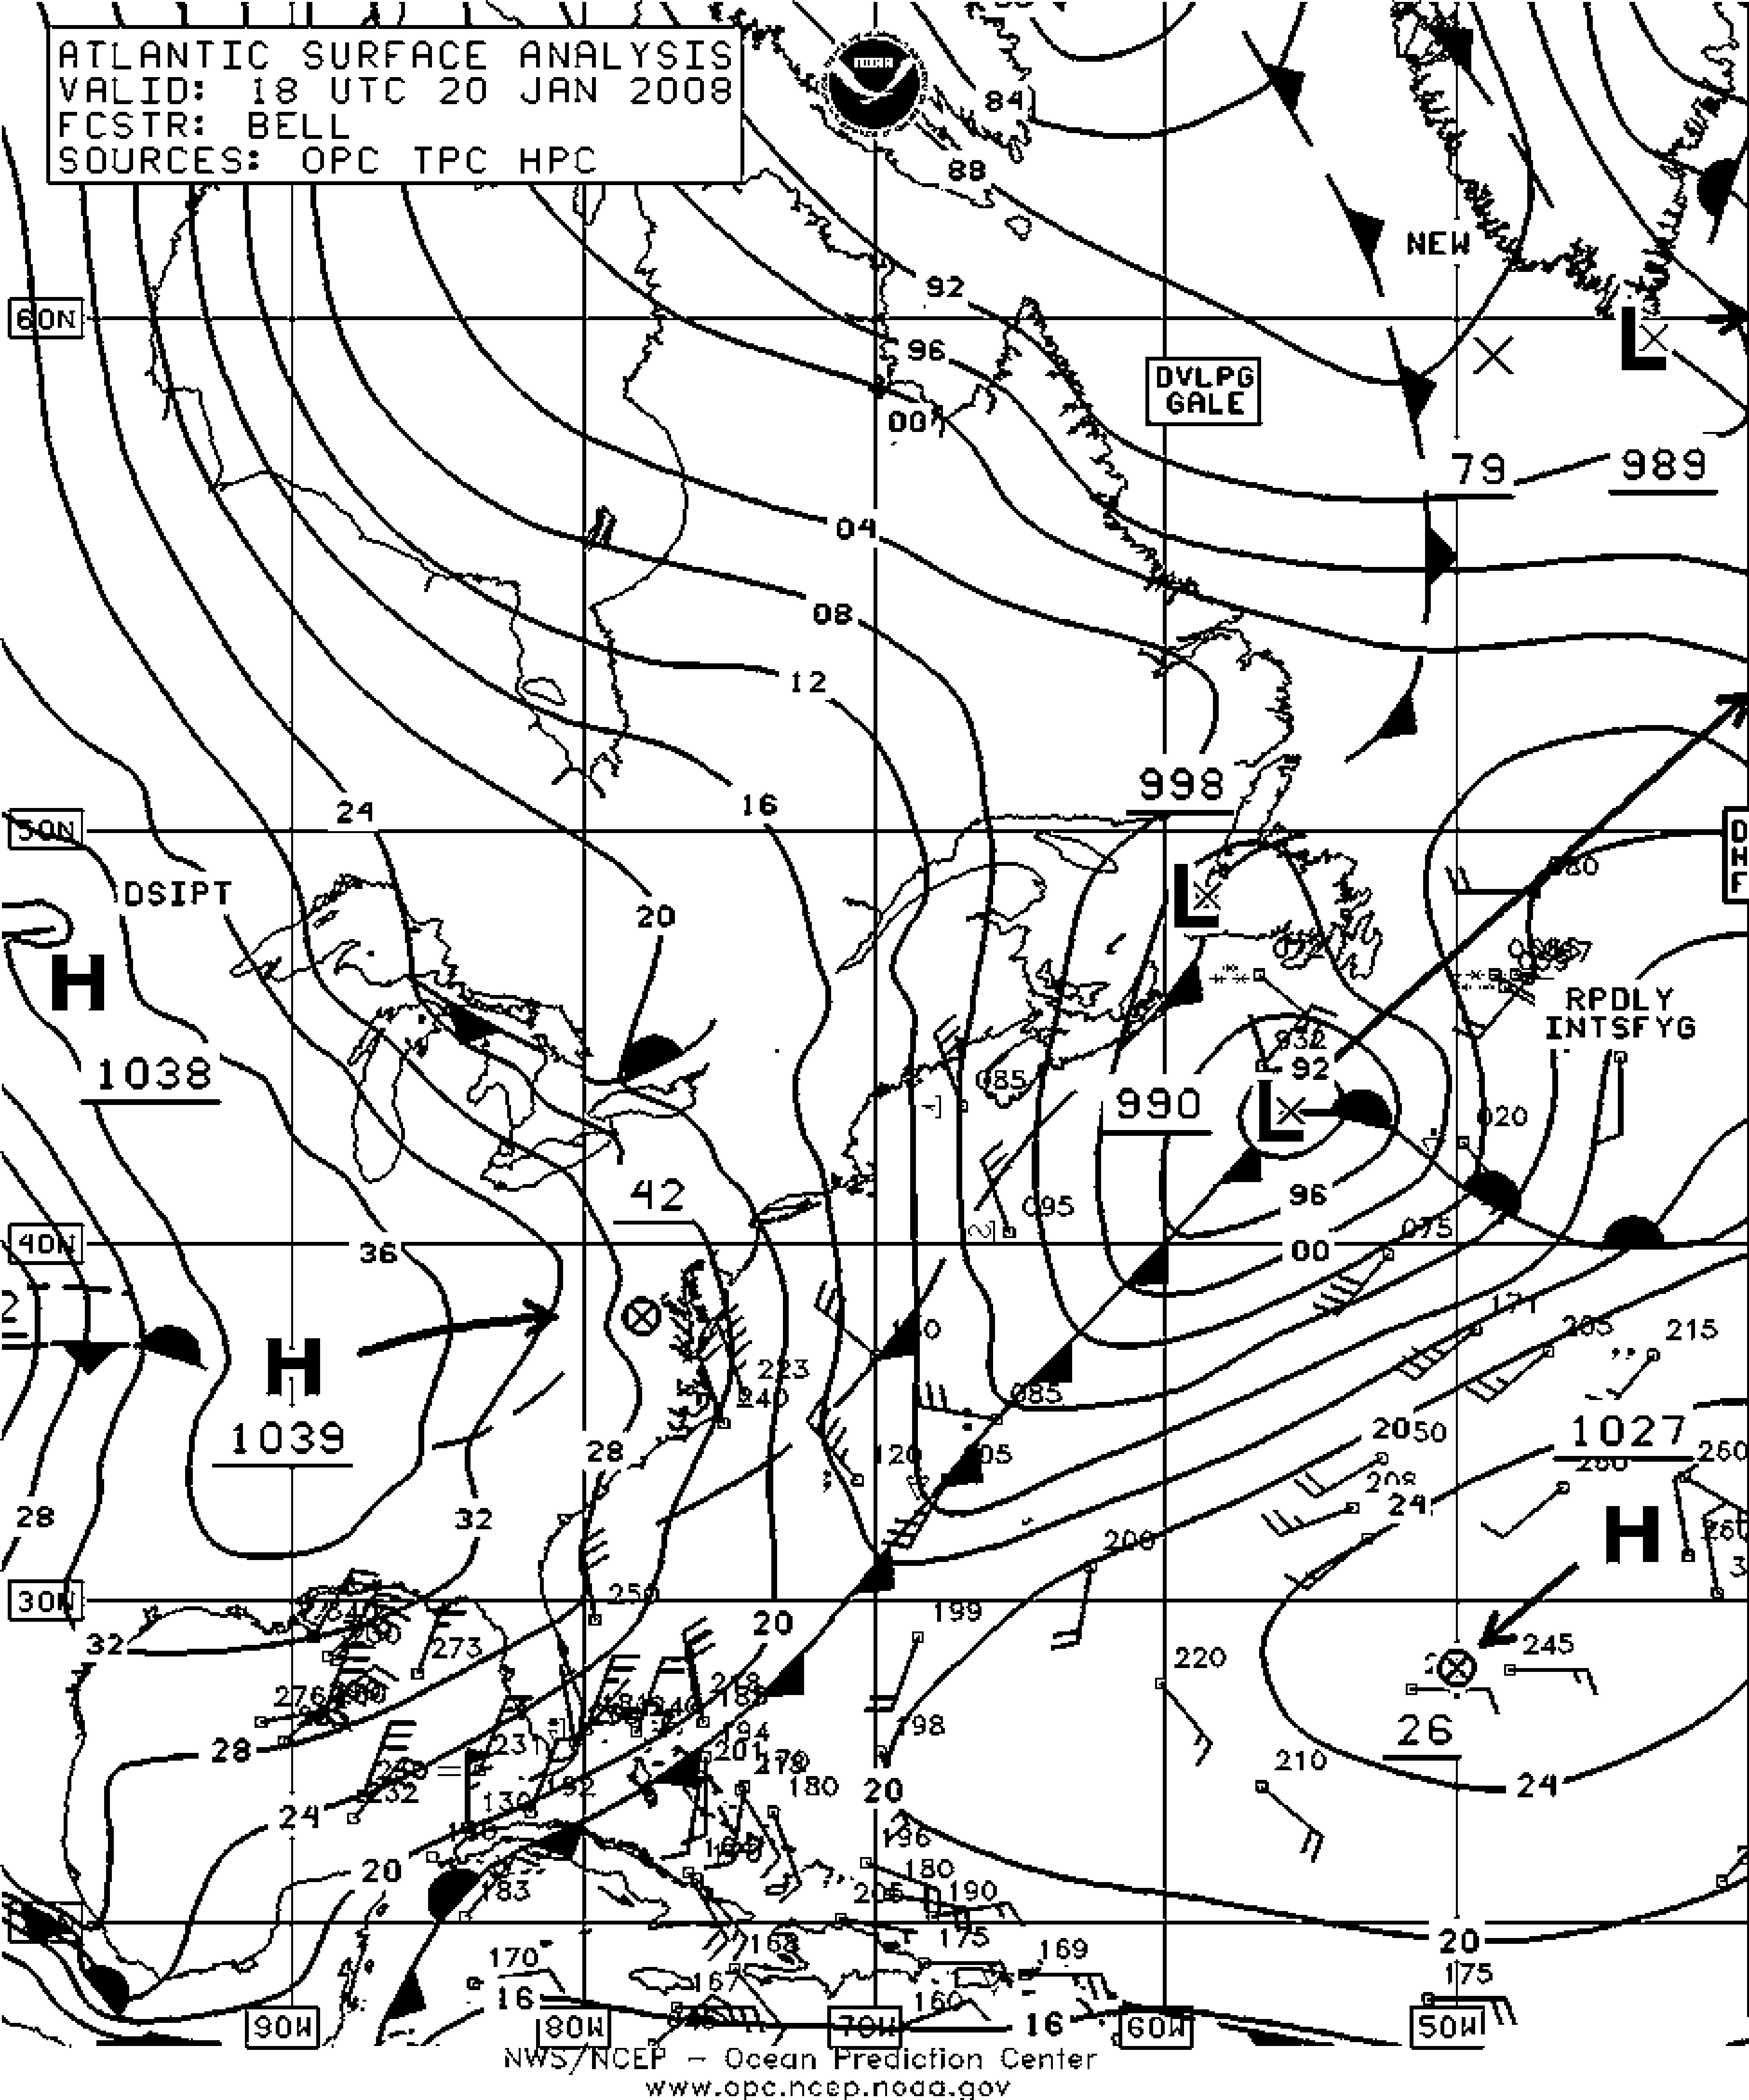
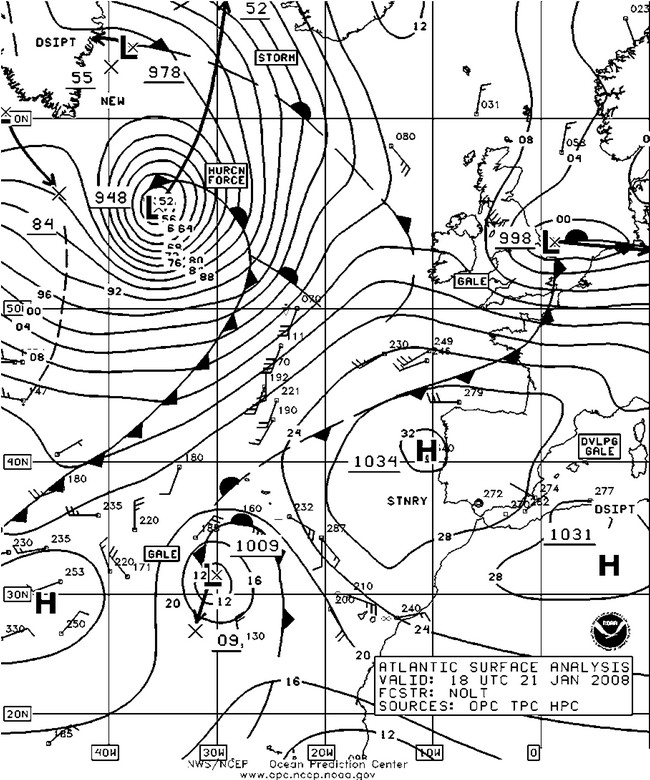
Figure 3. OPC North Atlantic Surface Analysis charts valid 1800 UTC January 20 (Part 2) and 1800 UTC January 21, 2008 (Part 1). (Click to enlarge)
North Atlantic Storm, January 20-25: This major storm originated as a frontal wave of low pressure in the Gulf of Mexico early on January 19th. The central pressure fell to 990 hPa as the low passed south of Newfoundland on the 20th with more rapid development to follow (Figure 3). The central pressure fell 42 hPa in the twenty four hour period ending at 1800 UTC on the 21st, and the lowest central pressure of 945 hPa (27.91 inches) occurred six hours later. The QuikScat imge in Figure 4 near the time of maximum intensity reveals a large area of hurricane force winds on the south side of the storm center with winds as high as 90 kts. Earlier, the platform Hibernia (VEP717)(46.7N 48.7W) reported southwest winds of 66 kts at 0300 UTC on the 21st, while GSF Grand Banks (YJUF7)(46.8N 48W) encountered west winds of 53 kts. The drifting buoy 44706 (42N 51.9W) reported a southwest wind of 60 kts at 0100 UTC on the 21st. Buoy 44704 (47.8N 39.8W) reported a south wind of 68 kts three hours later, followed by a report of southwest winds of 54 kts from the buoy 44705 (51.5N 42.2W) at 1100 UTC on the 21st. At 1200 UTC January 21 the ship Western Highway (3EJK5) (34N 69W) reported southwest winds of 45 kts and 5.0 meter seas (16 feet). Later, the Berge Nord (LADY5) encountered 9.5 meter seas (31 feet) along with west winds of 25 kts near 48N 27W) at 0000 UTC on the 22nd. The cyclone subsequently turned northwest and began to weaken but maintained hurricane force winds until 1800 UTC on the 23rd when it passed just east of Greenland. The storm then passed between Greenland and Iceland on the 25th.
North Atlantic Storm of January 23-25: This cyclone moved northeast from the Canadian Maritime Provinces early on the 23rd and developed hurricane force winds as it moved rapidly out over the North Atlantic. Hibernia (VEP717)(46.7N 48.7W) reported south winds of 65 kts ahead of the cyclones cold front at 1800 UTC on the 23rd. Later on the 24th the system developed west winds of 70 kts as observed in scatterometer imagery as the deepening cyclone passed near Iceland. The cyclone developed a lowest central pressure of 968 hPa over the Norwegian Sea early on the 25th before passing north of the area as a gale shortly thereafter. At 0000 UTC on the 24th the Ivaran Raven (DIGF) near 49N 15W reported west winds of 40 kts and 9.0 meter seas (30 feet). The Schiehallion (MWYG6) encountered west winds of 45 kts near 61N 5W at 0200 UTC on the 25th. The buoy 64049 (57.1N 2.2E) reported southwest winds of 60 kts three hours later. Seas became quite high northwest and north of the British Isles following passage of this system, with buoy 64045 (59.1N 11.7W) reporting 12.0 meter seas (40 feet) at 0200 UTC on the 25th. Five hours later the buoy 63115 (61.6N 1.5E) reported west winds of 50 kts and 11.0 meter seas (36 feet).
North Atlantic Storm, January 25- 27: Initial development of this cyclone was as a frontal wave of low pressure off the southeast U.S. coast early on the 24th. The system tracked northeast and developed storm force winds south of Newfoundland on the 25th. As the cyclone developed a central pressure of 964 hPa near 58N 34W by 0000 UTC on the 27th scatterometer imagery near that time revealed hurricane force winds up to 85 kts south of the center similar in appearance to Figure 4 except smaller in area. The cyclone maintained hurricane force winds as it passed north of Iceland late on the 27th with a central pressure as low as 958 hPa.
Southwestern North Atlantic Storm, January 27-29: This cyclone developed quickly on the 27th as it passed offshore northeast of Cape Hatteras, with the central pressure dropping to 985 hPa as it passed just south of Georges Bank by 0600 UTC on the 28th. This was a drop of 25 hPa in twenty four hours. High resolution QuikScat imagery revealed a compact area of 50 to 60 kts winds around the north and west sides late on the 27th. The cyclone then weakened as it drifted toward Newfoundland on the 28th, with winds dropping to gale force on the 29th.
Northeast Atlantic/ North Sea Storm, January 30-February 1: With strong high pressure over the central waters, the next major development occurred over the far north as depicted in Figure 5, as low pressure forming east of Greenland by the 30th redeveloped eastward over the following twenty four hours, with the central pressure falling 46 hPa. The second part of Figure 5 shows the cyclone near maximum intensity. The high resolution scatterometer imagery in Figure 6 shows the northwest side of the storm where northerly winds were up to 70 kts. Table 3 lists selected ship and buoy observations from early on the 31st. One of the reports Pavel Kutakhov (UCTS) indicates that the cyclone may have been below 950 hPa at maximum intensity. The cyclone subsequently turned southeast into the North Sea and began to weaken, moving east across Denmark on February 1.
Northeastern Atlantic Storm, February 6-7: With high pressure shifted toward western Europe, the next major development was a new low which formed over the central North Atlantic by 0000 UTC on the 6th and moved rapidly northeast across Iceland by early on the 7th with the central pressure down to 966 hPa. The cyclone briefly developed hurricane force west winds just south of Iceland early on the 7th with high resolution QuikScat imagery showing a small area of winds 50 to 70 kts.
North Atlantic Storm, February 7-10: This major storm originated from a complex area of low pressure south of Newfoundland near 42N which rapidly intensified as it passed northeast of the Grand Banks on the 7th. Figure 7 depicts the period of most rapid intensification of this cyclone, with the central pressure dropping 42 hPa in the twenty four hour period ending at 1800 UTC on the 8th. The lowest central pressure of 934 hPa (27.58 inches) occurred six hours later, making this cyclone the most intense of the period in both oceans and the only one in which the pressure dropped to below 940 hPa. The storm moved into an area lacking ship and buoy observations, where scatterometer data Figure 8 show an area of west to northwest winds up to 80 kts southwest of the storm center likely induced by the southern tip of Greenland. Not shown here, there was another area of hurricane force winds just off the figure and closer to the storm center. Hurricane force winds lasted through the 9th as the storm center moved into the Denmark Strait and began to weaken. The cyclone weakened to a gale force low northwest of Iceland on the 10th.
| Observation | Position | Date/Time (UTC) | wind (kts) | Seas (m/ft) |
|---|---|---|---|---|
| Essen Express (DHEE) | 45N 55W 45N 56W | 11/2100 12/0300 | SW 50 SW 55 | 10.0/33 10.0/33 |
| Atlantic Conveyor (SCKM) | 46N 51W 45N 53W | 12/0600 12/1800 | SW 60 W 55 | 4.5/14 6.5/21 |
| CSCL Fuzhou (ELYA7) | 48N 43W | 13/0600 | SW 35 | 8.0/27 |
| Hibernia (VEP717) | 46.7N 48.7W | 12/1500 | SW 60 | |
| GSF Grand Banks (YJUF7) | 46.8N 48W | 12/1500 | SW 50 | 7.5/24 |
| Terra Nova (VCXF) | 46.4N 48.4W | 12/1200 | SW 40 | 7.5/24 |
| Buoy 44139 | 44.2N 57W | 11/2200 | W 35 | 9.0/29 |
| Buoy 44705 | 52.4N 38.1W | 12/0700 | SE 40 | |
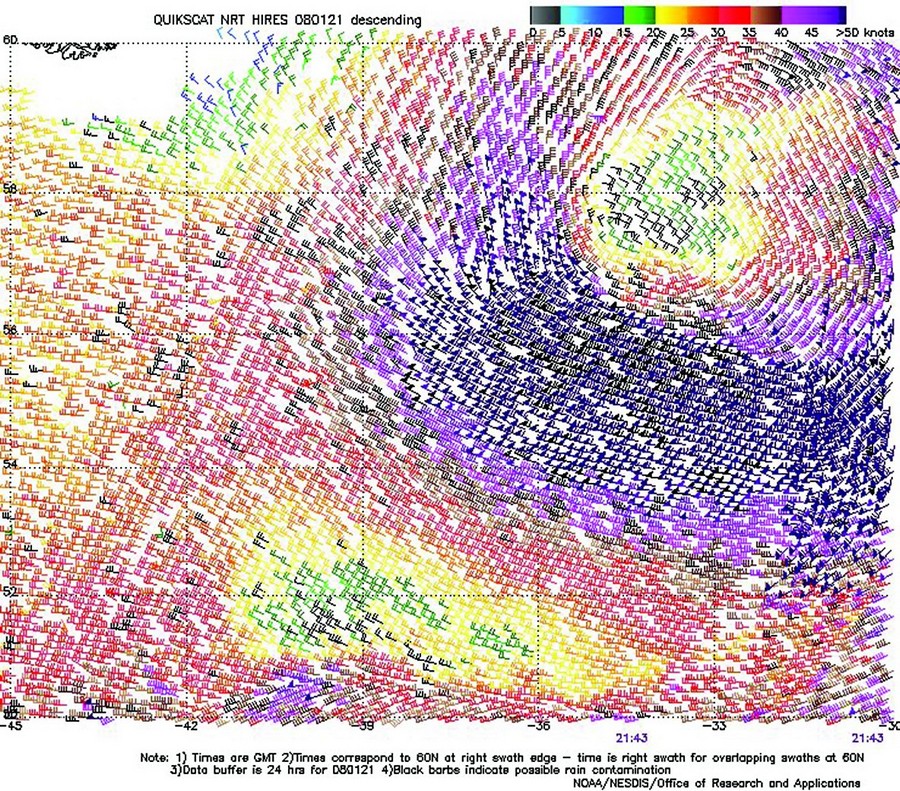
Figure 4. High resolution QuikScat
scatterometer image of satellite-sensed
winds around the storm shown in the
second part of Figure 3. The resolution
is 12.5 km versus 25 km in the standard
version of the imagery. The valid time
of the pass is 2143 UTC January 21,
2008, or about three and three-quarters
hours later than the valid time of the
second part of Figure 3. The center of
the storm is near 57N 34W. Image is
courtesy of NOAA/NESDIS/Office of
Research and Applications.
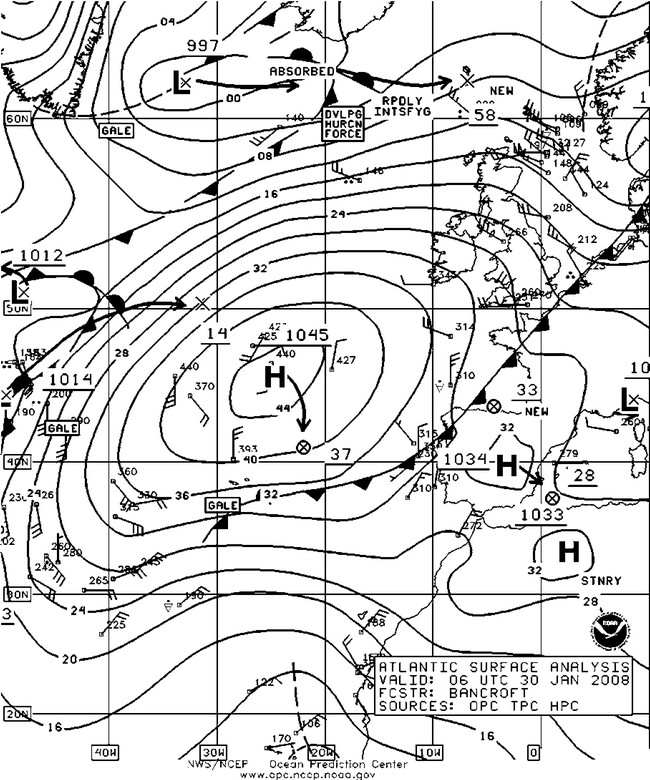
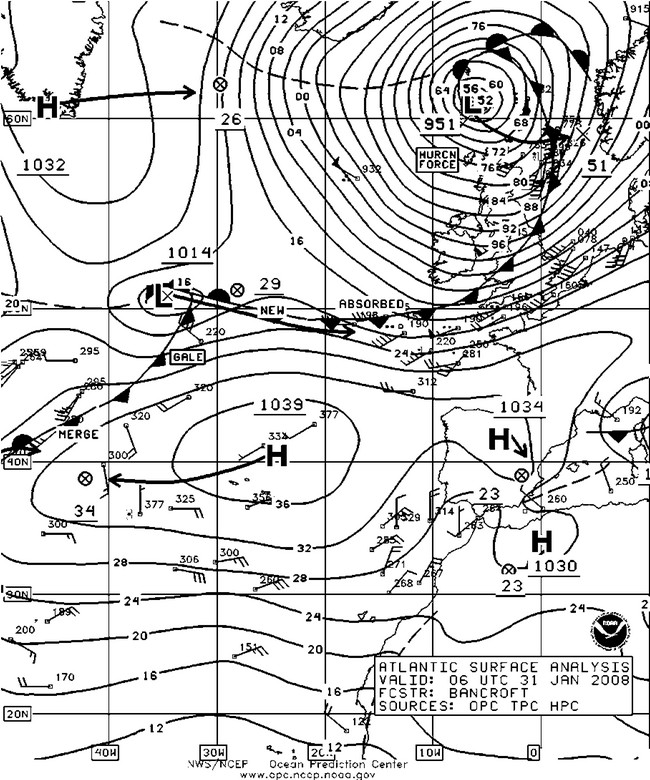
Figure 5. OPC North Atlantic Surface Analysis charts (Part 1) valid 0600 UTC January 30 and 31, 2008.
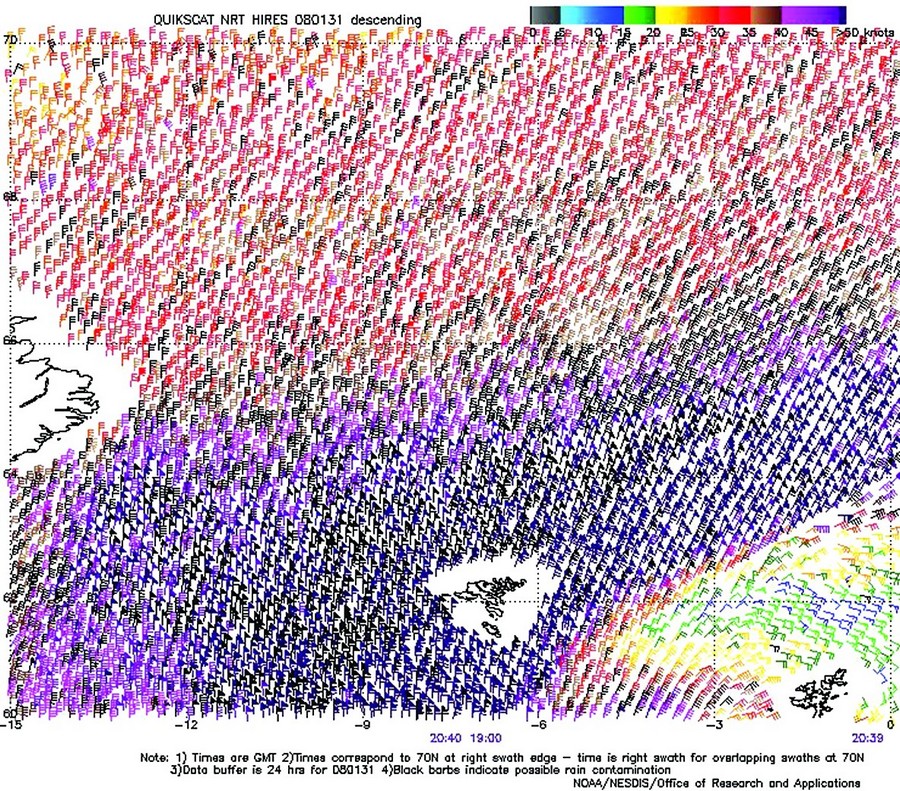
Figure 6. High resolution QuikScat
scatterometer image of satellite-sensed
winds around the northwest side of the
storm shown in Figure 5. The valid time
of the pass is 2040 UTC January 31,
2008, or about fourteen and threequarters
hours later than the valid time
of the second part of Figure 5. The
center of the storm is off the lower right
side of the image. Image is courtesy of
NOAA/NESDIS/Office of Research
and Applications.
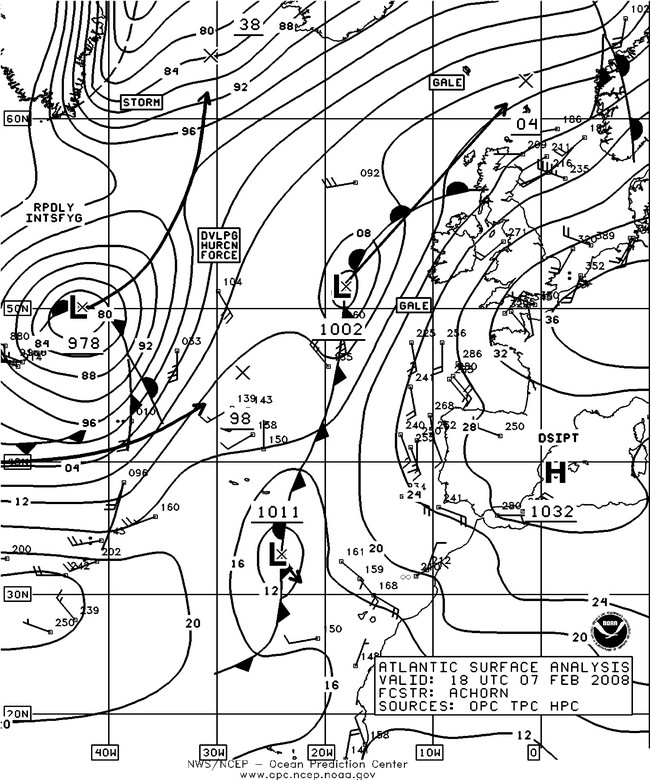
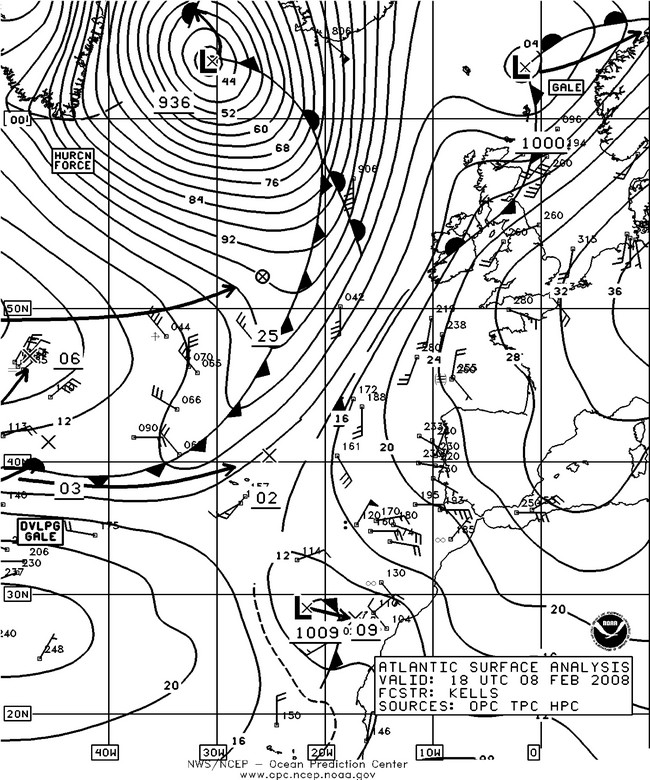
Figure 7. OPC North Atlantic Surface Analysis charts (Part 1) valid 1800 UTC February 7 and 8, 2008.
North Atlantic Storm, February 9-11: A frontal wave of low pressure south of the island of Newfoundland near 39N was the origin of the next hurricane force low. Instead of turning north toward Greenland like its stronger predecessor, this cyclone was blocked by high pressure to the north and turned east along 43N after passing south of the Grand Banks, and rapidly intensified early on February 10. The central pressure fell 14 hPa in the six hours ending at 1200 UTC on the 10th, leading to a 972 hpa hurricane force low (43N 36W) at that time. Coarser resolution (25 km) scatterometer data available several hours prior to this time revealed a compact circulation with one 65 kts wind barb south of the center. The cyclone then weakened while drifting east over the central waters, with its winds lowering to gale force twenty four hours later.
North Atlantic Storm, February 11-13: This cyclone originated near the New England coast early on February 10 and moved to the Gulf of St. Lawrence the following day while intensifying, before re-forming to the northeast over the Labrador Sea by early on the 12th with the central pressure as low as 965 hPa. Hurricane force winds of up to 70 kts were observed in the northerly flow over the Labrador Sea from high resolution scatterometer winds early on the 12th in a pattern similar to that of the northeastern Atlantic storm in Figure 6. Some ship, buoy and oil platform observations taken during the storm are listed in Table 4. The cyclone weakened as it headed northeast with its winds lowering to gale force late on the 13th, with the center passing east of Greenland on February 14.
North Atlantic Storm, February 22-24: A frontal wave of low pressure moved off the mid-Atlantic coast of the U.S. on the 20th and tracked northeast, becoming a storm in the central waters on the 22nd. The central pressure dropped 30 hPa in the twenty four hour period ending at 0000 UTC on February 23. The system briefly developed hurricane force winds south of the center as it approached Iceland with a 970 hpa central pressure early on the 23rd with winds up to 80 kts south of the center. This storms intensity and winds observed using scatterometer imagery were similar to those in the January 25-27 event described above. The central pressure was 964 hPa as the system reached Iceland at 1200 UTC on the 23rd, and the center then passed northeast of Iceland the following night.
North Atlantic Storm, February 23-26: Like its predecessor, this storm originated near the U.S. East Coast, moving offshore early on the 22nd . The cyclone developed storm force winds as it passed southeast of Nova Scotia early on February 23. The central pressure fell 26 hPa in the following twenty four hours as the cyclone headed northeast into the central North Atlantic, developing a central pressure as low as 958 hPa as it passed 350 nmi south of Iceland at 1200 UTC on the 25th. High resolution scatterometer imagery revealed winds of 50 to 70 kts from the west and northwest on the south side of the center early on the 25th. The cyclone then began to weaken as it passed north of Great Britain by the 26th, before moving into southern Norway as a gale force low late on February 26.
Northeastern Atlantic Storm, March 1-3: As strong high pressure developed over the central waters by early March this cyclone formed near Greenland late on March 1 and tracked southeast toward Great Britain as shown in Figure 9. Although the intensity in terms of central pressure was modest by North Atlantic standards this time of year, the strong high pressure to the south resulted in a large pressure difference between the two pressure systems. Figure 10 shows winds of 50 to 70 kts in the northwest flow south and southwest of the cyclone, and west of Great Britain. Similar winds were observed by satellite southeast of the southern tip of Greenland early on the previous day when the cyclone was near Greenland. The buoy 62095 (53.1N 16.0W) reported northwest winds of 35 kts and 13.0 meter seas (42 feet) at 1100 UTC on the 3rd. To the southeast the buoy 62092 (51.2N 10.4W) reported north winds of 35 kts and 12.0 meter seas (40 feet) eight hours later. Winds were northwest 45 kts at buoy 62107 (50.1N 6.1W) at 2300 UTC March 3. Buoy 62163 (47.5N 8.5W) reported highest seas of 10.0 meters (32 feet) at 0200 UTC on the 4th. The ship Hanjin Vienna (DIBZ)(43N 10W) encountered north winds of 45 kts and 8.5 meter seas (28 feet) at 1200 UTC on the 4th. The cyclone weakened as it moved southeast into France by the 4th.
| Observation | Position | Date/Time (UTC) | Wind (kts) | Seas (m/ft) |
|---|---|---|---|---|
| St Louis Express (WDD3825) | 48N 8W | 10/0200 | SW 60 | |
| Stadiongracht (PDBY) | 48N 7W | 10/0600 | W 55 | |
| Buoy 62023 | 51.5N 7.9W | 09/2200 10/0800 10/0900 | S 50 W 55 maximum | 3.5/12 8.5/28 9.5/31 |
| Buoy 62095 | 53.1N 15.9W | 10/0500 10/0400 | NW 42 maximum | 13.5/44 15.0/49 |
| Buoy 62081 | 51N 13.3W | 10/0400 10/0700 | NW 52 maximum | 14.0/46 18.0/59 |
| Buoy 62029 | 48.7N 12.5W | 10/0400 10/1100 | NW 45 maximum | 14.5/47 16.0/52 |
| Buoy 62092 | 51.3N 10.5W | 10/1100 | 13.5/44 | |
| Buoy 62107 | 50.1N 6.1W | 10/1400 | NW 55 | 10.5/34 |
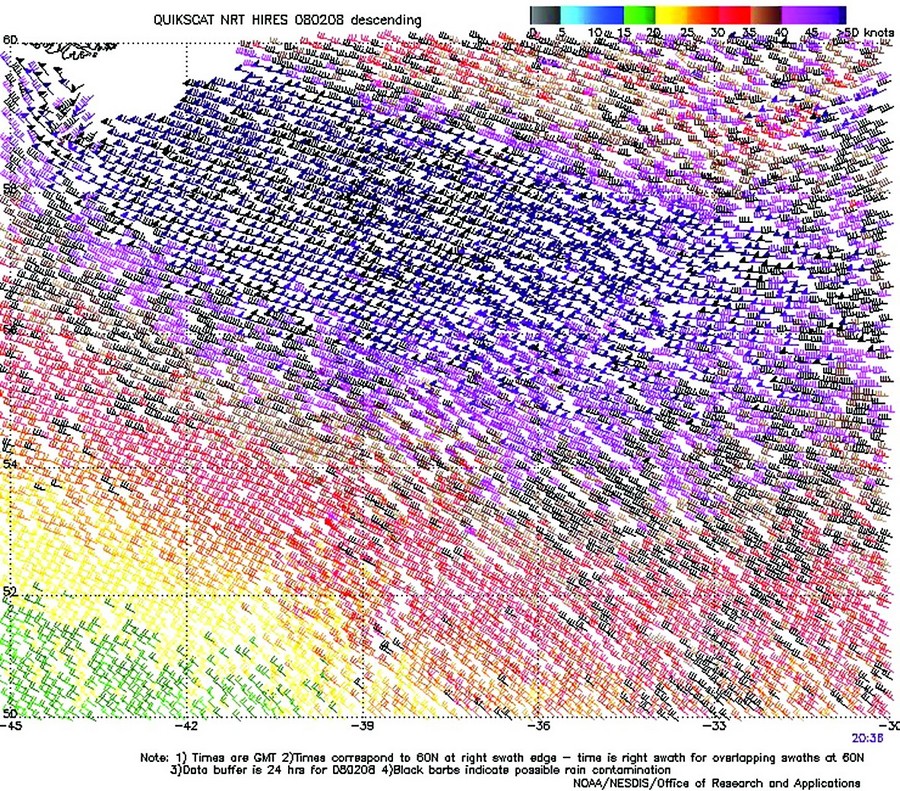
Figure 8. High resolution QuikScat
scatterometer image of satellite-sensed
winds around the south side of the storm
shown in the second part of Figure 7.
The valid time of the pass is 2036 UTC
February 8, 2008, or about two and
one-half hours later than the valid time of
the second part of Figure 7. The center of
the storm is east of southern Greenland,
the southern tip of which appears in the
upper left corner of the image. Image is
courtesy of NOAA/NESDIS/Office of
Research and Applications. (Click to enlarge)
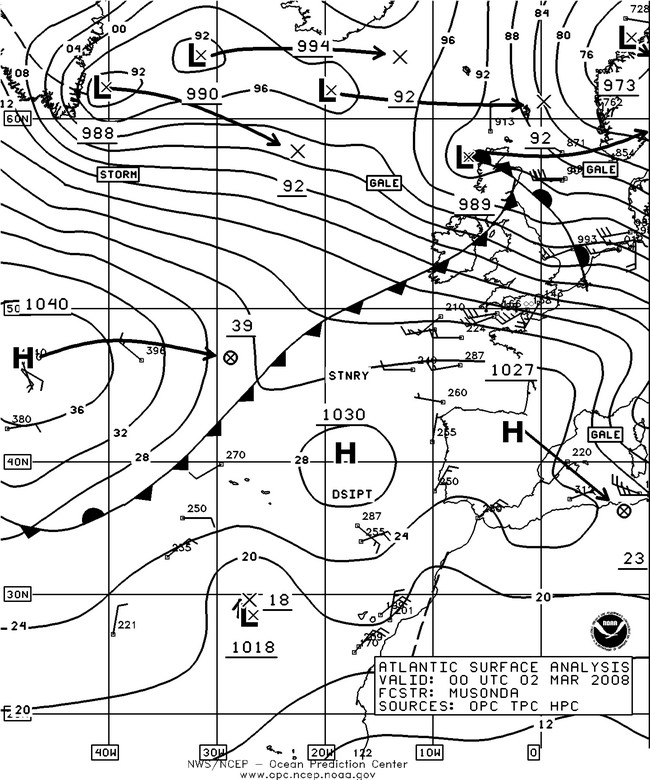
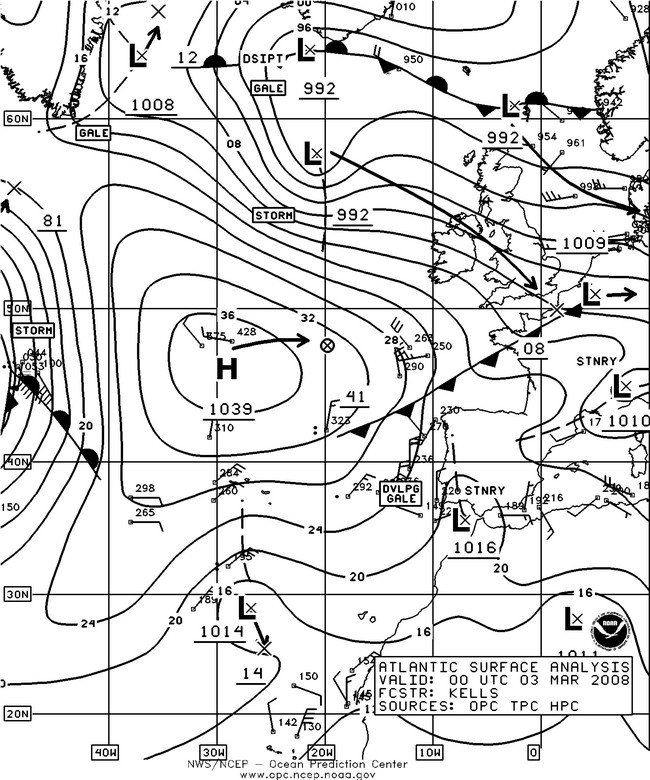
Figure 9. OPC North Atlantic Surface Analysis charts (Part 1) valid 0000 UTC March 2 and 3, 2008. (Click to enlarge)
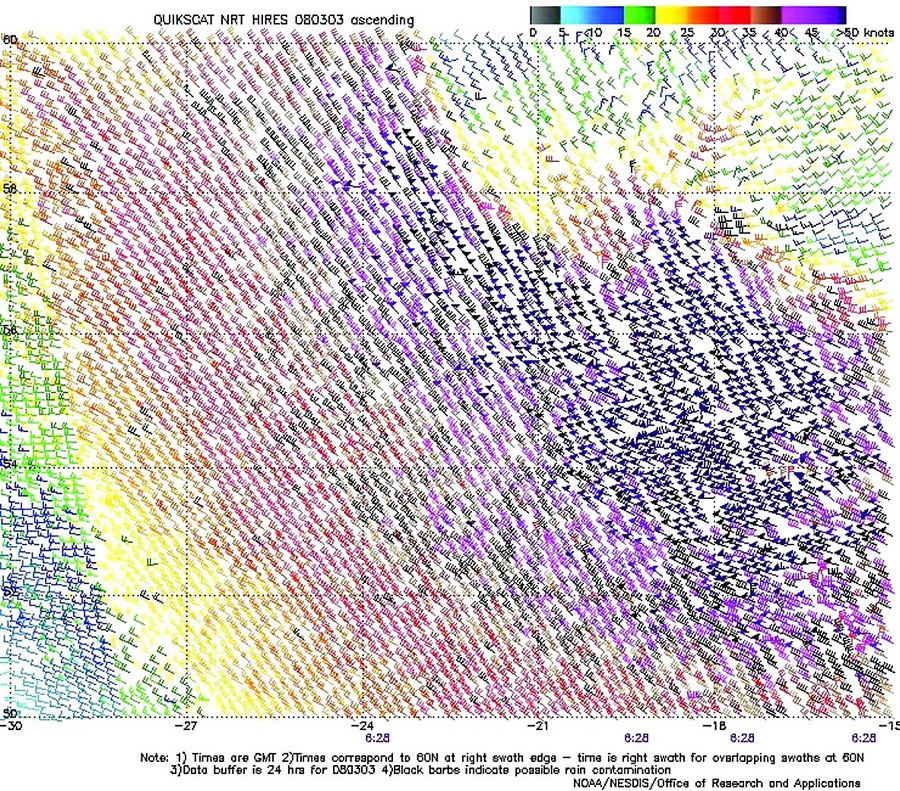
Figure 10. High resolution QuikScat
scatterometer image of satellite-sensed
winds around the storm shown in the
second part of Figure 9. The valid time
of the pass is 0628 UTC March 3,
2008, or about six and one-half hours
later than the valid time of the second
part of Figure 9. The center of the storm,
not well defined, is in the upper right
side of the image. Image is courtesy of
NOAA/NESDIS/Office of Research
and Applications. (Click to enlarge)
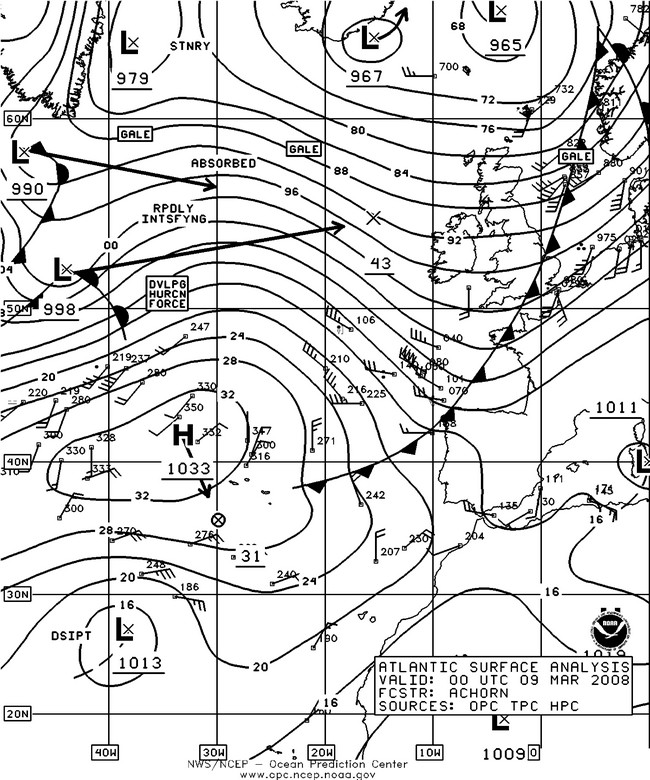
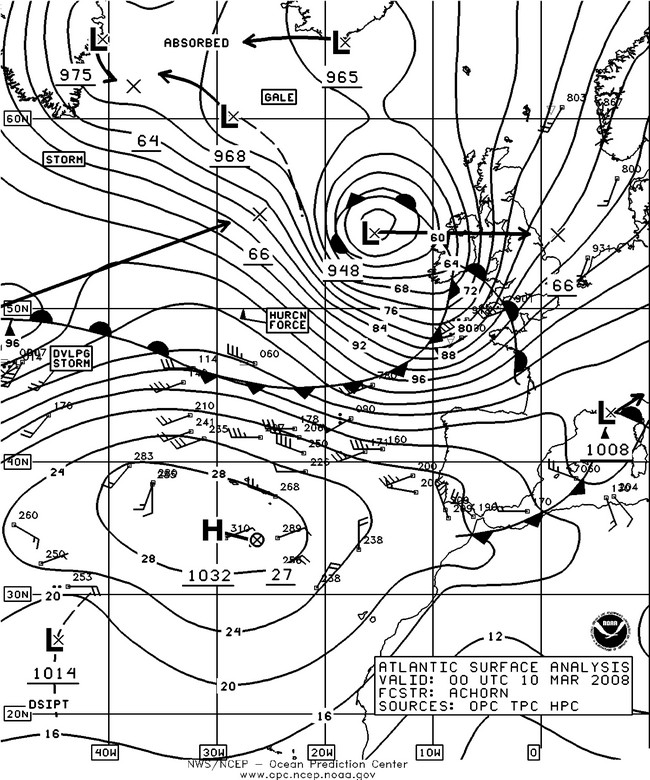
Figure 11. OPC North Atlantic Surface Analysis charts (Part 1) valid 0000 UTC March 9 and 10, 2008. (Click to enlarge)
North Atlantic Storm, March 8-11: As high pressure shifted south and weakened over the south central waters, this developing storm originated farther south, passing northeast of the island of Newfoundland late on March 8th and then rapidly intensifying over the central and eastern waters as shown in Figure 11. The central pressure dropped 51 hPa in the twenty four hour period ending at 1800 UTC on the 9th, or more than 2 hPa per hour on average. The second part of Figure 11 shows the cyclone as it reached maximum intensity, 948 hPa or 27.99 inches. The satellite image in Figure 12 shows the cyclone approaching its most intense phase, with extensive cold-topped frontal cloud bands and a relatively cloud-free area wrapping almost all the way around a well defined center, common in intense cyclones. The high resolution QuikScat winds in Figure 13 reveal winds of 50 to 80 kts on the southwest and west sides of the well defined storm center and storm force winds even on the north and northeast sides. Some notable ship and buoy reports during the storm are listed in Table 5. The 18 meter seas reported at the buoy 62081 were the highest reported in the North Atlantic during the four month period. The cyclone crossed southern Great Britain on the 10th while maintaining hurricane force winds, before weakening while crossing the North Sea late on the 10th and early on the 11th.
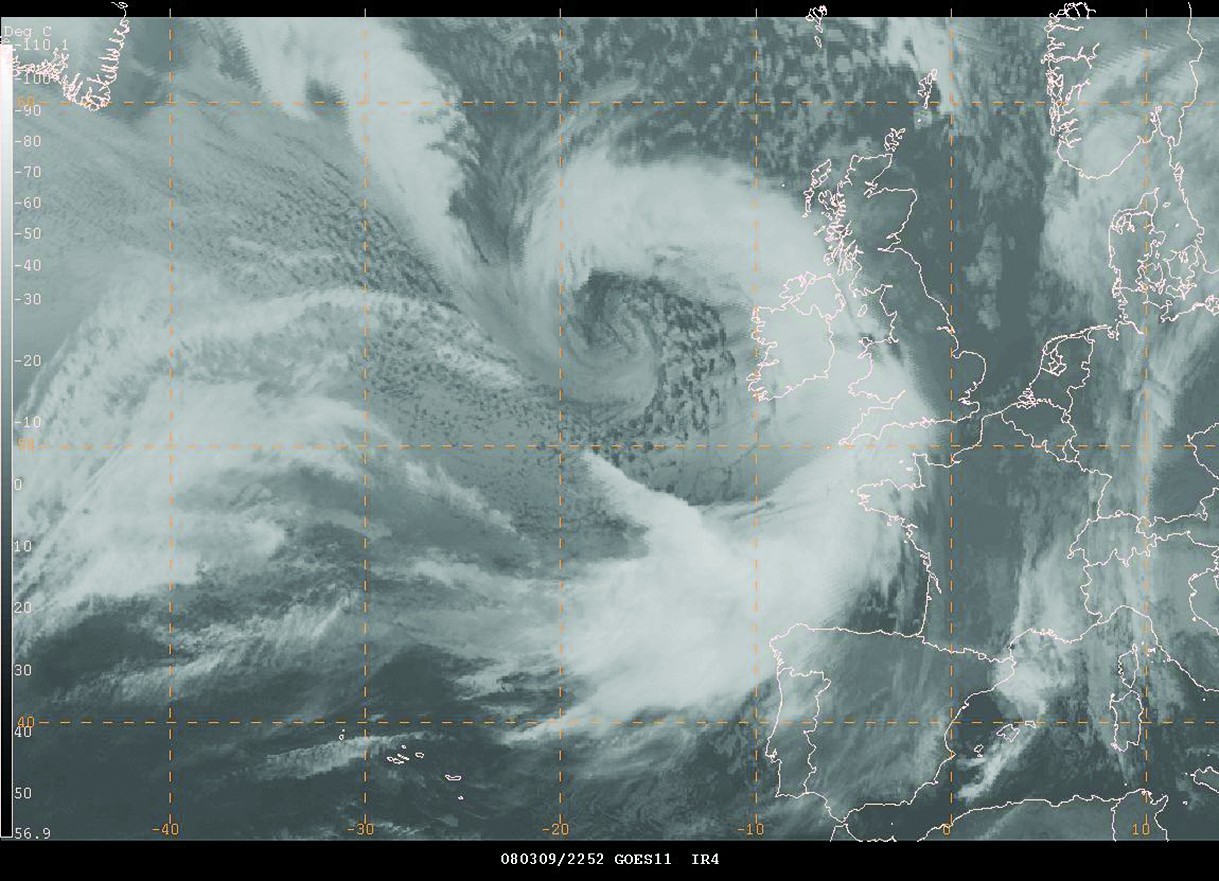
Figure 12. Global mosaic of infrared satellite imagery (mainly METEOSAT-9) valid 2252 UTC March 9, 2008, or about one hour prior to the valid time of the second part of Figure 11. Satellite senses temperature on a scale from black (warm) to white (cold) in this type of imagery.
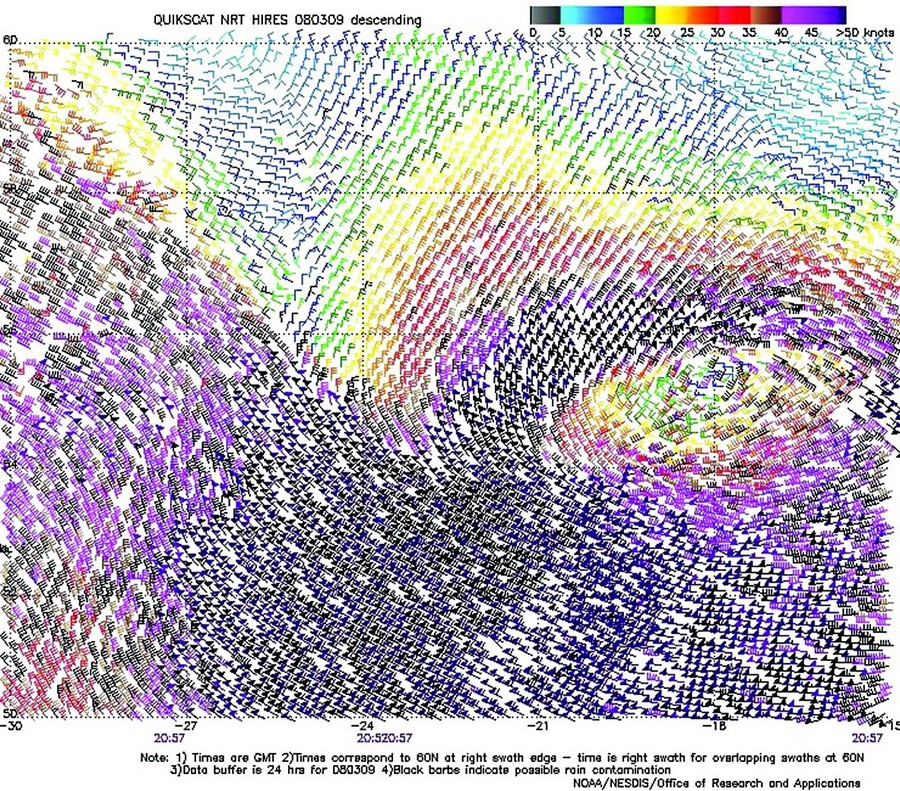
Figure 13. High resolution QuikScat
scatterometer image of satellite-sensed
winds around the storm shown in the
second part of Figure 11. The valid
time of the pass is 2057 UTC March 9,
2008, or about two and one-half hours
prior to the valid time of the second part
of Figure 11. The center of the cyclone
appears near 55N 18W in the rightcenter
portion of the image. Image is
courtesy of NOAA/NESDIS/Office of
Research and Applications. (Click to enlarge)
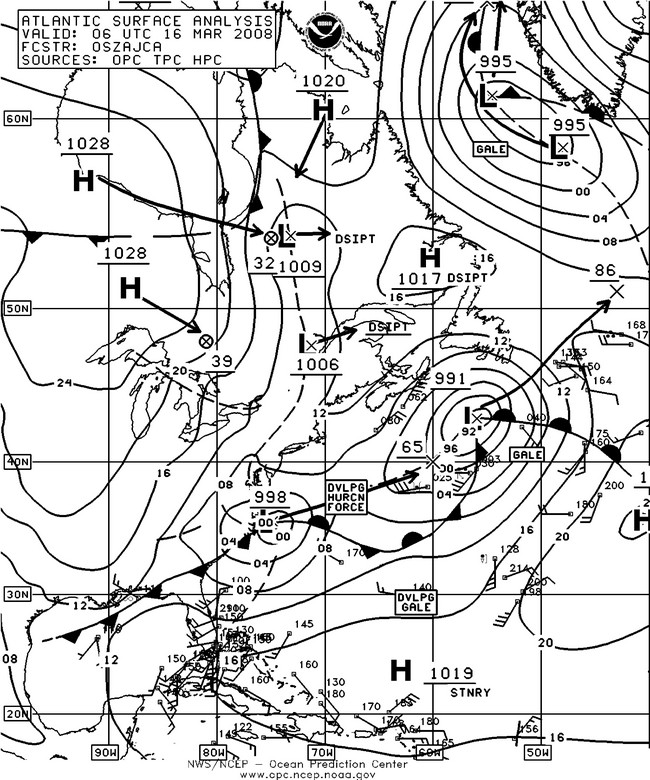
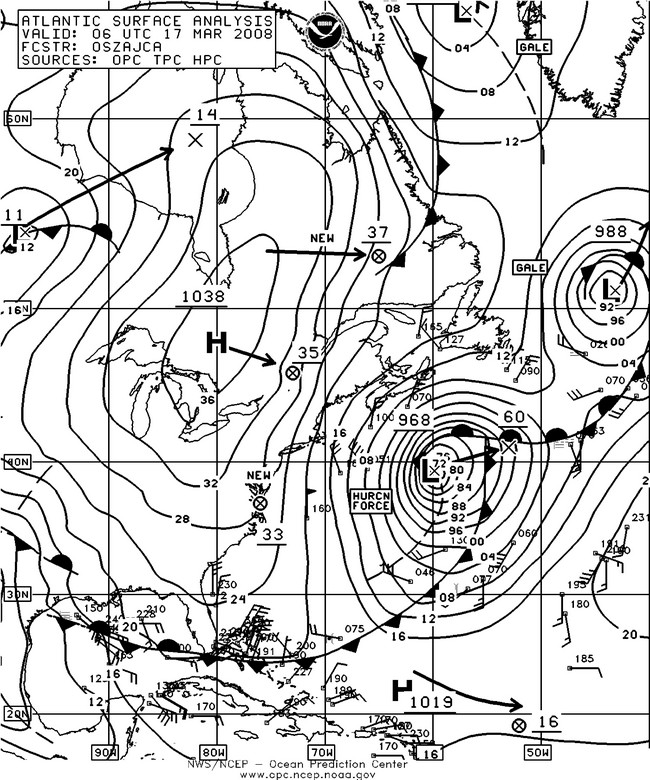
Figure 14. OPC North Atlantic Surface Analysis charts (Part 2) valid 0600 UTC March 16 and 17, 2008. (Click to enlarge)
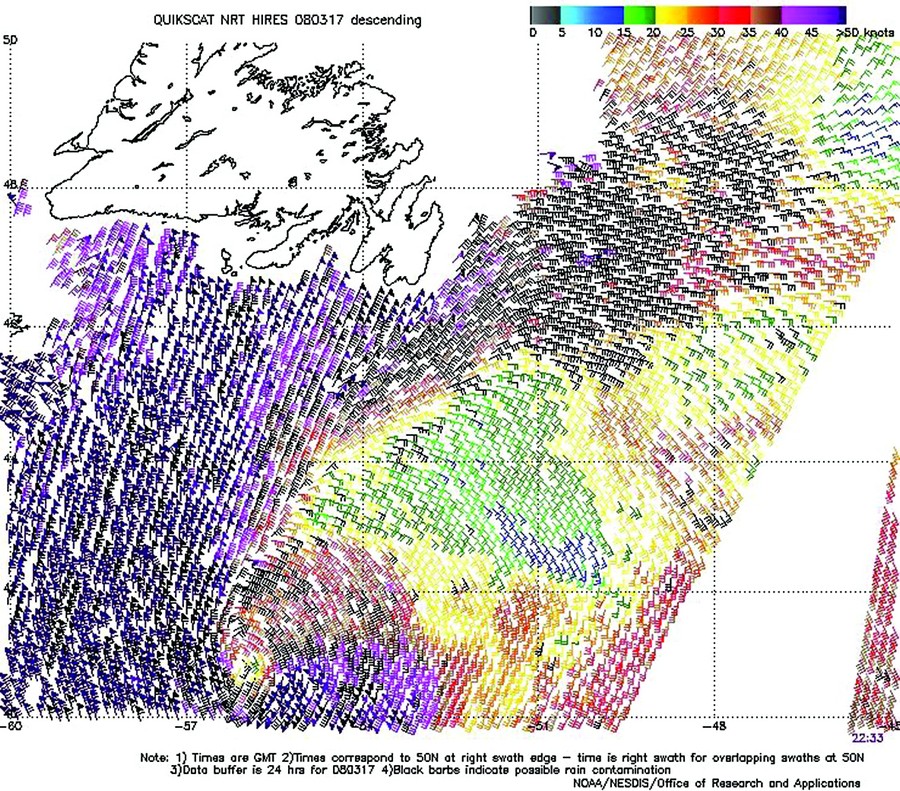
Figure 15. High resolution QuikScat
scatterometer image of satellite-sensed
winds around the storm shown in the
second part of Figure 14, valid 2233
UTC March 17, 2008. The valid time of
the pass is about sixteen and one-half
hours later than the valid time of the
second part of Figure 14. The center of
the storm appears near 41N 56W near
the lower left edge of the image. Image
is courtesy of NOAA/NESDIS/Office
of Research and Applications. (Click to enlarge)
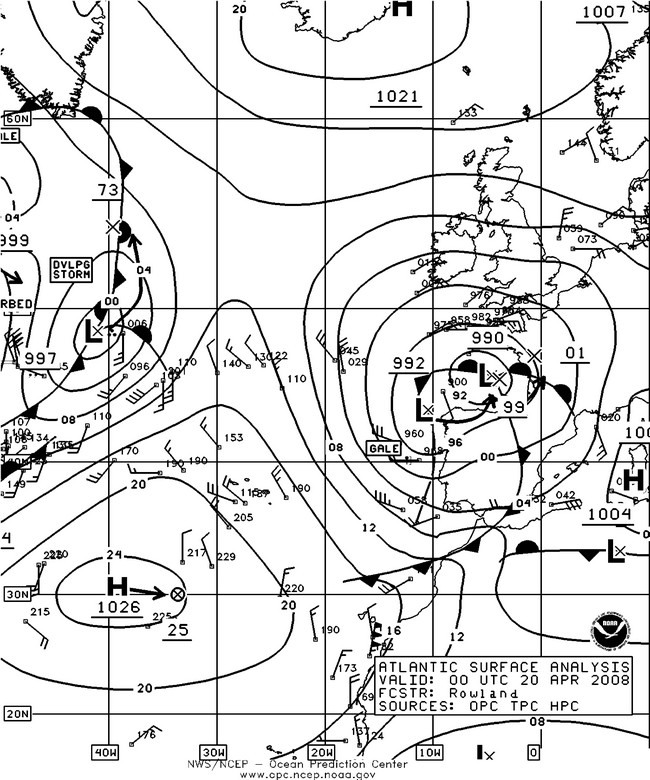
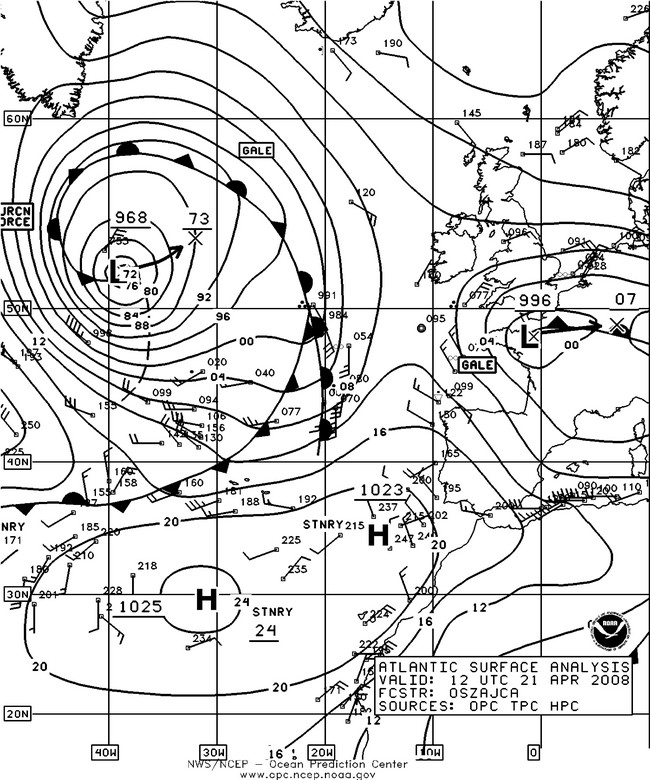
Figure 16. OPC North Atlantic Surface Analysis charts (Part 1) valid 0000 UTC April 20 and 1200 UTC April 21, 2008. (Click to enlarge)
North Atlantic Storm, March 9-12: Another hurricane force low, originating over the northeast U.S. early on the 9th, followed its intense predecessor the next day, developing west winds of 50 to 70 kts west of Ireland on the evening of the 11th just before the center crossed Scotland. The lowest central pressure was 960 hPa northwest of Ireland at 1200 UTC March 11. The center then crossed the North Sea and weakened, passing south of Norway on the 12th.
Southwestern North Atlantic Storm, March 16-19: The development of this storm over the southwest waters is depicted in Figure 14. A frontal wave of low pressure near Cape Hatteras deepened by 30 hPa in the twenty four hour period covered by Figure 14. The central pressure dropped to as low as 965 hPa six hours later when the center was at 40N 58W. This was the strongest system in this part of the Atlantic during the period. QuikScat high resolution imagery in Figure 15 reveals north winds up to 70 kts west and northwest of the well defined center. Table 6 lists selected conventional observations taken during the storm. The Grand Banks observations are from oil platforms. The cyclone subsequently drifted north and weakened to a multicentered gale force low pressure system near the island of Newfoundland on the 19th.
| Observation | Position | Date/Time (UTC) | wind (kts) | Seas (m/ft) |
|---|---|---|---|---|
| M/V Tanabata (WCZ5535) | 34N 47W | 18/0000 | S 52 | |
| Integrity (WDC6925) | 43N 46W | 18/0600 | SE 45 | |
| Unknown Ship (CFO383) | 43.9N 60.2W | 17/1800 | N 55 G64 | 4.0/13 |
| Hibernia (VEP717) | 46.7N 48.7W | 17/2100 | E 50 | |
| GSF Grand Banks (YJUF7) | 46.8N 48W | 18/0900 | SE 44 | |
| Buoy 44004 | 38.5N 70.2W | 17/1200 17/1800 18/1000 |
NW 31 G39 Peak gust 43 maximum |
4.5/15 7.5/25 |
| Buoy 44011 | 41.1N 66.6W | 17/1800 18/0300 |
N 33 G43 maximum | 6.5/21 7.5/25 |
| Buoy 44037 | 43.5N 67.9 | 17/1400 17/1300 |
N 29 G41 maximum | 3.0/10 3.5/11 |
| Buoy 44141 | 43.0N 58.0W | 18/0600 18/0300 18/0900 |
N 54 G66 Peak gust 68 maximum |
9.5/31 11.0/36 |
| Buoy 44150 | 42.5N 64W | 18/0300 | N 39 G51 | |
| Buoy 44137 | 42.2N 62.0W | 18/0300 18/1200 |
N 45 G58 maximum | 10.0/33 10.5/34 |
| Buoy 44139 | 44.2N 57.1W | 17/2200 18/0900 |
NE 47 G62 maximum | 9.0/30 10.5/34 |
North Atlantic Storm, March 25-29: A low pressure system south of Newfoundland redeveloped toward a northern low center late on March 25, with the new center moving rapidly northeast over the next two days, to 58N 18W with a 970 hpa center at 0000 UTC on the 28th. The cyclone briefly developed hurricane force winds between the center and Iceland early on the 28th as revealed in a high resolution scatterometer image, before looping southwest and then south. The cyclone then became a complex storm system in the northeast waters by the 29th, weakening to a gale force low moving into Great Britain on March 30. The ship London Express (DPLE) (61N 13W) reported east winds of 45 kts and 10.0 meter seas (33 feet) at 0900 UTC on the 28th. The buoy 44705 (51.3N 33.6W) reported a northwest wind of 40 kts at 0000 UTC on the 28th.
North Atlantic Storm, April 20-23: Figure 16shows the development of this hurricane force low as a secondary frontal development with the parent low center off the chart in the Labrador Sea. The second part of Figure shows the cyclone at maximum intensity. The high resolution QuikScat image in Figure 17 shows northwest winds to 65 kts southwest of the well defined low center and a band of east to northeast winds to gale force to the north of the center defining the front. The ship Timca (PHFL)(46N 41W) reported northwest winds of 45 kts and 7.0 meter seas (23 feet) at 1200 UTC on the 22nd, and six hours earlier a northwest wind of 35 kts with 9.0 meter seas (30 feet). The drifting buoy 44705 (52.3N 33.5W) reported southeast winds of 45 kts at 1000 UTC on the 20th. The cyclone then moved northeast and weakened to a gale late on the 23rd, before making a counterclockwise loop southeast of Greenland on the 25th. Dissipation followed over the central North Atlantic late on the 26th.
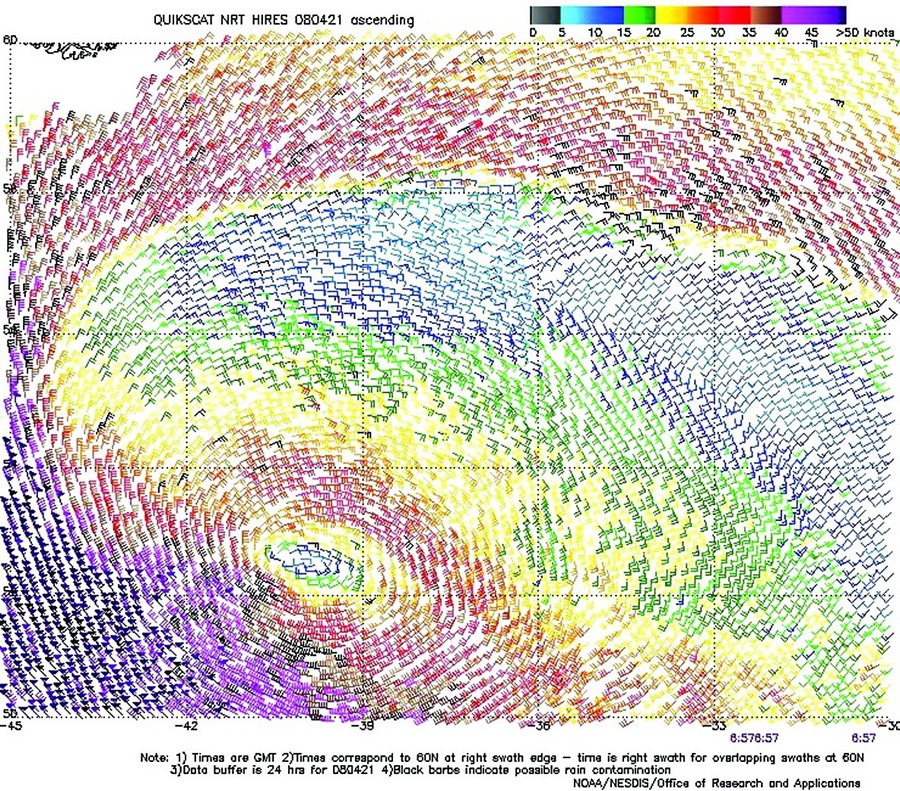
Figure 17. High resolution QuikScat
scatterometer image of satellite-sensed
winds around the storm in the second
part of Figure 16. The valid time of the
pass is 0657 UTC April 21, 2008, or
about five hours prior to the valid time
of the second part of Figure 16. The
center of the storm is near 52.5N 40W
in the lower left side of the image. The
southern tip of Greenland is near the
upper left corner. Image is courtesy of
NOAA/NESDIS/ Office of Research
and Applications.. (Click to enlarge)
References
Bancroft, George, Marine Weather Review, North Pacific Area, September to December 2007, Mariners Weather Log April 2008.
Joe Sienkiewicz and Lee Chesneau, Mariners Guide to the 500-Millibar Chart, Mariners Weather Log Winter 1995.
Back to top