Marine Weather Review—North Pacific Area
January through April 2006
By George P. Bancroft, NOAA National Center for Environmental Prediction
Introduction
The most active period for hurricane-force lows was January and the first half of February, when all but two of the hurricane-force storms during the four-month period occurred, with eleven in January alone. The 500 hPa chart for 0000 UTC January 2 (Figure 1) is typical of the upper air pattern that produced this activity, featuring strong flow across the Pacific with embedded short-wave troughs, including, in some cases, northern and southern troughs that reinforce each other. More information on use of the 500 hPa chart and the relationship of 500 hPa features to those at the surface may be found in Reference 1. In mid February the pattern changed, with the 500 hPa northern low replaced with a ridge, favoring some significant systems to move toward the Bering Sea or Kamchatka area with redevelopment toward the Gulf of Alaska and southeastward toward the west coast of the U.S. Other low-pressure systems became blocked and moved erratically or stalled. The two cyclones that produced hurricane-force winds in March and April tracked from the western Pacific northeast into the Bering Sea. Due to the sheer number of strong systems during these stormy months, this article focuses mainly on hurricane-force lows.
No tropical cyclones appeared in OPC’s oceanic chart area during this period. By comparison, there was a tropical storm and a typhoon in the waters south of Japan in the same four-month period of 2005.
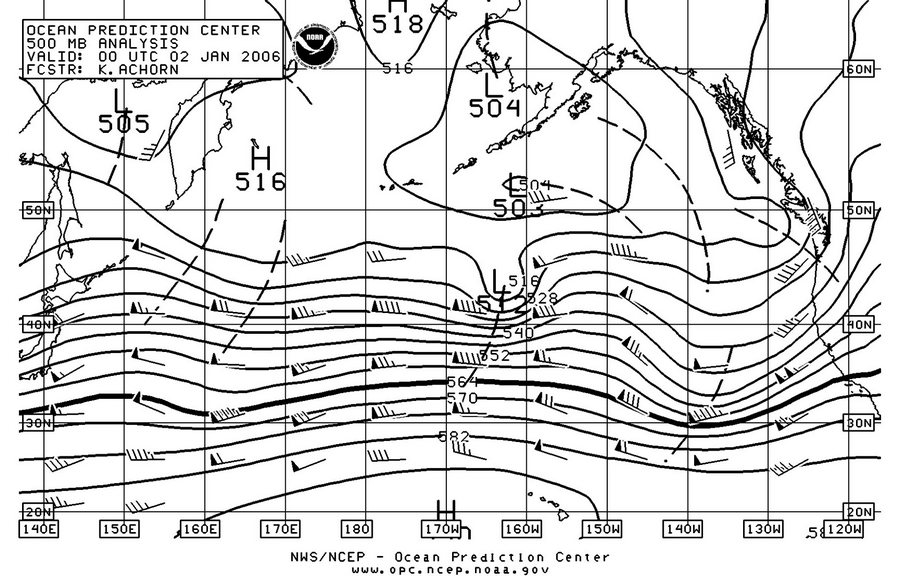
Figure 1. OPC North Pacific 500-MB Analysis valid 0000 UTC January 2, 2006. This chart is computer-generated, with short-wave troughs (dashed lines) manually added.
Significant Events of the Period
Northeast Pacific Storm, January 1-2: The period started out very active, with two hurricane-force lows occurring at the same time with more soon to follow. Figure 2 shows one of these at maximum intensity affecting the waters off the Pacific Northwest coast. As the storm center passed north of the buoy 46002 (42.6N 130.4W), the wind at the buoy reached 41 kts with gusts to 76 kts from the southwest at 0700 UTC January 1. Buoy 46015 (42.7N 124.8W) near the coast reported south winds of 45 kts with gusts to 56 kts and 7.5 m seas (25 ft) at 1400 UTC January 1, followed one hour later by peak gusts of 60 kts and seas of 8.0 m (26 ft). The Destruction Island C/MAN (DESW1) off the Washington coast reported southeast winds of 49 kts with gusts to 59 kts, and a peak gust 70 kts, at 2300 UTC January 1. The storm subsequently moved north, weakened, and dissipated over Southeast Alaska late on the 2nd.
Central Pacific Storm, January 1-4: This compact system is shown in Figure 2 south of the central Aleutians. It had deepened rapidly, by 21 hPa, in the preceding twelve hours. The central pressure bottomed out at 966 hPa twenty-four hours later, and the system maintained hurricane-force winds for about 36 hours. Ship reports in the area had winds of 45 kts or less. The President Polk (WRYD) reported a northwest wind of 45 kts and 8.0 m seas (27 ft) near 46N 151W at 1800 UTC January 2, while the Mokihana (WNRD) observed southeast winds of 40 kts and 9.0 m seas (30 ft) near 47N 144W. A quikscat pass at about 1530 UTC January 1 (Figure 3) reveals a compact but potent circulation with wind barbs of 80 kts south of the center. The cyclone turned more north and slowed upon reaching 145W late on the 2nd, before looping back to the west (Figure 4) and becoming absorbed by the next eastern North Pacific storm described below.
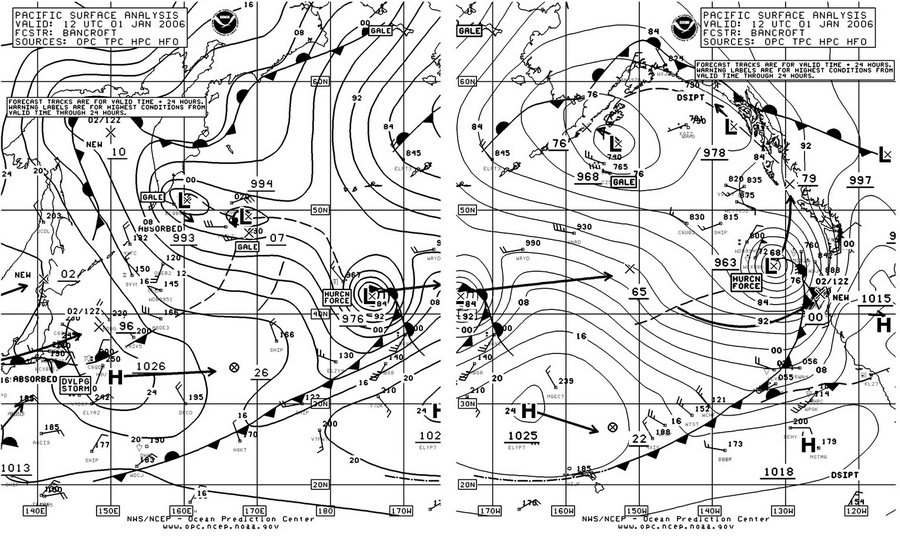
Figure 2. OPC Nort Pacific Surface Analysis charts (Parts 1 and 2) valid 1200 UTC January 1, 2006
Northwest Pacific Storm of January 2-4: This cyclone formed, like so many others, near Japan early on January 2 and moved northeast while rapidly intensifying. The central pressure fell 39 hPa in the twenty-four hour period ending at 1200 UTC January 3, when the center was near 45N 152E with a 958 hPa pressure. Figure 4 depicts the storm at maximum intensity with a 954 hPa central pressure six hours later. A high-resolution quikscat pass from 0817 UTC January 3 (Figure 5) reveals winds to 65 kts south of the center in the lower left side of the image, and a larger swath of 50 to as much as 65 kts in the southeast flow ahead of the storm’s frontal system. The ship Westwood Anette (C6QO9) (48N 152E) encountered northeast winds of 55 kts at 0000 UTC on the 4th. The storm then drifted northeast and weakened near the Kamchatka Peninsula by the 5th.
Eastern North Pacific Storm, January 3-5: This development appears on Figure 4 as the 995 hPa frontal low-pressure wave near 32N 151W that is forecast to develop hurricane-force winds within 24 hours as it moves northeast while rapidly intensifying. The central pressure bottomed out at 964 hPa as the center moved to 42N 140W twenty-four hours later. The central pressure fell 39 hPa in the twenty-four hour period ending at 1200 UTC January 4. A quikscat image from about 0600 UTC on the 4th, or twelve hours after the valid time of Figure 4, revealed a compact circulation similar to that of Figure 3, with winds to 80 kts south of the center. The ship A8CF4 (29N 155W) reported west winds of 50 kts at 1800 UTC on the 3rd. The system weakened beginning later on the 4th while moving northeast, before turning northwest and weakening to a gale in the Gulf of Alaska on the 5th. Dissipation followed later on the 7th near the Alaskan coast.
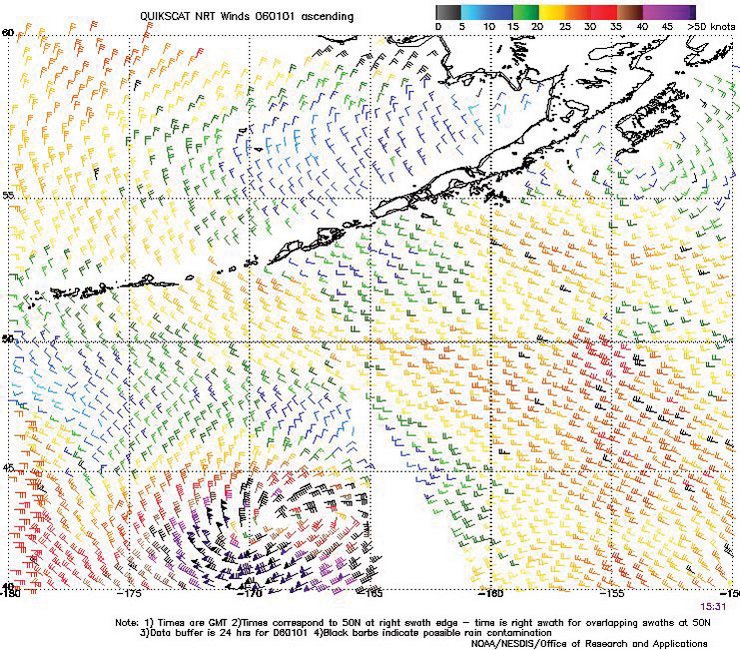
Figure 3. QuikScat scatterometer image of satellite-sensed winds around the central North Pacific storm shown in Figure 2, valid at 1531 UTC January 1, 2006, or about three and one-half hours later than the valid time of Figure 2. The resolution is 25 km. Image is courtesy of NOAA/NESDIS /Office of Research and Applications.
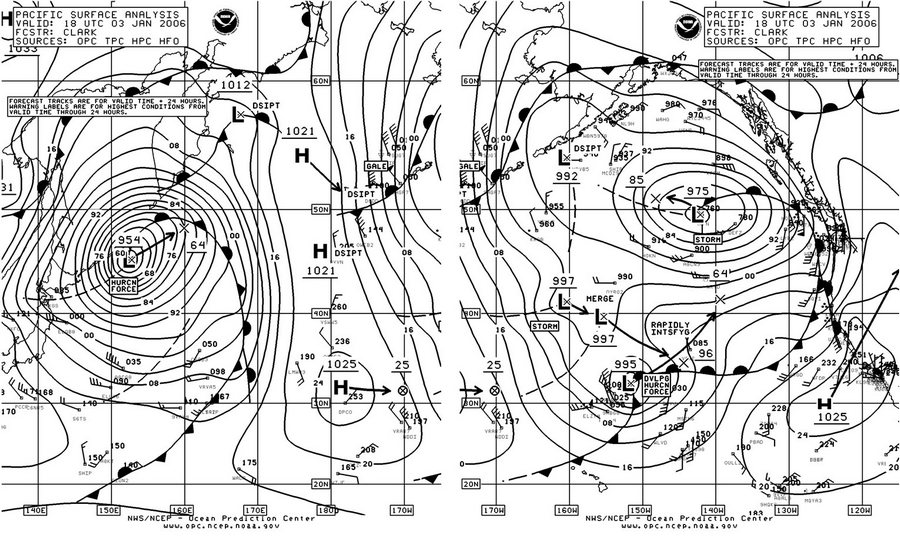
Figure 4. OPC North Pacific Surface Analysis charts (Parts 1 and 2) valid 1800 UTC January 3, 2006.
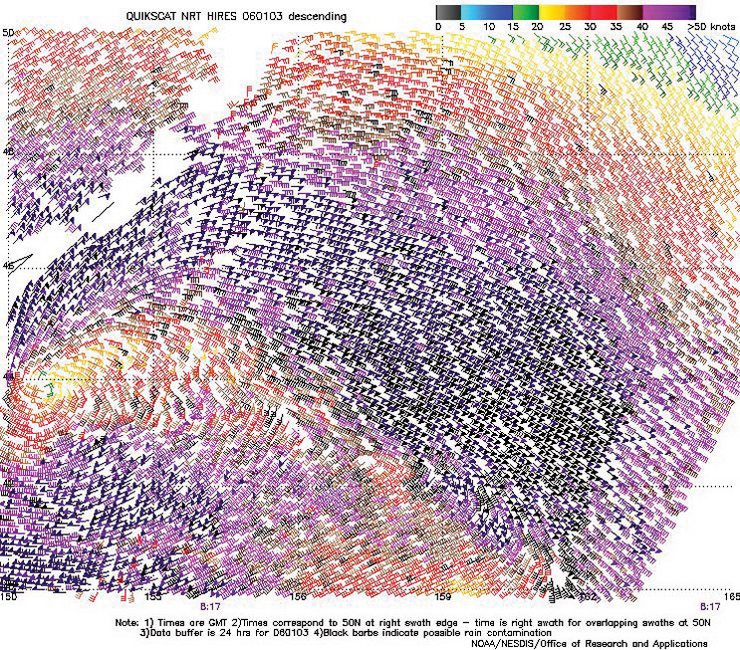
Figure 5. High-resolution QuikScat scatterometer image of satellite-sensed winds around the western storm shown in Figure 4. The resolution is 12.5 km, versus 25 km in the coarser-resolution version of QuikScat imagery. The valid time of the pass is 0817 UTC January 3, 2006, or about ten hours prior to the valid time of the second part of Figure 4. Image is courtesy of NOAA/NESDIS/ Office of Research and Applications.
Western North Pacific Storm, January 6-9: Figure 6 depicts the development of this storm, with the central pressure dropping an impressive 33 hPa in twenty-four hours. The storm is shown at maximum intensity, 965 hPa, in the second part of Figure 6. The high-resolution quikscat data in Figure 7 from 1935 UTC January 7 reveal winds to 70 kts west and especially south of the well-defined center in an area lacking in ship reports. The ship Sealand Comet (WDB9950) (40N 153E) reported north winds of 40 kts and 9.5 m seas (31 ft) at 1800 UTC on the 7th. The cyclone maintained hurricane-force winds through 1200 UTC on the 8th and began to weaken. Later on the 8th, the storm, near 44N 171E elongated east-northeast with multiple centers, with a lead low center moving to Vancouver Island as a gale late on the 10th.
Western North Pacific Storm, January 15-16: This developing storm moved northeast from near Tokyo early on January 14, with the first part of Figure 8 showing the storm at maximum intensity with a central pressure of 968 hPa. A vessel with the SHIP callsign near 45N 162E reported northeast winds of 50 kts and 8.0 m seas (26 ft). A high-resolution quikscat pass from 0740 UTC on the 16th showed the strongest winds 65 to as high as 80 kts southwest of the center. The system weakened to a gale south of the Aleutians early on the 17th and then continued east-northeast, dissipating north of Vancouver Island by the 20th.
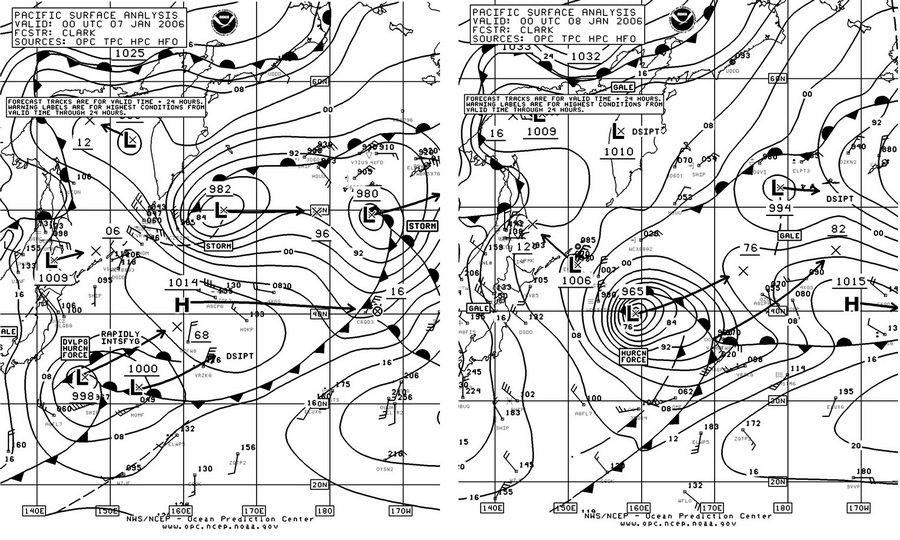
Figure 6. OPC North Pacific Surface Analysis charts (Part 2 - west) valid 0000 UTC January 7 and 8, 2006.
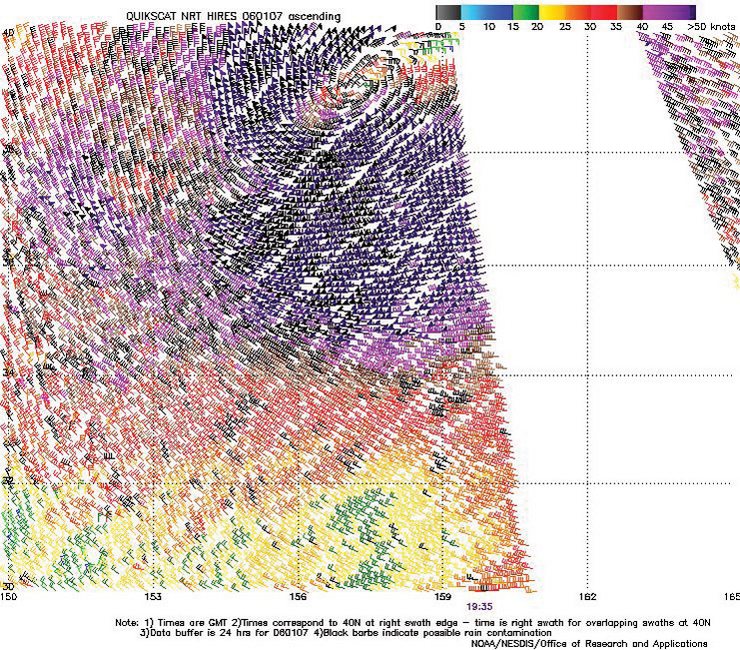
Figure 7. High-resolution QuikScat scatterometer image of satellite-sensed winds primarily around the west and south sides of the storm shown in Figure 6. The valid time of the pass is 1935 UTC January 7, 2006, or about four and one-half hours prior to the valid time of the second part of Figure 6. The center of the storm is apparent near the upper edge of the figure near 39N 157E. Image is courtesy of NOAA/NESDIS/ Office of Research and Applications.
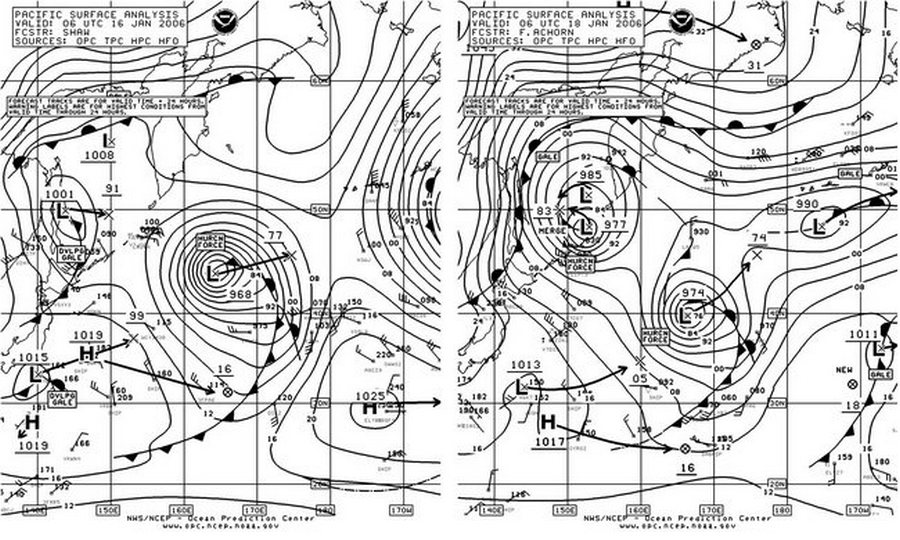
Figure 8. OPC North Pacific Surface Analysis charts (Part 2) valid 0600 UTC January 16 and 18, 2006.
Western North Pacific Storm of January 17-19: This storm originated as a weak low-pressure wave south of Japan at 0600 UTC January 16 (Figure 8) and moved northeast, with the central pressure falling 27 hPa in the twenty-four hour period ending at 0000 UTC on the 18th. The second part of Figure 8 shows the storm near 40N 167E near maximum intensity, with a relatively compact appearance. An infrared satellite image valid at the same time (Figure 9) shows a well developed comma cloud formation with the cold cloud tops indicating considerable vertical extent of the system. Also clouds, a dry slot wrap around a well defined center, and convective clouds south and west of the center indicate unstable conditions and stronger winds. The high-resolution quikscat image from 1836 UTC on the 17th (Figure 10) reveals winds up to 75 kts south and west of the center, which is likely over relatively warm water. The stronger winds near the east edge may be associated with the front and may be unreliable due to rain contamination. The ship YM Ibiza (DGKV) (36N 162E) reported south winds of 60 kts and 9.0 m seas (29 ft) at 1500 UTC January 17. A weakening trend began early on the 18th as the system headed northeast and elongated toward the Gulf of Alaska, with dissipation near the Alaska coast on the 21st.
Northwest Pacific Storm of January 17-19: The low near Sakhalin Island in the first part of Figure 8 moved to the northern Kurile Islands on the 17th, where it slowed and looped back to the southwest while intensifying to a hurricane-force low briefly as in the second part of Figure 8. The President Polk (WRYD) reported a west wind of 65 kts and 13.5 m seas (44 ft) near 47N 152E at 0600 UTC January 18. The cyclone then lingered near the Kuriles and weakened to a gale on the 19th, before dissipating just north of Japan by the 21st.
Western North Pacific Storm, January 21-24: Figure 11 depicts the rapid development of this storm over a twenty-four hour period, during which the central pressure fell 38 hPa. The lowest central pressure of 952 hPa reached at 1800 UTC on the 22nd made this cyclone the most intense of the period in the North Pacific. The abundant reports of high winds and seas from ships are listed below in Table 1. The cyclone drifted north and began to weaken on the 23rd, and then looped northwest and then southeast near the northern Kurile Islands and weakened to a gale late on the 24th, before moving southwest and dissipating east of northern Japan on January 28.
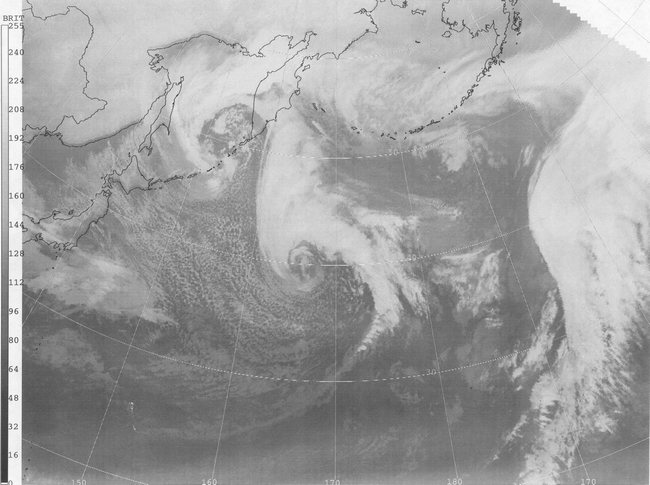
Figure 9. GMS-MTR infrared satellite image of the storm in Figure 8 valid at 0600 UTC January 18, 2006. Satellite senses temperature on a scale from black (warm) to white (cold) in this type of image. The valid time is the same as that of the second part of Figure 8.
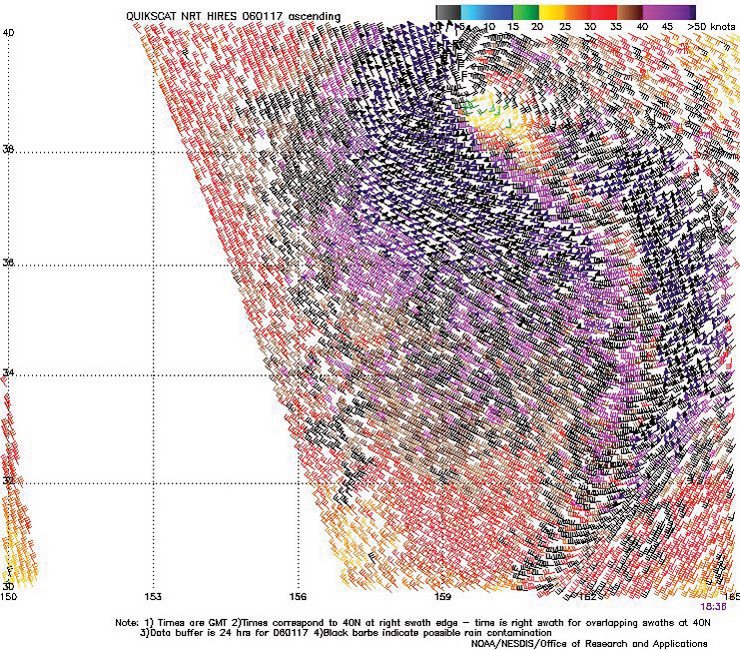
Figure 10. High-resolution QuikScat scatterometer image of satellite-sensed winds around the southern storm shown in the second part of Figure 8. The valid time of the pass is 1836 UTC January 17, 2006, or about eleven and one-half hours prior to the valid time of the second part of Figure 8. The center of the storm is apparent in the upper portion of the figure near 39N 159E. Image is courtesy of NOAA/NESDIS/ Office of Research and Applications.
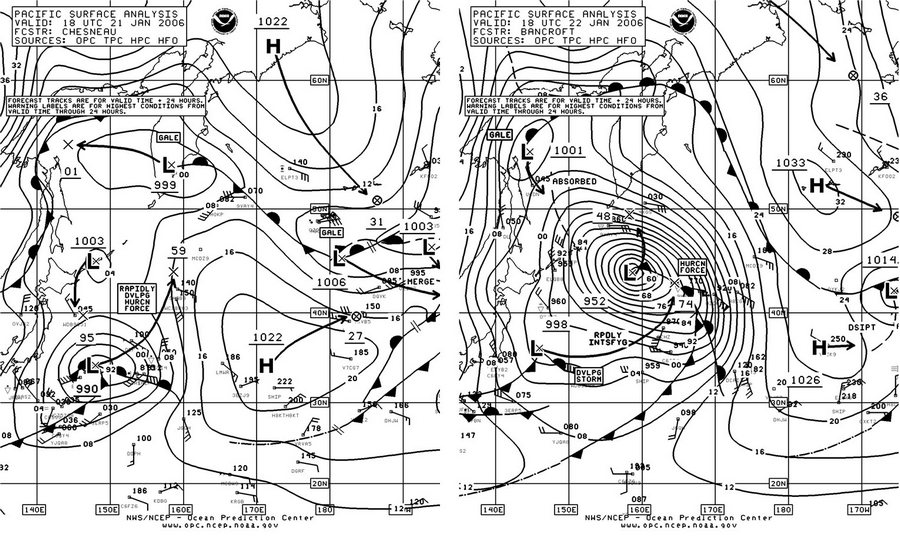
Figure 11. OPC North Pacific Surface Analysis charts (Part 2) valid 1800 UTC January 21 and 22, 2006.
North Pacific Storm of January 28-31: A developing frontal wave of low pressure passed southeast of Japan early on the 27th before turning more northeast on the 28th and rapidly intensifying. The center reached 43N 173E with a 966 hPa pressure at 1200 UTC on the 29th, after deepening by 31 hPa in the preceding twenty-four hours. OPC classified this cyclone as a hurricane-force low briefly, from 1200 UTC to 1800 UTC on the 29th. The center then redeveloped east-northeast under the influence of blocking to the northwest and moved into Southeast Alaska late on the 31st.
North Pacific Storm, February 1-4: Figure 12 captures the initial rapid development of this storm. The central pressure dropped 44 hPa in the twenty-four hour period ending at 0000 UTC February 2, and the lowest pressure of 962 hPa came twelve hours later at 1200 UTC on February 2. The cyclone then tracked east northeast and did not begin weakening until early on the 3rd. A quikscat pass from 0840 UTC February 2, or close to the time of the second part of Figure 12, showed winds to 70 kts southwest of the center and looked similar to Figure 10. Twelve hours later quikscat data showed that winds had shifted to south of the center and speeds were as high as 75 kts. This event was notable in that the hurricane-force winds lasted about 48 hours, when twelve hours or less is more common. Some ship reports from the storm are listed in Table 2. The cyclone moved into the southeast Bering Sea as a gale late on the 4th, stalled and dissipated by the 6th.
| OBSERVATION | POSITION | DATE/TIME(UTC) | WIND(kts) | SEAS(m/ft) |
|---|---|---|---|---|
| Zim America (9HAB8) | 42N 164.5E | 22/1200 | E 60 | 10.5/35 |
| 42.6N 166E | 22/1800 | E 56 | ||
| Kaga (JRES) | 42N 162E | 22/1200 | SE 55 | 7.5/25 |
| Sine Maersk (OZOK2) | 42N 170E | 22/1800 | SE 74 | |
| APL Korea | 44N 171E | 22/1700 | SE 75 | |
| APL Korea (WCX8883) | 47N 175E | 23/0600 | SE 65 | 10.5/34 |
| 48N 177E | 23/1200 | S 50 | 17.5/57 | |
| CSX Spirit (WFLG) | 40N 174E | 23/0000 | S 45 | 11.5/38 |
| Zim Canada (4XGS) | 49N 156E | 23/0600 | NE 50 | 10.5/34 |
Table 1. Some ship observations taken during storm of January 21-24.
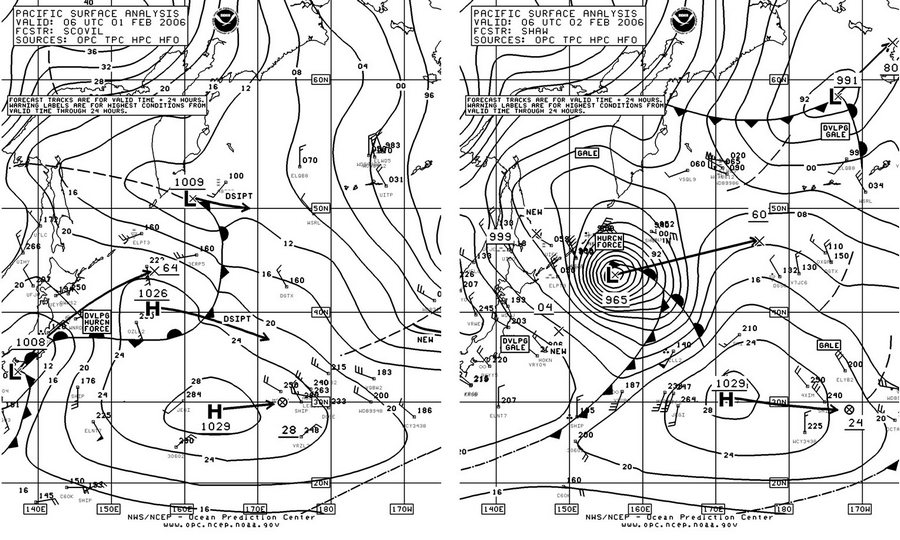
Figure 12. OPC North Pacific Surface Analysis charts (Part 2) valid 0600 UTC February 1 and 2, 2006.
| OBSERVATION | POSITION | DATE/TIME(UTC) | WIND(kts) | SEAS(m/ft) |
|---|---|---|---|---|
| Mokihana (WNRD) | 42N 149E | 1/1800 | N 60 | 7.0/23 |
| Hanjin Ottawa (DANM) | 44.6N 150E | 2/0900 | NW 50 | 8.5/28 |
| 43N 148E | 2/1500 | W 60 | ||
| Polar Eagle (ELPT3) | 42N 147E | 2/1500 | W 50 | |
| APL Canada (A8CG6) | 46N 152E | 2/1200 | NW 50 | 5.5/18 |
Table 2. Some ship observations taken during storm of February 1-4.
Northeast Pacific Storm of February 2-4: The development of this storm from a frontal wave of low pressure is depicted in Figure 13. The track was similar to that of the January 1-2 event. The central pressure dropped 34 hPa in the twenty-four hour period ending at 1800 UTC on the 3rd, when the lowest central pressure of 970 hPa was reached. Selected observations taken during the storm from buoys, ships and coastal automated stations are listed in Table 3. This storm is most noteworthy for several reports of seas higher than 12 m (40 ft), even at Buoy 46050 that is near the Oregon coast. The storm subsequently moved inland on the 4th.
North Pacific and Bering Sea Storm, February 12-14: An eastern Pacific high strengthened by the middle of February developed lows coming off Japan and began to turn more north into the Bering Sea. The developing storm in Figure 14 came off Japan early on February 11 and rapidly deepened, especially in the twenty-four hour period ending at 0000 UTC February 13 when the central pressure fell 32 hPa. The cyclone is shown at maximum intensity (956 hPa) in the second part of Figure 14, as the center turned north near the dateline. A high-resolution quikscat pass from 1658 UTC on the 13th (Figure 15) reveals winds up to 65 kts mainly ahead of the cold front east of the center, unlike in prior storms previously dealt with. Winds decreased to below hurricane force as the center moved into the Bering Sea early on the 14th. At 0000 UTC on the 14th the ship Green Dale (WCZ5238) (53N 168W) reported south winds of 50 kts. Two hours later the buoy 46072 (51.6N 172.2W) reported south winds of 35 kts and seas up to 9.5 m (31 ft). The system then weakened while redeveloping northward in the Bering Sea and moved inland over Russia late on the 14th.
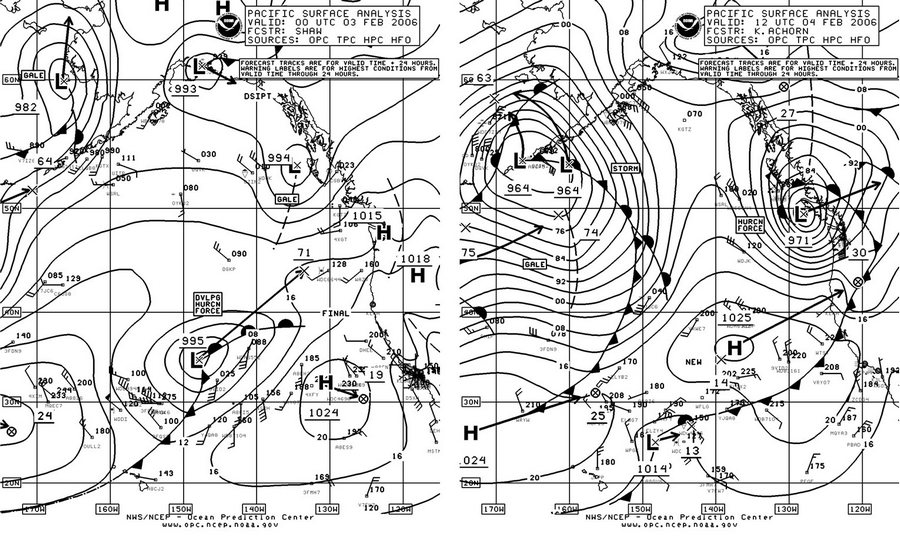
Figure 13. OPC North Pacific Surface Analysis charts (Part 1 - east) valid 0000 UTC February 3 and 1200 UTC February 4, 2006.
| OBSERVATION | POSITION | DATE/TIME(UTC) | WIND(kts) | SEAS(m/ft) |
|---|---|---|---|---|
| Horizon Tacoma (KGTY) | 48.5N 125.7W | 4/1800 | W 70 | 13.5/45 |
| Liberty Star (WCBP) | 41N 134W | 3/2200 | SW 60 | 17.5/57 |
| 40N 135W | 4/0600 | W 40 | 14.5/47 | |
| Tatoosh (TTIW1) | 48.9N 124.6W | 4/1200 | S 60 | |
| Buoy 46002 | 42.6N 130.4W | 4/0400 | W 45 | 10.5/35 |
| 4/0300 | maximum 12.0/40 | |||
| Buoy 46006 | 41N 138W | 3/1900 | W 50 | 8.0/26 |
| 3/2300 | maximum 9.5/31 | |||
| Buoy 46050 | 44.6N 124.5W | 4/1400 | SW 35 | 12.5/41 |
Table 3. Some ship observations taken during storm of February 2-4. Maximum seas refer to the highest significant wave height, or the average height of the highest one-third of waves.
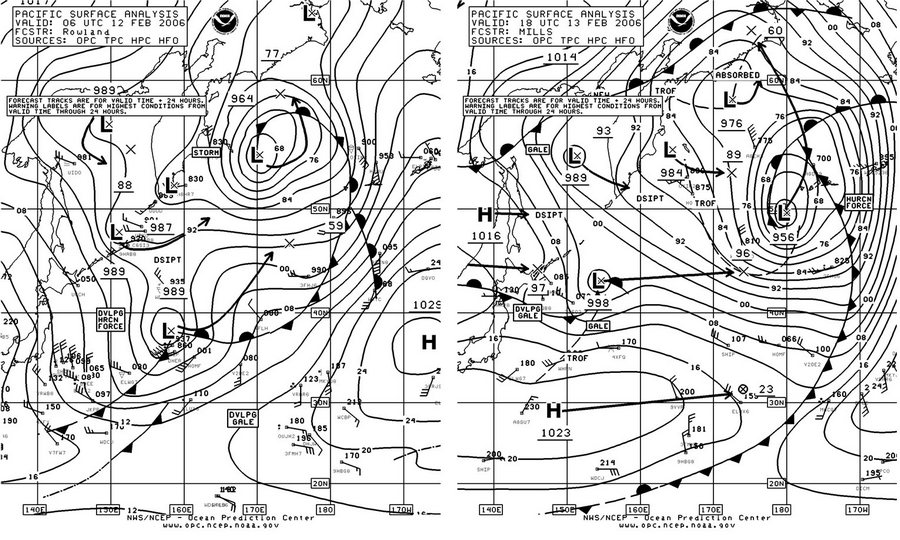
Figure 14. OPC North Pacific Surface Analysis charts (Part 2) valid 0600 UTC February 12 and 1800 UTC February 13, 2006.
Bering Sea Storm, March 15-17: This developing storm followed a track similar to and slightly west of that of the mid-February event and was almost as intense, but the main intensification into a hurricane-force storm occurred as the cyclone crossed the western Aleutians. The central pressure lowered from 990 hPa (near 44N 167E) to 958 hPa (near 53N 177E) in the twenty-four hour period ending at 1200 UTC on the 16th, a drop of 32 hPa. A high-resolution quikscat pass indicated winds up to minimal hurricane force southeast and north of the center as it was crossing the western Aleutians. Some ship and buoy observations taken in the storm are listed in Table 4. Also, unlike the mid-February storm, this cyclone subsequently turned east toward Alaska and dissipated in the northeast Bering Sea on the 18th.
Western North Pacific and Bering Sea Storm of April 4-7: A rapidly developing storm moved east of Japan at 0600 UTC April 5 already with a 994 hPa central pressure, and deepened to a hurricane-force storm twelve hours later. Figure 16 depicts the subsequent motion and intensification of this system over a thirty-six hour period in which the cyclone maintained hurricane-force winds. The second part of Figure 16 shows the storm at maximum intensity over the far western Aleutians. The compact appearance of the storm in the first part of Figure 16 is also reflected in the high-resolution quikscat pass two hours later (Figure 17) which has hurricane-force wind barbs, up to 80 kts, within 60 to 120 nmi south and west of the center. At 1800 UTC on the 7th the ship Bosporus Bridge (3FMV3) (50N 162E) reported north winds of 60 kts. Buoy 46072 (51.6N 172.2W) reported southwest winds of 25 kts but 11.0 m seas (36 ft) at 2200 UTC April 7. The Vincent Thomas Bridge (H3WJ) (54N 176W) encountered southwest winds of 45 kts and 11.5 m seas (37 ft). The cyclone continued on a northeastward track and weakened to a gale in the central Bering Sea late on the 7th and then moved inland over mainland Alaska late on the 9th.
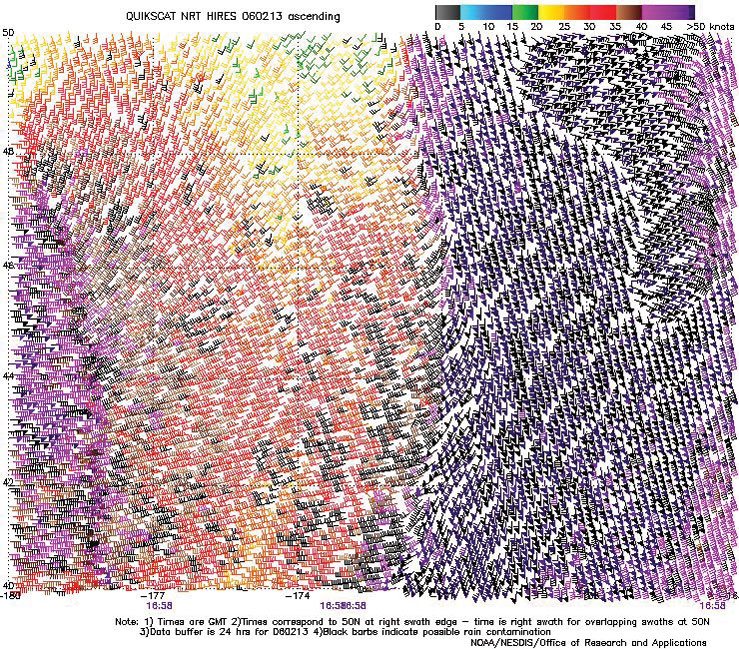
Figure 15. High-resolution QuikScat scatterometer image of satellite-sensed winds around the southeast side of the storm shown in the second part of Figure 14. The valid time of the pass is 1658 UTC February 13, 2006, or about one hour prior to the valid time of the second part of Figure 14. The wind directions near the lower left edge of the image are erroneous. Image is courtesy of NOAA/NESDIS/ Office of Research and Applications.
| OBSERVATION | POSITION | DATE/TIME(UTC) | WIND(kts) | SEAS(m/ft) |
|---|---|---|---|---|
| Sealand Intrepid (WDB9949) | 54N 173E | 16/0600 | NE 45 | 6.5/21 |
| Skaubryn (LAJV4) | 54N 167E | 16/1500 | NE 50 | |
| Bering Leader (WDC7227) | 59N 178W | 16/1700 | NE 55 | 8.0/27 |
| APL Philippines WCX8884 | 53N 168E | 17/0000 | NW 40 | 8.5/28 |
| Buoy 46071 | 51.2N 179.2E | 16/1000 | SW 45 | 9.0/30 |
| 16/2300 | SW 35 | 10.5/35 | ||
| Buoy 46072 | 51.6N 172.2W | 17/1300 | SW 30 | 10.5/34 |
Table 4. Selected ship and buoy observations taken in the storm of March 15-17.
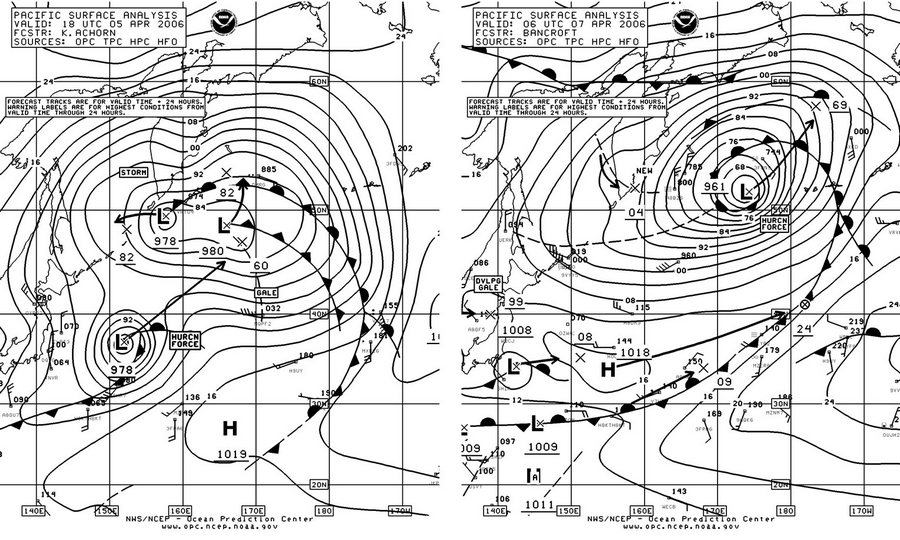
Figure 16. OPC North Pacific Surface Analysis charts (Part 2) valid 1800 UTC April 5 and 0600 UTC April 7, 2006.
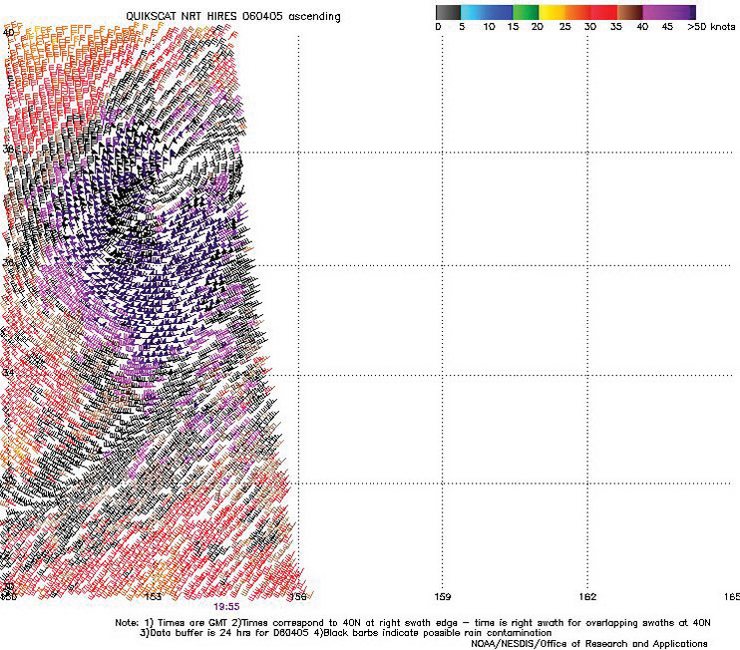
Figure 17. High-resolution QuikScat scatterometer image of satellite-sensed winds around the storm shown in the second part of Figure 16. The valid time of the pass is 1955 UTC April 5, 2005, or about two hours later than the valid time of the first part of Figure 16. The center of the storm is apparent near 38N 153E. Image is courtesy of NOAA/NESDIS/ Office of Research and Applications.
Bering Sea Storm, April 14-17: This developing storm followed a track similar to that of the early April event, originating as a frontal wave of low pressure east of Japan on the 13th and becoming a large storm in the central Bering Sea with a 970 hPa central pressure at 1200 UTC on the 16th. The winds did not quite reach hurricane force, but seas were quite high tensity. The ship Sicilia (9HCP7) (52N 170W) reported northwest winds of 50 kts and 17.0 m seas (56 ft) at 0000 UTC on the 17th, although the author is unsure of the reliability of that report. The buoy 46035 (57.1N 177.5W) reported west winds of 50 kts and 7.5 m seas (25 ft) at 1800 UTC on the 16th with a maximum significant wave height of 11.0 m (36 ft) four hours later. The strongest wind reported was a west wind of 60 kts from the Corbin Foss (WDB5265) (52N 177W) at 1800 UTC April 16. The cyclone subsequently turned southeast into the Gulf of Alaska as a gale on the 18th in response to building high pressure behind the departing low.
Reference
1 Sienkiewicz, J. and Chesneau, L., Mariner’s Guide to the 500-Mb Chart (Mariners Weather Log, Winter 1995).