Marine Weather Review—North Atlantic Area
January through April 2006
By George P. Bancroft, NOAA National Center for Environmental Prediction
Introduction
This period covers the stormy mid-winter to early spring period, which featured 19 low-pressure systems developing hurricane-force winds, all of them occurring in the months of January through March. The most active period came late in February and in early March, when strong blocking in the eastern Atlantic concentrated strong cyclonic activity over the western North Atlantic. Due to frequent blocking in the eastern Atlantic or at high latitudes, only one hurricane-force storm passed near western Europe early in January. There was no tropical activity during this period, which is well outside the hurricane season, although tropical cyclones have been known to occur in the past on rare occasions.
Significant Events of the Period
Northeast Atlantic Storm of January 9-11: This system was the stronger of two hurricane-force lows that developed in close succession over the northern Atlantic waters. The development of the first is shown in Figure 1 as a frontal wave of low pressure that rapidly intensified to become the 947 hPa (27.96 in) hurricane-force low passing between Great Britain and Iceland by early on the 11th. This was the deepest low of the period (in terms of central pressure) not only in the North Atlantic but for both oceans. The central pressure dropped an impressive 54 hPa in the twenty-four hour period ending at 1800 UTC January 10, a rate of more than 2 hPa per hour, and the highest deepening rate for any cyclone during this four-month period in both oceans. The cyclone produced hurricane-force winds from north of the British Isles to the Norwegian Sea from late on the 10th to the 11th as the storm passed north through the area, as revealed by the winds to 75 kts appearing on the quikscat image of Figure 2. The cyclone appears with a well-formed cloud spiral in the infrared satellite image of the storm near maximum intensity (Figure 3).
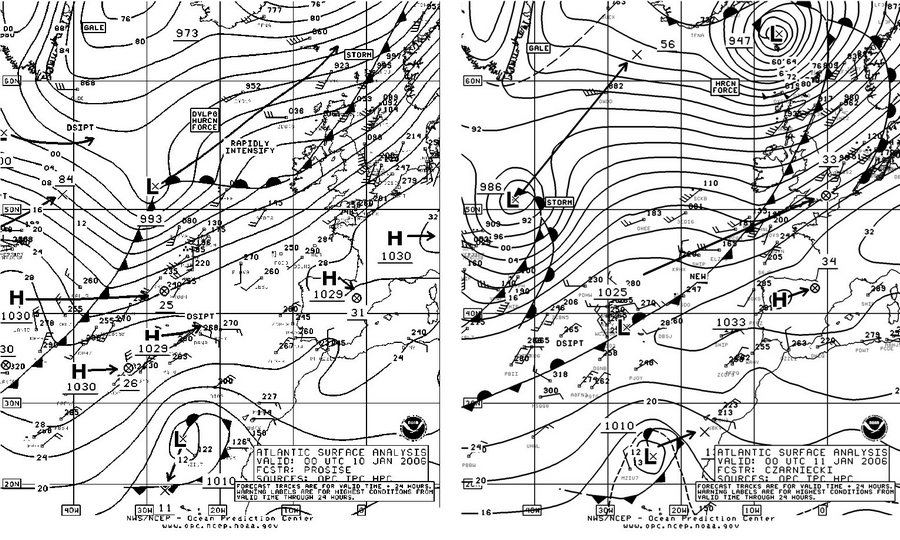
Figure 1. OPC North Atlantic Surface Analysis charts (Part 1 - east) valid 0000 UTC January 10 and 11, 2006, showing development of a hurricane-force storm, the most intense of the period.
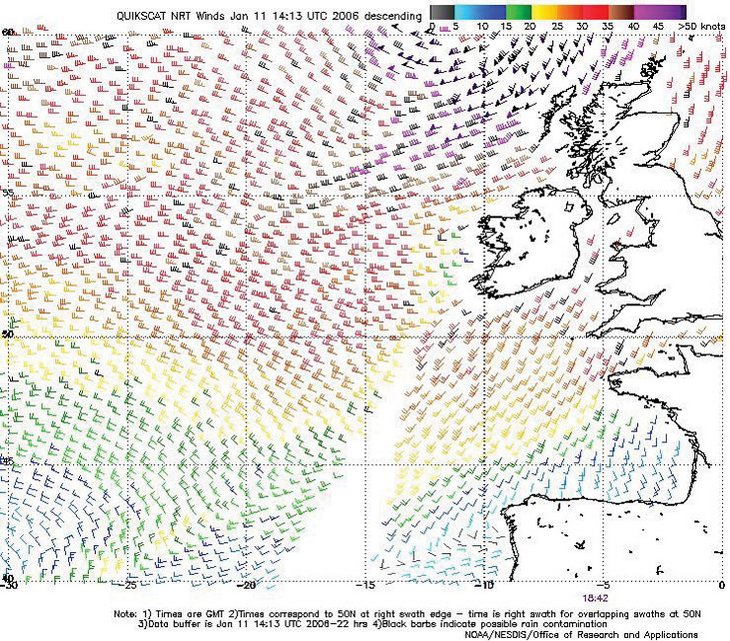
Figure 2. QuikScat scatterometer image of satellite-sensed winds on the south side of the storm shown in Figure 1, valid at 1842 UTC January 10, 2006. The resolution of the image is 25 km. The valid time of the pass is about five hours prior to the valid time of the second part of Figure 1. Image is courtesy of NOAA/NESDIS/Office of Research and Applications.
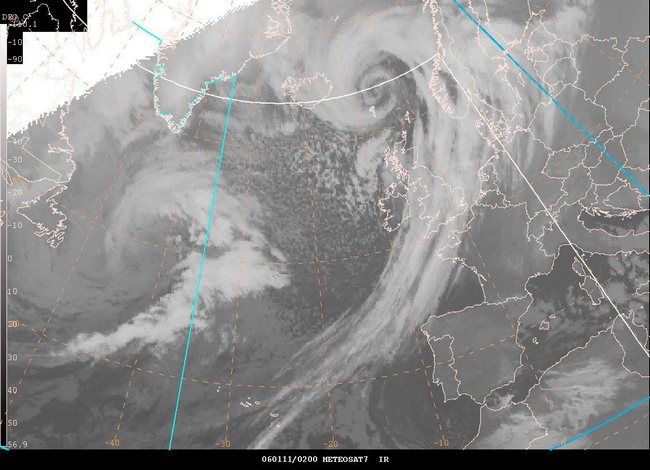
Figure 3. METEOSAT7 infrared satellite image valid at 0200 UTC January 11, 2006, showing the storm in Figure 1 near maximum intensity. Satellite senses temperature on a scale from black (warm) to white (cold) in this type of imagery. The valid time is only two hours later than the valid time of the second part of Figure 1.
The buoy 64046 (60.6N 4.9W) reported southwest winds of 55 kts and 8.5 m seas (28 ft) at 2300 UTC on the 10th, and significant wave heights at this buoy peaked at 11.0 m (36 ft) three hours later. Among ships, Vigilant (GCML) (60.6N 1W) reported the strongest wind, 55 kts from the southwest, at 0000 UTC on the 11th. The vessel Petrojarl Foinaven (C6NR7) (60N 4W) reported west winds of 35 kts and 9.5 m seas (31 ft) twelve hours later. The storm exited the area on the 11th and was the only system to produce hurricane-force winds in this part of the Atlantic during the period.
North Atlantic Storm, January 10-12: This developing low passed across the Canadian Maritime Provinces late on January 9 and on the 10th, becoming a storm east of the island of Newfoundland late on the 10th. The initial development into a storm is shown in the second part of Figure 1, with further significant strengthening occurring as it headed northeast toward Iceland, on a track west of its predecessor. The lowest central pressure was 954 hPa as the center approached Iceland late on the 11th. A quikscat pass at 0747 UTC on the 11th had an appearance similar to Figure 1 for the previous storm, with winds almost as strong, up to 70 kts. Ship data was sparse, with the strongest winds reported at the Grand Banks oil platforms. Platform VEP717 (46.7N 48.7W) reported northwest winds of 56 kts at 0000 UTC January 11. The ship OOCL Forturne (VRWF2) (43N 43W) encountered west winds of 45 kts at 0600 UTC on the 11th. Twelve hours later, the Nedlloyd Auckland (PDHW) reported west winds of 35 kts and 10.0 m seas (32 ft). The storm then passed north of Iceland on the 12th.
North Atlantic Storms, January 13-19: Two storms traversed the area on a southwest to northeast track during this period. The first passed east of the island of Newfoundland early on the 13th, with Platform VEP717 (46.7N 48.7W) reporting a southwest wind of 60 kts at 0600 UTC on the 13th. The cyclone developed a central pressure of 960 hPa near 53N 32W at 0000 UTC on the 14th, when the ship Atlantic Cartier (SCKB) encountered northwest winds of 60 kts near 50N 39W. The system briefly developed hurricane-force winds when passing 300 nmi south of Iceland at 0000 UTC on the 15th, before passing northeast of Iceland later that day. The second low moved from the New England coast on the 15th and passed across the Canadian Maritimes on the 16th, before redeveloping northeast of Newfoundland on the 17th. The system briefly developed hurricane-force winds while passing south of Greenland late on January 17, as revealed in a quikscat pass for 2039 UTC on the 17th. Winds reached 65 kts from the north near the southern tip of Greenland at that time. The central pressure reached 961 hPa near 62N 34W early on the 18th, before the system began to weaken, and move past Iceland early on January 20.
Northwest Atlantic Storm, January 22-24: This developing low tracked from New Brunswick northeast into the North Atlantic near 54N 47W in the 36-hour period ending at 1200 UTC January 23 (Figure 4) and developed hurricane-force winds late on the 22nd. The lowest central pressure of 952 hPa made this storm the second deepest of the period in the North Atlantic. Platform VEP717 reported winds above 60 kts over the twenty-one hour period ending at 0900 UTC January 23, peaking at 71 kts (sustained) from the west at 0000 UTC on the 23rd. Hibernia Platform (HP6038 46.4N 48.4W) reported southwest winds of 60 kts at 1800 UTC on the 22nd. Buoy 44251 (44.5N 53.3W) reported a west wind of 47 kts with gusts to 62 kts and 7.0 m seas (23 ft) at 1500 UTC January 22. Buoy 44138 (44.3N 53.6W) reported northwest winds of 39 kts with gusts to 51 kts at 2300 UTC on the 22nd, and seas up to 9.5 m (31 ft) one hour later. The ship Leonid Galchenko (UCTK) (47N 47W) encountered west winds of 55 kts at 0000 UTC January 23. The cyclone subsequently turned north toward Greenland while maintaining hurricane-force winds through 0000 UTC on the 24th, before weakening, and then dissipating near the southern tip of Greenland on January 25.
North Atlantic Storm, January 26-29: A storm developed southeast of Nova Scotia late on January 25, passed east of the island of Newfoundland late on the 26th and then redeveloped southeast to a new center near 46N 39W early on the 28th. The system turned north and briefly developed hurricane-force winds at 1200 UTC on the 29th while passing 60N 37W with a central pressure down to 962 hPa. The cyclone then weakened to a gale while passing east of Greenland by the 30th.
Coastal Storm of January 31 to February 3: A complex area of low pressure moved off the U.S. mid-Atlantic coast early on the 31st and quickly consolidated into a hurricane-force low by 0000 UTC February 1. Figure 5 captures the initial rapid development of this storm, with the central pressure dropping 27 hPa in twenty-four hours, an impressive rate of intensification for that latitude.
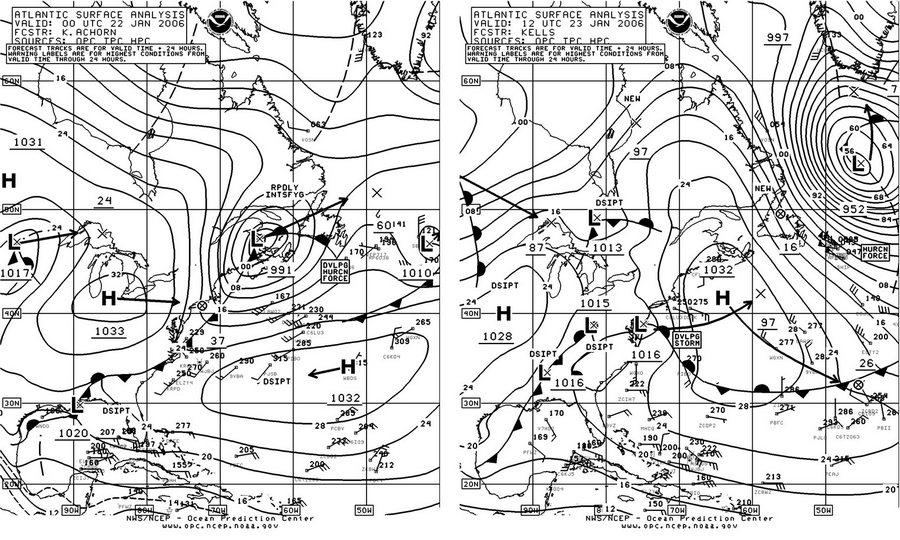
Figure 4. OPC North Atlantic Surface Analysis charts (Part 2 - west) valid 0000 UTC January 22 and 1200 UTC January 23, 2006.
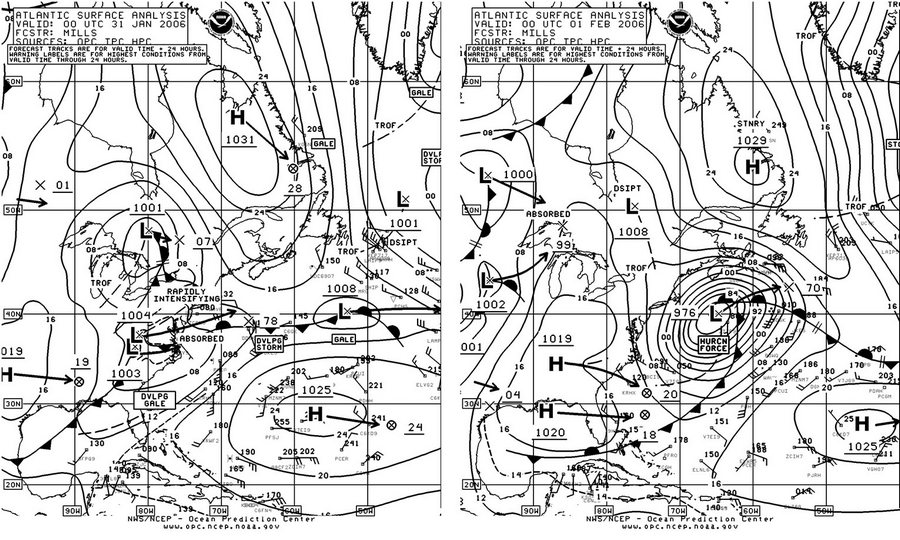
Figure 5. OPC North Atlantic Surface Analysis charts (Part 2) valid 0000 UTC January 31 and 0000 UTC February 1, 2006.
The high-resolution quikscat data in Figure 6 reveals winds to 70 kts west and southwest of the departing storm. The Maersk Dexter (ZIZP9) (39N 60W) reported a southwest wind of 50 kts and 10.5 m seas (35 ft) at 0600 UTC February 1. Six hours later the vessel DMRG (44N 62W) reported northeast winds of 55 kts and 12.0 m seas (39 ft). The vessel Sealand Motivator (WAAH) (43N 64W) encountered northwest winds of 55 kts and 15.0 m seas (49 ft) six hours later at 1800 UTC on the 1st. The buoy 44137 (42.3N 62.0W) reported northwest winds of 39 kts three hours later. Seas reached 10.0 m (32 ft) at buoy 44024 (42.3N 65.9W) at 1600 UTC on the 1st. The system then passed over the Grand Banks early on February 2 and began to weaken, with Platform VEP717 (46.7N 48.7W) reporting northwest winds of 60 kts at 0000 UTC on the 3rd. The cyclone subsequently dissipated over the central Atlantic waters early on February 5.
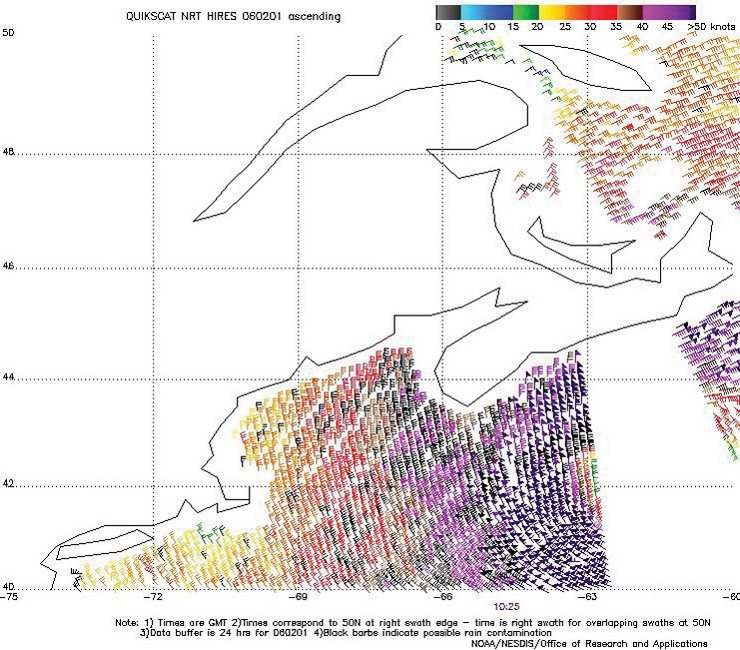
Figure 6. High-resolution QuikScat scatterometer image of satellite-sensed winds around the west side of the storm shown in Figure 5. The resolution is 12.5 km, versus 25 km in the coarser version of such imagery. The valid time of the pass is 1025 UTC February 1, 2006, or about ten and one-half hours later than the valid time of the second part of Figure 5. Image is courtesy of NOAA/NESDIS/Office of Research and Applications.
North Atlantic Storm, February 10-14: This powerful system developed from a frontal wave of low pressure 450 nmi south of the island of Newfoundland late on February 9. Figure 7 shows the period of most rapid intensification of this low, with the central pressure dropping 36 hPa in a twenty-four hour period. Hurricane-force winds affected the Grand Banks platforms following passage of this storm. Hibernia Platform (HP6038 at 46.4N 48.4W) reported a peak sustained west wind of 76 kts at 0900 UTC on the 11th, while Platform VEP717 (46.7N 48.7W) reported west winds at 72 kts and GSF Grand Banks (YJUF7) (46.7N 48.0W) west winds of 69 kts at that time. A ship with the generic call sign SHIP (49N 47W) encountered west winds of 60 kts and 12.0 m seas (39 ft) a bit later at 1800 UTC that day. The storm center attained a maximum intensity of 953 hPa near 52N 41W at 0000 UTC on the 12th. The system maintained hurricane-force winds for at least 24 hours before the cyclone continued on a northeast track with gradual weakening after 0000 UTC on the 12th.
Coastal Storm, February 12-16: The second part of Figure 7 shows the initial development of a frontal low-pressure wave over Georgia, with rapid intensification into a storm near the New Jersey coast twenty-four hours later as shown in Figure 8. A quikscat pass revealed winds to 60 kts south of the center about six hours later. The system moved rapidly northeast, passing east of Labrador late on the 13th. Again there were hurricane-force winds at the Grand Banks platforms, with Platform VEP717 (46.7N 48.7W) reporting southwest winds of 70 kts and Hibernia (HP6038 at 46.4N 48.4W) southwest 65 kts along with 7.5 m seas (24 ft) at 0000 UTC on the 14th.
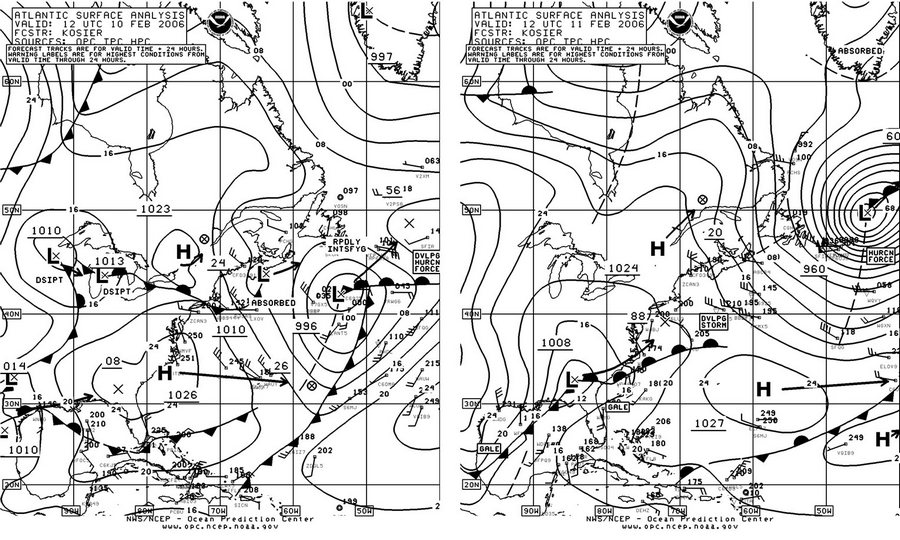
Figure 7. OPC North Atlantic Surface Analysis charts (Part 2) valid 1200 UTC February 10 and 11, 2006.
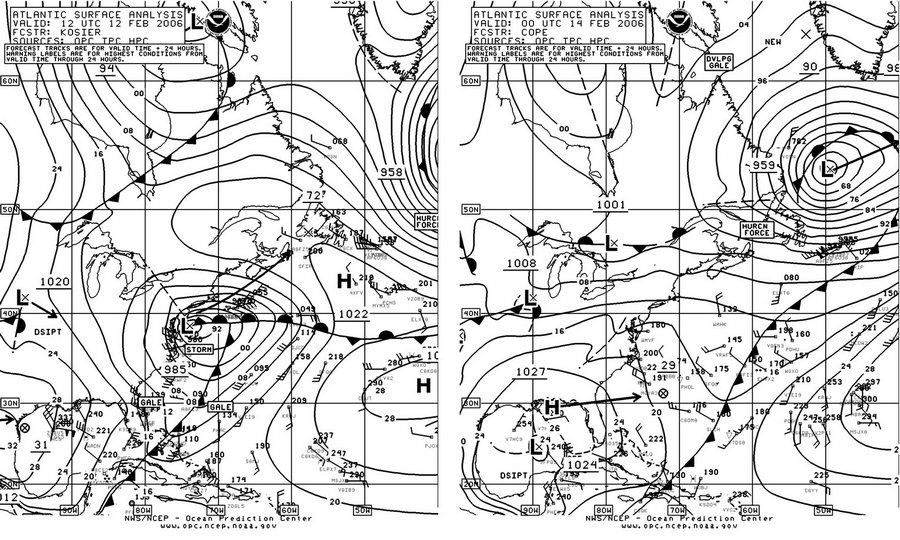
Figure 8. OPC North Atlantic Surface Analysis charts (Part 2) valid 1200 UTC February 12 and 0000 UTC February 14, 2006.
The high-resolution quikscat image in Figure 9 shows winds to 60 kts east of the platforms and northeast winds up to 75 kts, where the flow ahead of an approaching frontal system encounters the southern tip of Greenland. The storm subsequently began a slow weakening trend while heading northeast, becoming a large storm over the northeast Atlantic early on the 16th and then weakening to a gale while passing northwest of Great Britain later that day.
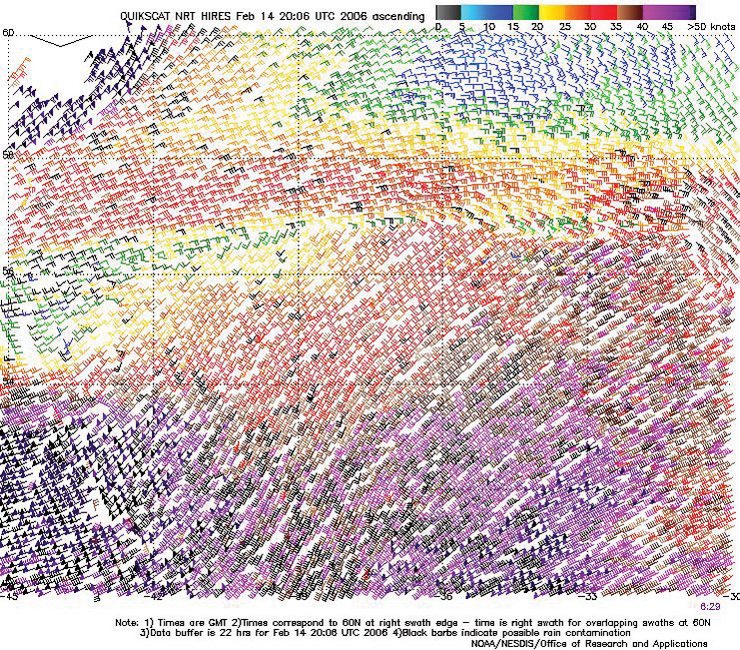
Figure 9. High-resolution QuikScat scatterometer image of satellite-sensed winds displaying the stronger winds around the south and north sides of the storm in the second part of Figure 8, valid at 0629 UTC February 14, 2006. The valid time of the pass is about six and one-half hours later than the valid time of the second part of Figure 8, with the center of the storm near the left edge of the figure at 56N. The southern tip of Greenland is at the upper left edge of the image. Image is courtesy of NOAA/NESDIS/Office of Research and Applications.
Western North Atlantic Storms of February 22 to March 1: A very active blocked pattern prevailed during this period, leading to several storms developing south of the Canadian Maritimes and turning north across the Grand Banks before being forced west by a strong blocking high to the north and east. The cyclones all developed hurricane-force winds. The first developed from a frontal wave southeast of Newfoundland late on February 21, then moved to the Grand Banks late on the 22nd before turning northwest. The first part of Figure 10 shows the motion of this storm northwest through the Labrador Sea. Hurricane-force winds with this low were mainly ahead of the occluded front approaching Greenland. A quikscat pass valid about six hours prior showed east winds up to 70 kts southwest of the southern tip of Greenland. The next storm in the series is shown south of Newfoundland with a hurricane force label in the first part of Figure 10, intensifying to 953 hPa near the Grand Banks as shown in the second part of the figure, before turning northwest. Meanwhile a third developing storm moved southeast from Nova Scotia to become the hurricane-force low south of Newfoundland (Figure 10). This was a marginal hurricane-force event, supported by quikscat winds to 65 kts southwest and west of the center at 1000 UTC February 25, or two hours prior to the time of the second part of Figure 10. Selected platform and ship observations are listed in Table 1, with most observations taken in the strong second storm.
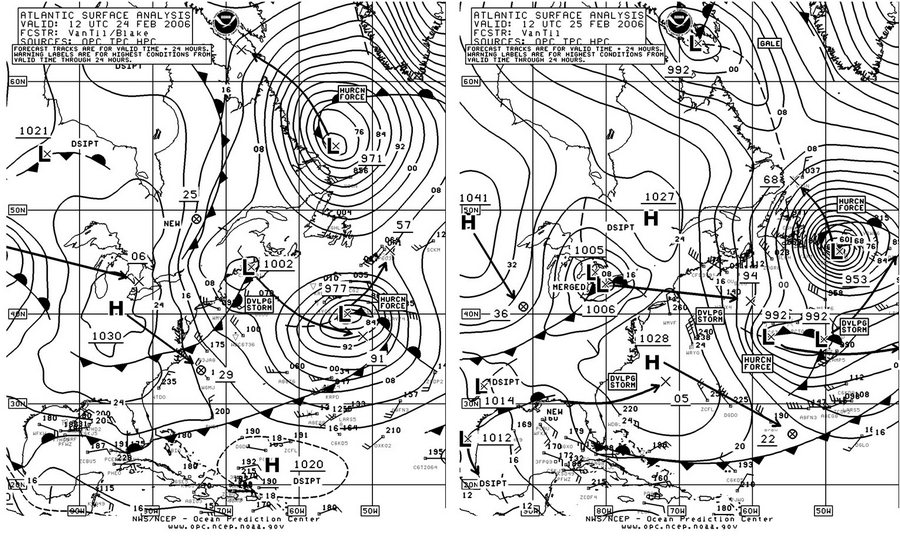
Figure 10. OPC North Atlantic Surface Analysis charts (Part 2) valid 1200 UTC February 24 and 25, 2006.
| OBSERVATION | POSITION | DATE/TIME(UTC) | WIND(kts) | SEAS(m/ft) |
|---|---|---|---|---|
| Hibernia HP6038 | 46.4N 48.4W | 25/0300 | NE 65 | |
| 25/2100 | SW 78 | 7.5/25 | ||
| Platform VEP717 | 46.7N 48.7W | 25/0300 | NE 65 | |
| 25/2100 | SW 65 | |||
| Integrity (WDC6925) | 41N 51W | 24/1200 | E 55 | 3.5/12 |
| Raffles Park (A8DF8) | 40N 46W | 25/0000 | W 55 | 6.5/21 |
| Providence Bay | ||||
| Philadelphia Express (WDC6736) | 39N 61W | 25/0300 | W 50 | |
| Maersk Dauphin (MSTM6) | 42N 50W | 25/1200 | NW 50 | 9.0/29 |
| Oranjeborg (PIAG) | 45N 37W | 25/1800 | SW 45 | 9.0/30 |
| Atlantic Conveyor (SCKM) | 46N 52W | 25/1800 | NW 50 | 9.5/31 |
Table 1. Some ship and platform observations taken during passage of the second storm as shown in Figure 10.
Figure 11 is a continuation of Figure 10, with the second storm shown moving into Labrador, while the third hurricane-force low is shown turning northwest in the first part of Figure 11, and is well inland in the second part of Figure 11. A fourth storm, shown in the Labrador Sea at 0000 UTC on the 28th, originated as the frontal wave of low pressure off the southeast U.S. coast 48 hours prior (first part of Figure 11). A fifth storm formed from the complex system southeast of Newfoundland in the second part of Figure 11, which followed the preceding storm through the Labrador Sea on March 1. Both of the last two produced hurricane-force winds in the Labrador Sea southwest of Greenland, up to 75 kts, as revealed in quikscat imagery, most widespread with the stronger fourth storm in the second part of Figure 11. Additional ship reports from the period of February 26 to March 1 are listed in Table 2.
North Atlantic Storm, March 4-7: The blocking high pressure weakened by this time, allowing this developing storm to take a more northeastward track. This storm developed a central pressure of 964 hPa near 56N 46W at 0000 UTC March 6, after originating about 450 nmi south of Newfoundland forty-eight hours prior. A frontal system extended northeast past Greenland, with winds up to 70 kts appearing in quikscat imagery between the front and the Greenland coast late on the 5th and early on the 6th. These winds were comparable to those found in a prior event such as the February 12-16 event. (See Figure 9.) Ships reported from areas outside the strongest winds, with the Godafoss (V2XM) observing southwest winds to 45 kts near 56N 39W at 0900 UTC March 6. Twenty-four hours prior, the ship Hedwig Oldendorff (A8FZ5) (45N 38W) reported the same winds along with seas of 7.0 m (23 ft). The storm weakened thereafter and moved northeast past Iceland on the 7th.
North Atlantic Storm, March 7-9: This storm tracked farther south than the March 4-7 storm during its initial development into a hurricane-force low, before swinging north toward Iceland. From 300 nmi east of Cape Race early on the 7th, the system moved northeast and intensified, developing a central pressure of 980 hPa near 55N 20W at 0000 UTC on the 9th. An unknown ship, V5XC9 near 44N 31W, reported west winds of 50 kts at 1200 UTC March 8. The cyclone briefly developed hurricane-force winds of 65 kts southwest of the center shortly thereafter, as revealed by a quikscat pass from 2143 UTC March 8. The storm subsequently turned north on the 9th and dissipated near Iceland on the 10th.
North Atlantic Storm of March 23-25: Blocking at high latitudes strengthened by the middle of March, forced this developing storm to take a more southern track. After moving off the North Carolina coast on the 21st, this low tracked east northeast and developed a lowest central pressure of 964 hPa near 41N 46W at 0000 UTC March 24 (Figure 12), when OPC classified it as a hurricane-force storm. This was supported by a high-resolution quikscat pass from three hours earlier (Figure 13), which revealed 65 kts wind barbs southwest of the center and even one such barb southeast of the center. The winds began to decrease twelve hours later, although the lowest central pressure of 960 hPa was reached at 1800 UTC on the 24th. The cyclone weakened to a gale near 43N 26W late on the 25th, before turning more north and becoming wrapped up in a complex low-pressure system west of the British Isles by the end of the month.
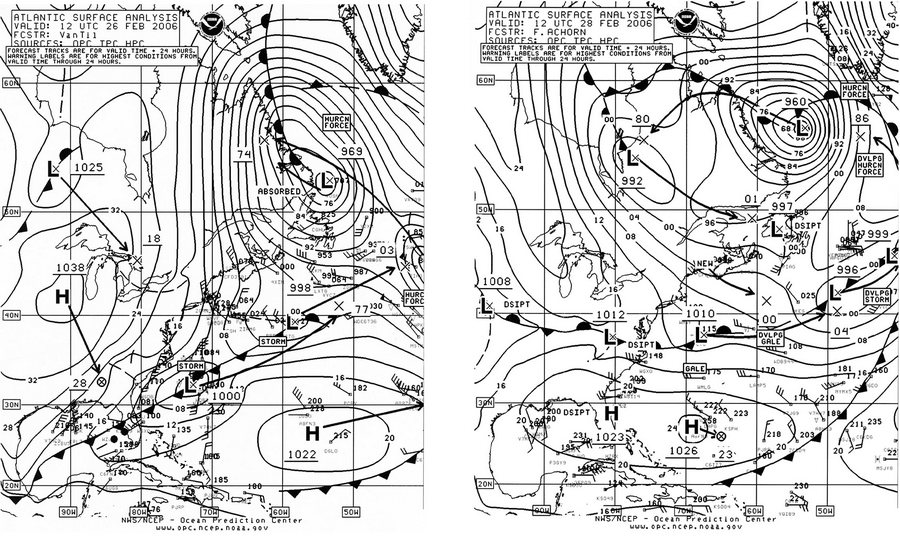
Figure 11. OPC North Atlantic Surface Analysis charts (Part 2) valid 1200 UTC February 26 and 28, 2006.
| OBSERVATION | POSITION | DATE/TIME(UTC) | WIND(kts) | SEAS(m/ft) |
|---|---|---|---|---|
| CP Liberator (WGXN) | 41N 44W | 26/1200 | W 50 | 11.0/36 |
| Sealand Achiever (WPKD) | 40N 41W | 26/1200 | NW 40 | 15.0/50 |
| Maersk Phuket (MYMX5) | 35N 36W | 26/1200 | SW 50 | 17.0/56 |
| Genoa Senator (DPPH) | 43N 40W | 26/1800 | W 45 | 13.0/42 |
| Sealand Achiever (WPKD) | 41N 39W | 26/1800 | W 40 | 11.5/38 |
| Independence (WRYG) | 34N 56W | 27/0500 | S 60 | 9.0/29 |
| SHIP | 40N 56W | 27/1200 | N 65 | 6.5/22 |
| Napolean (VVGZ) | 42N 47W | 27/1200 | SE 55 | |
| Sealand Pride (WDB9444) | 35N 60W | 28/0000 | W 40 | 11.5/38 |
| Arina Arctica (OVYA2) | 59N 44W | 28/1200 | E 50 | |
| Godafoss (V2XM) | 59N 32W | 01/0600 | E 60 | |
| Atlantic Companion | 50N 40W | 01/1200 | NW 35 | 10.0/32 |
Table 2. Some ship observations taken during the period of February 26 to March 1.
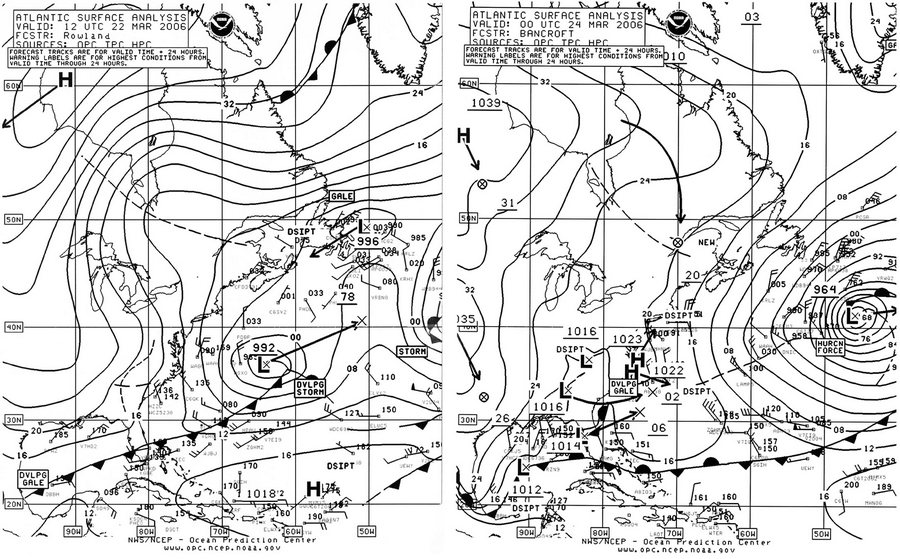
Figure 12. OPC North Atlantic Surface Analysis charts (Part 2) valid 1200 UTC March 22 and 0000 UTC March 24, 2006.
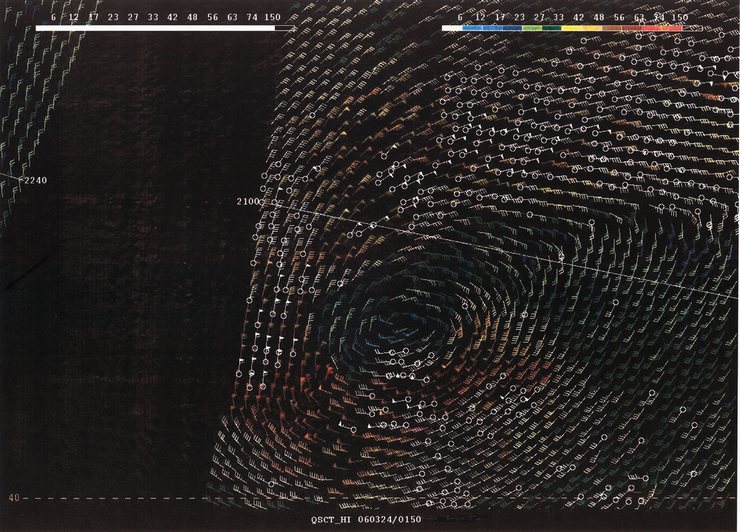
Figure 13. High-resolution QuikScat scatterometer image of satellite-sensed winds around the storm shown in the second part of Figure 12. The valid time of the pass is 2100 UTC March 23, 2006, or three hours prior to the valid time of the second analysis in Figure 12. The numbered diagonal line in the image is a cross-track time line of the satellite. Open circles denote rain-flagged data. Image is courtesy of NOAA/NESDIS/Office of Research and Applications.
Western Atlantic Storm of March 26-28: This developing storm originated near northern Florida early on the 24th and rapidly intensified after 0000 UTC on the 26th. Figure 14 shows the final twenty-four hour period of development, with the second part showing the cyclone at maximum intensity. The quikscat winds in Figure 15 collected close to the time of maximum intensity, show wind barbs up to 70 kts south and southwest of the center. Although the stronger winds are flagged as contaminated by rain, such contamination is usually less of a problem in that part of the storm’s circulation. The cyclone maintained hurricane-force winds for about twelve hours, before weakening began early on the 27th. The Choyang Honour (DADD) reported southwest winds of 60 kts and 10.5 m seas (34 ft) near 38N 60W at 1800 UTC March 26, and twelve hours later west winds of 45 kts and seas 10.5 m (35 ft) near 37N 58W. The Lykes Navigator (WGMJ) encountered north winds of 50 kts and 6.0 m seas (19 ft) near 43N 59W at 1300 UTC March 27. The Canadian buoy 44137 (42.3N 62.0W) reported northeast winds of 45 kts and 8.0 m seas (27 ft) at 1900 UTC on the 26th. The system subsequently weakened to a gale just southeast of the Grand Banks on the 28th, before redeveloping east toward Great Britain and weakening further near Portugal by March 31.
Storm off Southeast U.S. Coast, April 29-30: An area of low pressure moved off the U.S. southeast coast on April 27 and stalled in the vicinity of 32N 68W from the 29th through the 30th. Although the central pressure was only as low as 1007 hPa, building high pressure to the north caused winds and seas to increase north and northwest of the center. The ship Elektra (SIWB) (36N 72W) reported northeast winds of 60 kts at 0600 UTC on the 28th. Other ships reported winds in the 35 to 45 kts range through the 30th. The ship Maersk Maine (WAUY) (39N 67W) encountered north winds of 40 kts and 9.0 m seas (30 ft) at 0000 UTC April 30. The same ship reported northeast winds of 40 kts and seas 10.5 m (34 ft) near 39N 67W six hours later.
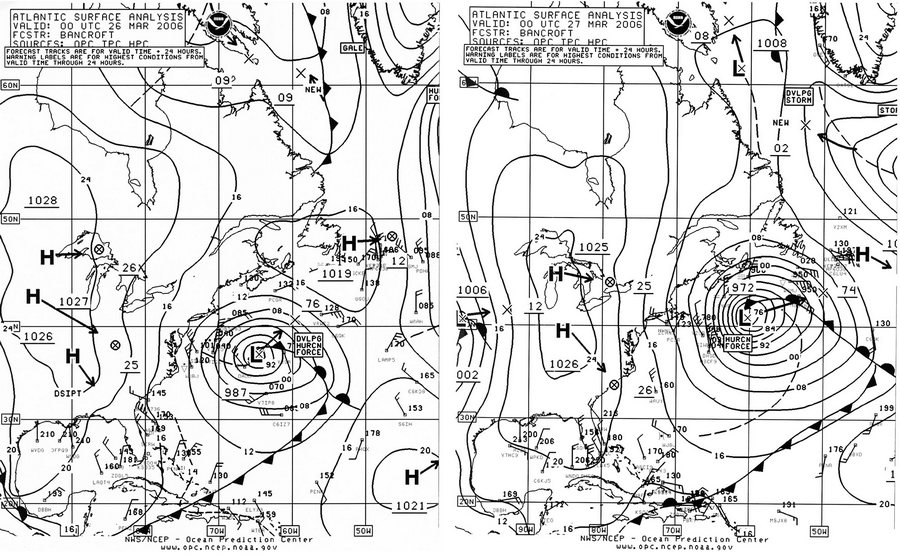
Figure 14. OPC North Atlantic Surface Analysis charts (Part 2) valid 0000 UTC March 26 and 27, 2006.
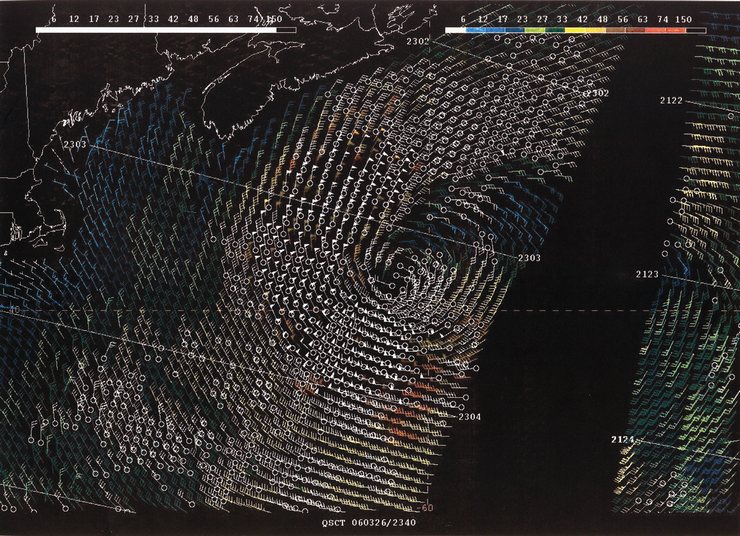
Figure 15. QuikScat scatterometer image of satellite-sensed winds around the storm shown in the second part of Figure 14. The valid time of the pass is about 2300 UTC March 26, 2006, or about one hour prior to the valid time of the second part of Figure 14. As in Figure 13, this image has numbered cross-track time lines and open circles denoting rain-flagged data.