Marine Weather Review - Tropical Atlantic and Tropical East Pacific Areas January through May 2005
Daniel P. Brown and Hugh D. Cobb III, Tropical Analysis and Forecast Branch, Tropical Prediction Center, NOAA/NWS Miami, FloridaSignificant Weather of the Period
Atlantic, Caribbean and Gulf of Mexico: January through May 2005 was a very active period in terms of the number of gale and storm events across the subtropical and tropical Atlantic Basin. A total of 22 events occurred during the period. Many of these events were associated with strong cold fronts that moved off the southeast United States coast and affected the Gulf of Mexico or the western Atlantic. However, only three events occurred in January, which is usually a very active month. February and March turned out to be a very active period with fifteen events occurring during the two-month period. A western Atlantic storm event in early February produced strong gales well south into the TPC forecast area. This event also brought strong winds to Bermuda. Three additional events occurred in April and two in May. The event in mid-April produced very large swells that impacted the east coast of Florida, the Bahamas, and Puerto Rico. Details of the early February and mid-April events are provided.
Western Atlantic Storm January 31-February 6: The strongest event of the period was produced by a strong low that produced gale to storm conditions across the western Atlantic between 31 January and 5 February. The precursor to the western Atlantic low was a low that developed along the northern Gulf of Mexico coast on 28 January. The low moved eastward on the 29th and weakened over the northeast Gulf. On the 30th, a second low began to form off the coast of South Carolina. This low quickly strengthened, becoming a gale off the coast of North Carolina. At 0600 UTC 31 January, the 1002 hPa low was centered about 225 nmi east of Cape Hatteras. At this time, the low began producing storm force winds off the North Carolina coast. The track of the low was then somewhat atypical moving east-southeastwards towards Bermuda.
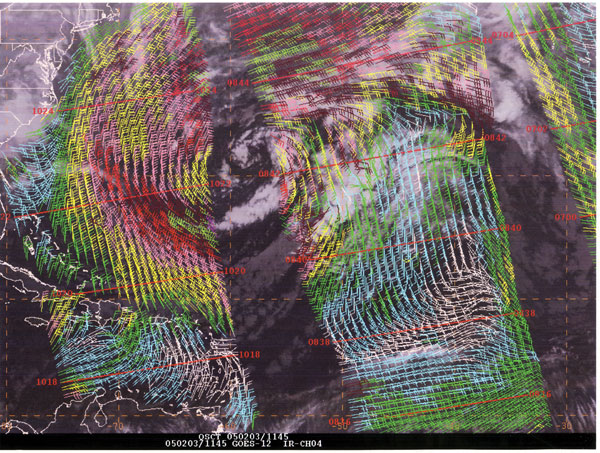 |
Figure 1. 1145 UTC 03 February GOES-12 infrared satellite image with QuikSCAT overlaid. Note the area of strong winds well southwest of the low that is centered between the two QuikSCAT passes. |
At 0000 UTC 1 February, the 1000 hPa storm center was located just north of Bermuda. Shortly after this time, gale force winds began over the Tropical Prediction Center's area of responsibility. Most of the strong winds occurred to the west and southwest of the storm center. At 1800 UTC, the ship Cap San Nicolas (ELYX3) reported 35-kts winds near 28N 62W. The low slowed as it moved east of Bermuda on the 1st. As the low passed the island, gale-force wind gusts or higher were observed for about 48 hours. Reports from Bermuda indicate that the sustained winds reached a peak value of 43 kts with gusts to 61 kts around 1000 UTC 2 February. At 1200 UTC 2 February, the ship Lykes Explorer (WGLA) reported 60-kts winds just northwest of Bermuda while the Cap San Nicolas (ELYX3) observed 40 kts winds near 31N 65W. Gale force winds well west and southwest of the low were detected by a QuikSCAT pass around 1145 UTC 2 February (Figure 1).
However, the area of storm force winds encountered by the Lykes Explorer (WGLA) was located between the two QuikSCAT passes. This provided an excellent case to demonstrate the importance of accurate ship observations. Even with QuikSCAT data routinely available to marine forecasters, in this situation the storm force observation from the Lykes Explorer (WGLA) was extremely critical to the warning and forecast process. By 0000 UTC 3 February, the 991 hPa low was near 31N 59W. At this time winds of 30 to 40 kts were occurring north of 26N between 50W and 70W. The ship Chiquita Schweiz (C6KD9) encountered 35-kts winds near 26N 55W. In addition to the winds, the low also created very large swells that effected the western Atlantic as far south as Puerto Rico and the northern Leeward Islands. These swells produced breaking waves of 4-5m (14-17 ft) along the north coast of Puerto Rico on the 4th. The low finally weakened and moved slowly northward on the 4th. At 0000 UTC 5 February, the low was centered near 35N 55W. At this time, winds south of the 31N decreased below gale force. The low continued to slowly move north, eventually weakening and dissipating near 40N 53W on the 7th.
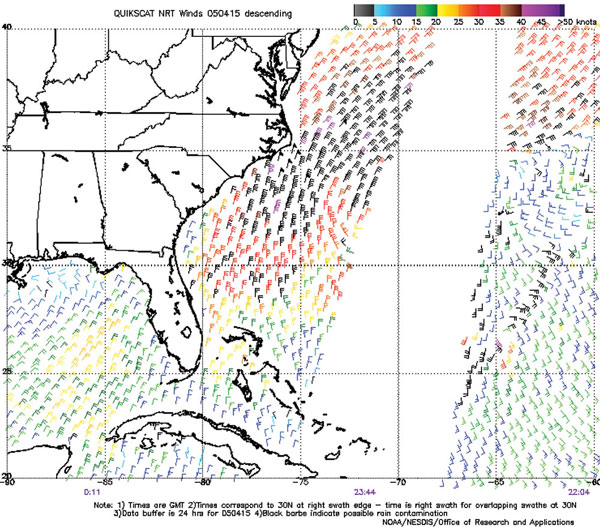
Western Atlantic Storm April 14-17: The incipient low pressure that produced this storm event developed over the central United States. The low then tracked east-southeastward across Kentucky and the Carolinas early on the 13th. Around 1800 UTC 13 April, it moved off the coast of North Carolina near Wilmington. Once offshore, the low quickly strengthened into a gale center then it became nearly stationary about 250 nmi southeast of Cape Hatteras. At this time, gales were occurring to the northwest and north of the low. By 0600 UTC 15 April, the low strengthened into a storm center and began to move slowly southeastward. At 1800 UTC, the 1004 hPa storm was centered near 33N 73W. At this time, gale force winds began in the Tropical Prediction Center's marine area. QuikSCAT data at 2344 UTC 15 April (Figure 2) indicated storm force winds off the coast of North Carolina with gale force winds extending south to about 29N.
|
|
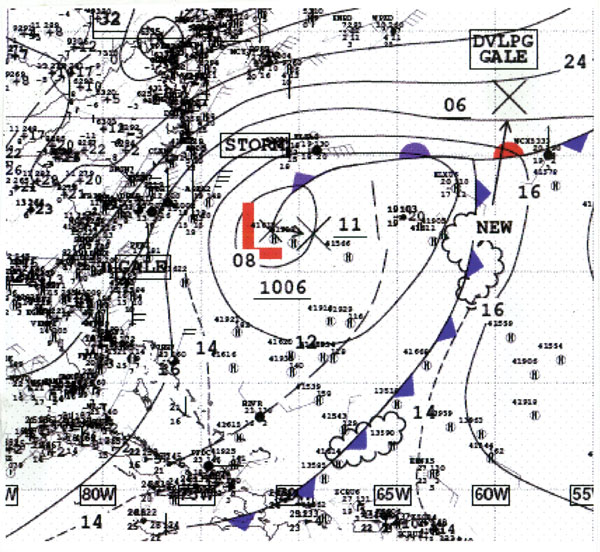
The low's slow movement and large fetch of strong winds created ideal conditions to build very large seas. Buoy 41002 (32.3N 75.4W) reported a maximum significant wave height of 7.8 m (26 ft) around 0400 UTC 16 April. At this time, the low was centered about 240 nmi east-southeast of the buoy (Figure 3). Large swells propagated well southward and effected much of the east coast of Florida and the Bahamas. Buoy 41010 (28.9N 78.5W) located 120 nmi east of Cape Canaveral reported seas above 3 m (10 ft) for about 60 consecutive hours, beginning around 1000 UTC 15 April. The significant wave height at the buoy peaked at 5.3 m (17 ft) at 0900 UTC 16 April. NOAA Buoy 41009 (28.5N 80.2W) closer to shore, about 20 nmi east of Cape Canaveral, reported wave heights between 3.5 and 4 m (11-13 ft) between 0600 UTC April 16 and 1900 UTC 17 April. This is the same storm system that produced the rogue wave that damaged the Norwegian Dawn (C6FT7) early on 16 April.
Late on the 16th the storm center began moving east-northeastward. At 0000 UTC 17 April, the storm weakened to a gale near 32N 70W. Shortly after this time, gale conditions ended south of 31N. Large northerly swells continued to affect the southwest North Atlantic through the 18th.
Eastern North Pacific
Gulf of Tehuantepec Events: The first Gulf of Tehuantepec gale event of calendar year 2005 began around 0600 UTC 9 January and lasted approximately 54 hours until 1200 UTC 11 January. QUIKSCAT first captured the core of the wind field at 1218 UTC 10 January. This pass indicated 40-45 kt winds in the Gulf of Tehuantepec. A subsequent pass at 0050 UTC 11 January indicated that winds were barely gale force in the area. One ship reported gale force winds, the ship with call sign Ship (V2IA01) located near 13.5N 94.0W reported 35 kts winds and seas of 4.5 m (15 ft) at 1800 UTC 10 January.
The first storm event for the year began around 0600 UTC 14 January and lasted for nearly a week, finally ending 0000 UTC 21 January. The extended duration of the event produced one of the largest gale force wind fields associated with a Gulf of Tehuantepec gale event in the six-year period 1999-2005. The first QUIKSCAT indication of gale-force winds was at 1215 UTC 14 January, with winds of 40-45 kts winds in the Gulf of Tehuantepec. Subsequent passes on 15 January indicated an expansion of the wind field southwestward to 10N and 100W. By 17 January, the area of enhanced winds had spread further, and extended from 5N to 10N westward to 110W. There were several ships that reported gale-force winds or greater during this prolonged event. The first ship report of gale-force winds occurred at 1200 UTC 15 January. The ship Magelby Maersk (OUSH2) reported NNE winds of 35 kts while located near 14N 95W. The gale was upgraded to a storm at 1800 UTC 15 January based on the ship Overseas Joyce (WUQL) report of 55-kts winds while located near 15N and 95W. Other ship reports included 45 kts from Ship (DLHZ) at 0000 UTC 16 January while located near 15N 95W. This ship reported 4.5 m (16 ft) seas as well. The Maersk Denver (A8EH2) also reported storm-force winds with this event. This ship reported 50-kts winds and 3.3 m (11 ft) seas at 1200 UTC 17 January while located near 14.5N 95W. A testament to the extent of the gale-force winds with this prolonged event was given by the ship Singapore Bay (MRGU3) which reported 35-kts winds at 1200 UTC 18 January while located near 12.5N 98W, about 350 nmi from the Gulf of Tehuantepec. The last ship report of gale-force winds with this event was received at 1800 UTC 20 January. The ship Dagmar Maersk (DHAF) reported 35-kts winds while located near 14N 95.5W.
The third event of the year was very short lived, lasting only 30 hours from 0600 UTC 24 January to 1200 UTC 25 January and was probably a marginal gale event. It was the weakest of the events during the period. There were no 25 km resolution QUIKSCAT passes of gale-force winds associated with this event and no ship reports of gale-force winds.
There were only two Gulf of Tehuantepec gale events during February, an abnormally low number. The first event began 0000 UTC 3 February and lasted more than three days, finally ending around 1200 UTC 6 February. A 0055 UTC 3 February QUIKSCAT pass indicated 35-kts winds in the Gulf of Tehuantepec. A subsequent QUIKSCAT pass at 0029 UTC 4 February indicated 50-kts winds in the Gulf of Tehuantepec, and the event was upgraded to a storm based on this information. A 0003 UTC 5 February QUIKSCAT pass indicated 40-45 kt winds remained in the area, nearly 24 hours after storm force winds were detected. One ship reported gale-force winds at 1800 UTC 5 February, the ship Rickmers Seoul (V7EI5) reported easterly winds of 40 kts and seas of 4.5 m (15 ft) while located near 14.5N 96W.
The next wind event commenced a week later around 1200 UTC 10 February and persisted for a little more than 48 hours, ending around 1800 UTC 12 February. An 1150 UTC 11 February QUIKSCAT pass indicated 40 kts winds in the Gulf of Tehuantepec. A subsequent pass at 0022 UTC 12 February showed that 40 kts winds persisted in the region. There were two ship reports of gale force winds associated with this event. The first, the Martorell (HPNE), reported 35-kts winds and 4.3 m (14 ft) seas at 1800 UTC 10 February while located near 14.7N 95.2W. The second ship, Legend of the Seas (C6SL5), reported NNE winds of 40 kts and 5 m (17 ft) seas at 06 UTC 12 February while located near 14.2N 94.5W.
Nearly a month elapsed between gale events, with the sixth event of 2005 beginning around 1200 UTC 10 March and lasting a mere 18 hours until 0600 UTC 11 March. An 1151 UTC QUIKSCAT pass on the 10th of March was the basis for the beginning of this event. This pass indicated 35-40 kts winds in the Gulf of Tehuantepec. There were no ships reporting winds of gale force with this event. The last event in March began 0000 UTC 28 March and continued for about 24 hours. A 1225 UTC 28 March QUIKSCAT pass indicated a marginal gale of 35 kts was in progress. No ship reports of gale force were noted with this event. However, the ship Sealand Patriot (KHRF) reported 30-kts winds at 1200 UTC 28 March while located near 14.8N 95.5W.
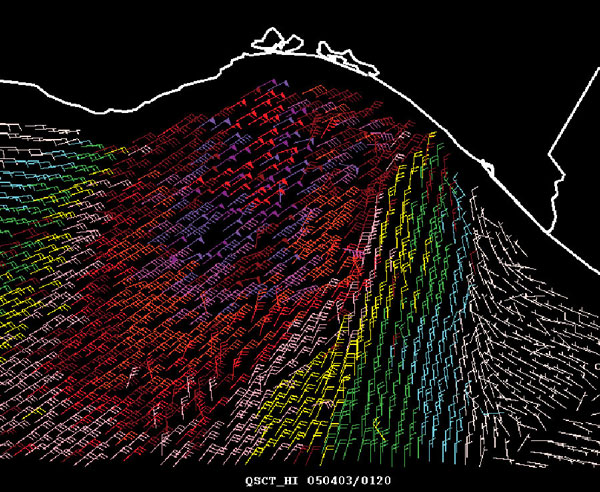 |
Figure 4. 0120 UTC 3 April 2005 QuikSCAT pass over the Gulf of Tehuantepec indicating a large area of storm force (>48 kt) winds with a few winds of hurricane force (65 kt). This was only the second time hurricane force winds have been observed in the Gulf of Tehuantepec since the advent of QuikSCAT data in 1999. |
The first event for the month of April was a typical late season storm event. This event was very similar in strength to the hurricane force wind event which occurred on 30-31 March 2003 and was the strongest event to occur during the January to April 2005 period. The event lasted only 42 hours from 0000 UTC 2 April to 1800 UTC 3 April. Despite the brief nature of the event, hurricane force winds of 65 kts were noted on two high-resolution (12.5 km) QUIKSCAT passes at 0100 UTC and 1300 UTC 3 April (Figure 4.) The ship Legend of the Seas (C6SL5) was the first to report gale force winds (NNW 35 kts) at 0600 UTC 2 April while located near 14.5N 94W. Six hours later the first report of storm force winds came from CSAV Yokohama (DGVC). The ship reported 60-kts winds while located near 13N 98W. The ship CMA CGM Vernet (DGCP) reported northerly winds of 40 kts and 8 m (26 ft) seas at 1800 UTC 2 April while located near 13.8N 95.5W. Six hours later the ship Singapore Bay (MRGU3) reported north-northeasterly winds of 35 kts and 4 m (13 ft) seas near 11.5N 95.5W, about 275 nmi SSW of the Gulf of Tehuantepec, showing once again how quickly the wind field had spread out during this exceptionally strong event.
The final gale event for the spring season 2005 began two weeks later around 0000 UTC 16 April and lasted 60 hours, until 1200 UTC 18 April. A 1215 UTC 16 April QUIKSCAT pass was the first to indicate gale force winds (35-40 kts) associated with this event. The next QUIKSCAT pass at 1207 UTC 17 April over the area indicated winds had increased to 40-45 kts. A subsequent pass at 0039 UTC 18 April indicated winds had dropped just below gale force. Table 1 lists gale and storm events for the Gulf of Tehuantepec.
| Event | Beginning | Ending |
| 1 | 0600 UTC 9 January | 1200 UTC 11 January |
| 2* | 0600 UTC 14 January | 0000 UTC 21 January |
| 3 | 0600 UTC 24 January | 1200 UTC 25 January |
| 4* | 0000 UTC 3 February | 1200 UTC 06 February |
| 5 | 1200 UTC 10 February | 1800 UTC 12 February |
| 6 | 1200 UTC 10 March | 0600 UTC 11 March |
| 7 | 0000 UTC 28 March | 0000 UTC 29 March |
| 8** | 0000 UTC 02 April | 1800 UTC 03 April |
| 9 | 0000 UTC 16 April | 1200 UTC 18 April |
Table 1. Estimated beginning and ending times for Gulf of Tehuantepec gale and storm events from January through May, 2005. Storm events are denoted with an asterisk (*). Hurricane force wind events are denoted with two asterisks (**).