Marine Weather Review-North Atlantic Area
January through April 2005
By George P. Bancroft, NOAA National Center for Environmental Prediction
Introduction
The stormiest period was January through the first half of February when an active storm track took deepening low-pressure systems on a northeastward track across the North Atlantic. One particularly intense low tracked across the British Isles and North Sea early in the month and another passed to the west of the British Isles toward the middle of the month. By February, the pattern became more variable under the influence of varying amounts of blocking high pressure in the eastern North Atlantic and at high latitudes. Some of the lows moved erratically and even formed cutoff lows, with one in particular off the southeast U.S. coast in mid-April producing storm-force winds and very high seas.
There was no tropical cyclone activity during this four-month period, although such cyclones can develop prior to the official start of the Atlantic hurricane season on June 1.
Significant Events of the Period
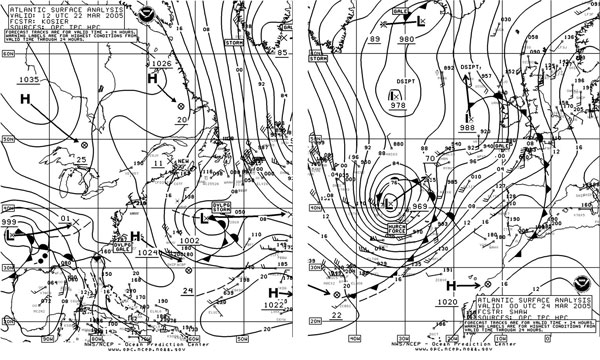
North Atlantic Storm, January 2-7: A developing area of low pressure moved northeast off the Labrador coast on January 1 and passed east of Greenland early on the 3rd, developing hurricane-force winds between the center and the Greenland coast. The system attained a lowest central pressure of 950 hPa near 62N 34W at 0000 UTC on the 4th. That area usually lacks ship data, with OPC often using QuikSCAT satellite-derived winds to determine warning category. The storm passed northwest of Iceland on January 4, but a new main center formed near the Greenland coast early on the 7th, then drifted east and weakened as depicted in Figure 1. Winds were briefly hurricane force near Cape Farewell. Among limited ship data, the Godafoss (V2XM) reported west winds of 50 kt near 58N 29W at 1800 UTC on the 4th. There were some impressive seas that developed between Iceland and the British Isles. The Waverider (TFSRT) reported 10.5 m (34 ft) near Iceland at 1300 UTC January 4. Among buoys, the highest seas reported were 9.5 m (31 ft) at 62108 (53.5N 19.5W) at 2200 UTC on the 4th, 10.0 m (33 ft) at 62105 (55N 12W) at 0400 UTC on the 5th, 12.0 m (40 ft) at 64045 (59N 11.5W) 0000 UTC on the 5th, and 10.5 m (35 ft) at 64046 (61N 5W) at 0400 UTC on the 5th.
|
|
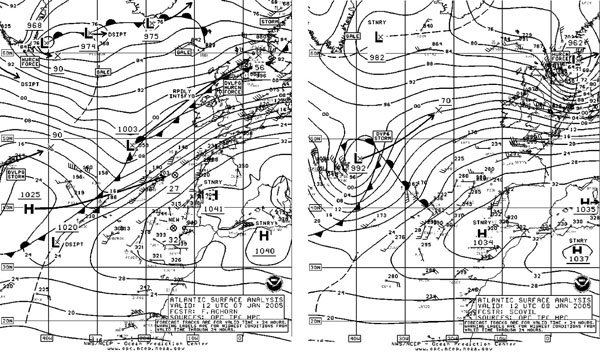

North Sea Storm, January 7-8: Figure 1 shows the explosive development of this hurricane-force storm from a flat frontal wave of low pressure over the twenty-four hour period ending at 1200 UTC January 8. This was the most significant event of the period for that area. The central pressure dropped 41 hPa in that period, with the second part of Figure 1 showing the storm at maximum intensity. A 500 hPa analysis (Figure 2), valid in the middle of this period of rapid deepening, shows good support in the form of a strong short-wave trough developing negative tilt and a strong jet of at least 110 kts. See Reference 1 for more information on the use of 500 hPa charts such as those broadcast by OPC through the USCG. The cyclone then passed quickly inland over Scandinavia later on the 8th. Maximum winds were observed around map time in the second part of Figure 1. The Noble Ton Van Langeveld (A8BP2) (58N 8E) reported a northwest wind of 64 kts and 9.0 m seas (29 ft). Sedco 711 (ELBU6) near 57N 1E encountered northwest winds of 89 kts and 10.0 m seas (32 ft). Three hours earlier, the data buoy 62414 (53.8N 2.9E) reported southwest winds of 66 kts, and buoy 62159 (56.5N 2.4E) reported 65-kts west winds three hours after map time. The buoy 62116 (57.7N 1.4E) reported a lowest pressure of 960.4 hPa at 1000 UTC on the 8th, and a 45-kts northwest wind one hour later. Seas reached 9.5 m (31 ft) at buoy 62120 (56.4N 2.1E) 1500 UTC January 8.
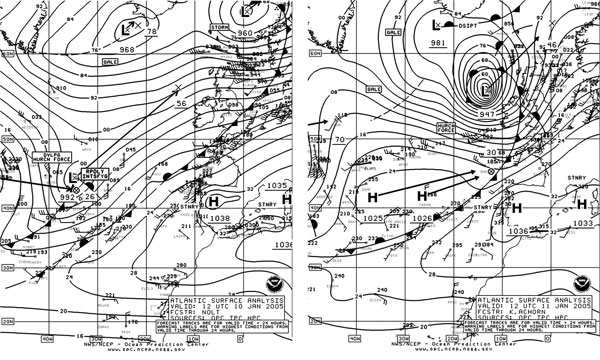 |
Figure 3. OPC North Atlantic Surface Analysis charts (Part 1) valid 1200 UTC valid 1200 UTC January 10 and 11, 2005. |
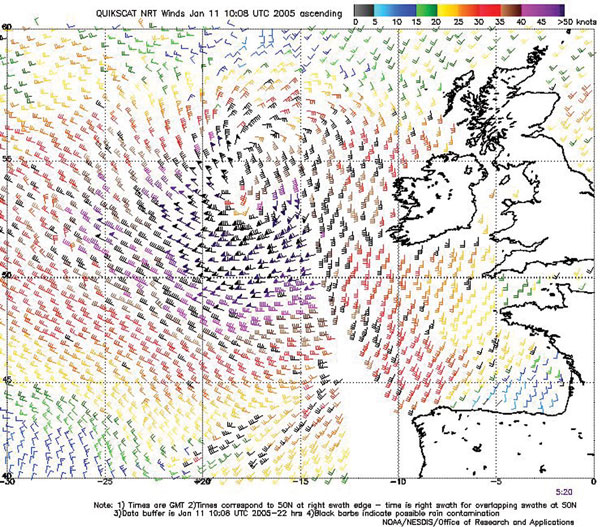
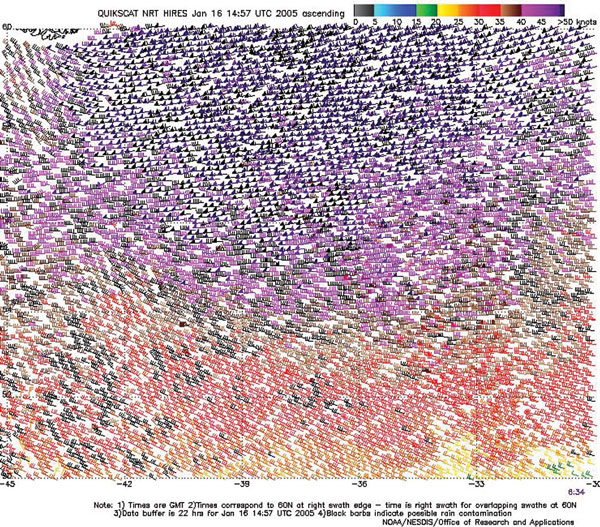
Eastern North Atlantic Storm of January 10-12: This storm was the second most intense of the period in the North Atlantic (in terms of central pressure) and likely packed the strongest winds. Figure 3 displays the most rapid phase of development, in which the central pressure fell 45 hPa in the twenty-four hour period. The central pressure bottomed out at 946 hPa (27.94 in) six hours later. The infrared satellite image of Figure 4 shows the storm at maximum intensity with a broad "comma head" of high-topped clouds and well-developed cloud spiral around a well-defined center. Deep cumulus-type clouds appear to south where cold air is entering the circulation. The Noble Ton Van Langeveld (A8BP2) (58N 1E) encountered southwest winds of 65 kts and 10.5 m seas (34 ft) at 0000 UTC on January 12, while the Loch Rannoch (MYJG2) reported south winds of 60 kts near 61N 2W. The buoy 62105 (54.9N 12.4W) reported a southwest wind of 66 kts and 13.0 m seas (42 ft) at 1300 UTC on the 11th, with seas reaching 16.0 m (52 ft) five hours later. Buoy 63118 (60N 4W) reported northwest winds of 70 kts at 1200 UTC on the 12th. QuikSCAT imagery revealed stronger winds, up to 85 kts as shown in Figure 5. A higher-resolution version of this imagery showed even a 90 kts wind barb about seven hours after the map time of the second part of Figure 3. The storm subsequently continued on a northeastward track, moving inland over Norway late on the 12th.
|

North Atlantic Storm of January 11-14: The next storm system emerged off the coast of Newfoundland early on the 11th and took a track northwest of its predecessor and was not as intense, attaining a lowest central pressure of 964 hPa at 0000 UTC January 13. OPC classified this as a hurricane-force storm from 0600 UTC on the 12th until 1200 UTC on the 13th, mainly based on QuikSCAT winds in an area lacking ship reports. A high-resolution QuikSCAT image valid at 2200 UTC on the 12th revealed up to 65 kts on the west and southwest sides. The system subsequently weakened to a gale while passing across Iceland early on January 15.
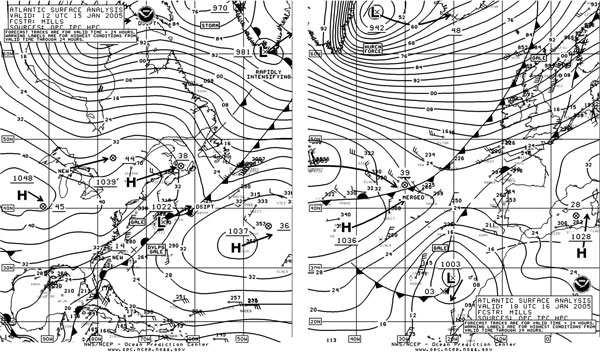
North Atlantic Storm of January 15-18: This storm evolved in a manner similar to that of the January 2-7 event. The developing cyclone moved northeast to near Cape Farewell early on the 15th and then rapidly intensified east of Greenland, developing a lowest central pressure of 942 hPa at 1800 UTC on the 16th, down 36 hPa over the preceding twenty-four hours (Figure 6). This was the most intense storm of the period, in both the North Atlantic and North Pacific. There were no ships reporting around the hurricane-force center, but the QuikSCAT image in Figure 7 reveals a large swath of storm-force winds east of 44W and up to 70 kts near the northern edge of the figure. Selected ship and buoy reports farther away from the center are listed in Table 1. The 16.5 m report from buoy 62108 was the second highest of the period in the North Atlantic. The storm moved northeast. The system then moved past Iceland late on the 17th and weakened, but like in the January 2-7 event, developed a new hurricane-force center near Greenland. This secondary low quickly became replaced by another low which had emerged off the southeast U.S. coast early on the 16th and was briefly at hurricane-force strength in the eastern Labrador Sea early on the 18th.
|
| OBSERVATION | POSITION | DATE/TIME (UTC) | WIND (kts) | SEAS (m/ft) |
| Waverider (TFSRT) | 63N 20W | 17/0000 | 9.0/30 | |
| Statengracht (PHAQ) | 48N 20W | 18/0000 | W 50 | 9.5/31 |
| Parkgracht (PGRE) | 45N 8W | 18/1200 | NW 35 | 9.5/31 |
| 62566 | 58.3N 19.3W | 16/1900 | W 50 | |
| 62108 | 53.4N 19.3W | 17/0600 | W 35 | 10.5/35 |
| 62108 | 53.4N 19.3W | 17/1900 | W 40 | 16.0/52 |
| 62108 | 53.4N 19.3W | 18/0400 | NW 35 | 16.5/54 |
| 62105 | 54.9N 12.3W | 17/1800 | W 30 | 13.0/43 |
| 62029 | 48.6N 12.6W | 18/0500 | NW 35 | 13.0/42 |
Table 1. Some ship and buoy observations taken during the storm of January 15-18, 2005.
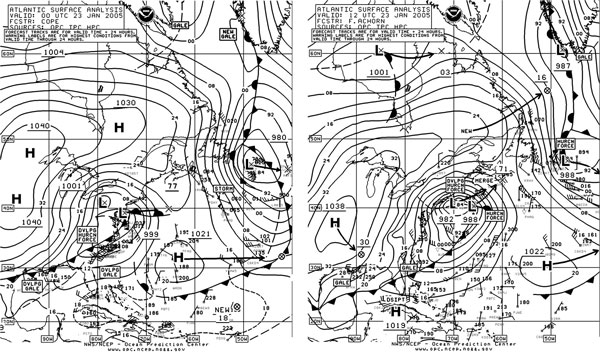 |
Figure 8. OPC North Atlantic Surface Analysis charts (Part 2) valid 0000 UTC and 1200 UTC January 23, 2005. |
Cutoff Storm, January 21-24: Development of blocking high pressure in the northeast Atlantic late in January led to lows moving north toward Greenland or cutting off to the south underneath the block. This storm did the latter, slowing down while passing southeast of Newfoundland late on the 22nd (Figure 8). The cyclone had moved off the mid-Atlantic U.S. coast early on the 21st. The storm briefly developed hurricane-force winds (See observations in Table 2) before turning southeast and weakening.
Coastal Storm of January 22-26: This storm was one of the most significant systems in the southwest North Atlantic during this period. Figure 8 covers the rapid development as a secondary coastal storm while the primary low weakened near the eastern Great Lakes. The central pressure fell 27 hPa in the twenty-four hour period ending at 1800 UTC January 23, impressive for that latitude. Although the storm later intensified to as deep as 966 hPa while passing north through the Davis Strait late on the 25th, the strongest winds were observed off the U.S. East Coast. Table 2 lists some ship and buoy observations taken early in this storm. The 70 kts ship report in Table 2 was supported by high-resolution QuikSCAT data for 2225 UTC on the 23rd, which revealed winds to 75 kts in that area.
| OBSERVATION | POSITION | DATE/TIME (UTC) | WIND (kts) | SEAS (m/ft) |
| Encounter (DPGZ) | 38.5N 64W | 24/0000 | W 55 | 11.5/37 |
| Godafoss (V2XM) | 42N 67W | 24/0000 | N 60 | |
| Finnpine (SFIR) | 42.5N 66W | 24/0000 | N 60 | 10.5/34 |
| Statengracht (PHAQ) | 38N 57W | 24/0600 | SE 70 | 12.0/40 |
| Charles Island | 41N 64W | 24/1200 | NW 55 | |
| Titus (SGAK) | 47N 47W | 23/1800 | NW 55 | 9.5/31 |
| Atlantic Companion (SKPE) | 45N 47W | 23/1800 | NW 45 | 12.0/39 |
| Platform | 46.7N 48.7 W | 23/0900 | NW 65 | |
| Henry Goodrich (HP6038) | 46.4N 48.4W | 23/1200 | NW 65 | |
| GSF Grand Banks (YJUF7) | 46.7N 48.7W | 23/1200 | NW55 | |
| 44141 | 43.0N 58.0W | 23/2200 24/0500 |
SE 39 Gust 47 | 5.0/16 7.5/25 |
Table 2. Ship, buoy and platform observations taken during the coastal storm of January 22-26, 2005 and the storm southeast of Newfoundland occurring at the same time. VEP717, HP6038 and YJUF7 are oil platforms.
North Atlantic Storms, February 6-9: A frontal wave of low pressure over the Grand Banks at 1800 UTC February 5 deepened by 46 hPa in the following twenty-four hours as it moved to the east side of Greenland, developing a central pressure of 966 hPa. The system deepened further to 952 hPa near 65N 31W at 0600 UTC on the 7th. At that time the Godafoss (V2XM) encountered west winds of 65 kt near 58N 34W, while the Irena Arctica (OXTS2) and Geysir (WCZ5528) reported west winds of 60 kts at 59N 44W and 57N 36W, respectively. The storm passed northwest of Iceland shortly thereafter and was quickly replaced by another storm (966 hPa) by 1200 UTC on the 8th, which had moved off the Labrador coast early on the 7th. The system then drifted toward Iceland and maintained hurricane-force winds near the Greenland coast for the following twenty-four hours and later became absorbed by another low passing to the south on the 11th.
North Atlantic Storm, February 12-16: This cyclone developed south of the Canadian Maritimes on the 12th and passed just east of Newfoundland near 50N 51W with a 980 hPa central pressure at 1800 UTC on the 13th, where Platform VEP717 (46.7N 48.7W) briefly encountered southwest winds of 75 kts. The storm is shown in Figure 9 passing west of Greenland but re-forming east of Greenland (second part of Figure 9), where hurricane-force winds lasted for the twelve-hour period ending at 0600 UTC on the 16th as the low passed to the northeast. The ship Bruarfoss (V2PS8) at 64N 23W reported west winds of 60 kts at 0600 UTC February 16.
|
|
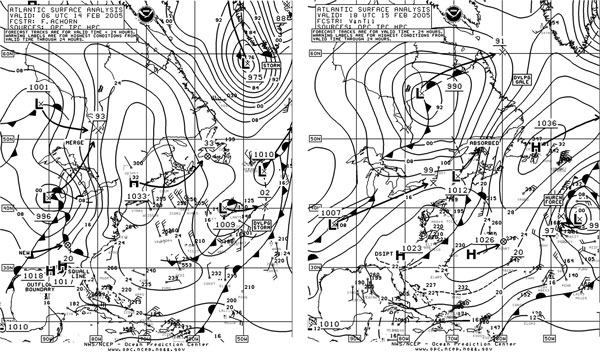

South-Central Storm, February 14-16: Figure 9 also shows the development of this relatively small but potent storm over the southern OPC high seas area. This storm was unusual in that it developed hurricane-force winds with a pressure of only 1002 hPa. Figure 10 contains high-resolution QuikSCAT data obtained for this storm using a different retrieval method (Reference 2) and shows a large area of 65 to as high as 80-kts winds west and northwest of the center. A drifting buoy (41540 at 40.9N 45.2W) reported north winds of 58 kts at 1000 UTC on the 15th and north winds of 54 kts and 12.5 m seas (41 ft) eight hours later. At 1200 UTC February 15, the ship Ada Gorthon (SLCI) (42.5N 45.8W) reported northeast winds of 60 kts. At 1800 UTC on the 15th the same ship reported north winds of 52 kts near 43N 46W, while to the south Mosel N (A8CI7) encountered west winds of 49 kts. The storm was cut off on February 15 and drifted west, weakening to a gale on the 16th. The system then moved north on the 17th and was absorbed by another low coming off Newfoundland.
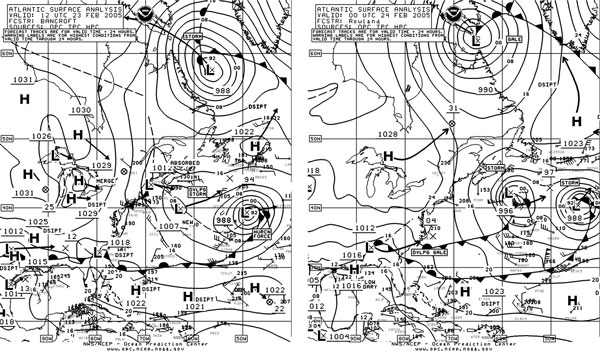 |
Figure 11. OPC North Atlantic Surface Analysis charts (Part 2) valid 1200 UTC February 23 and 0000 UTC February 24, 2005. |
South-Central Storms, February 22-25: Two hurricane-force lows developed in close succession while tracking east, south of the Canadian Maritimes. They were relatively compact and moved through areas of relatively abundant ship and buoy data. In Figure 11 the first low, the hurricane-force low near 39N 49W, originated near 40N 70W at 0000 UTC on the 22nd and is shown as the eastern low in the second part of Figure 11, with the second storm close behind. Selected ship and buoy observations are listed in Table 3, including several reports of over 9.0 m seas (30 ft). The two lows then turned northeast and merged into one storm near 44N 42W by the 25th, before turning southeast past the Azores on the 26th and weakening, blocked by high pressure to the north.
| OBSERVATION | POSITION | DATE/TIME (UTC) | WIND (kt) | SEAS (m/ft) |
| Lykes Explorer (WGLA) | 41N 60W | 24/0000 | W 65 | |
| Galveston Bay (WPKD) | 37N 55W | 24/0000 | W 50 | |
| Galveston Bay (WPKD) | 37N 57W | 24/0600 | NW 45 | 9.5/31 |
| Sea-Land Independence (WGJC) | 43N 43W | 24/0600 | E 50 | 11.5/38 |
| Galveston Bay (WPKD) | 37N 59W | 24/1200 | NW 45 | 11.0/36 |
| Fairlift (PJHF) | 40N 53W | 24/1800 | NW 55 | |
| Fidelio (WQVY) | 35N 44W | 25/0600 | NW 55 | 12.0/40 |
| Fidelio (WQVY) | 35N 45W | 25/1200 | NW 50 | 13.0/43 |
| Buoy 41540 | 42N 44W | 24/0000 | E 70 |
Table 3. Some ship and buoy observations taken during the storms of February 22-25, 2005.
Coastal Storm, March 8-9: This storm was short-lived but intense, originating as a frontal wave of low pressure approaching the mid-Atlantic coast of the U.S. at 0600 UTC March 8. The low explosively deepened after passing offshore, with the central pressure falling 29 hPa in the twenty-four hour period ending at 0600 UTC on the 9th. The central pressure reached 962 hPa in the Gulf of Maine, before the storm moved inland and weakened over Quebec on the 9th. At 1800 UTC March 8 the ship Maurice Ewing (WLDZ) (37N 71W) reported south winds of 60 kts. Later, Maurice Ewing (WLDZ) (38N 71W) and Manon (SIWN) (38N 70W) reported west winds of 60 kt at 0000 UTC and 0600 UTC March 9, respectively. The buoy 41001 (34.7N 72.7W) reported south winds of 41 kts with gusts to 56 kts and 7.0 m seas (23 ft) at 1700 UTC on the 8th, with maximum significant wave heights of 10.0 m (33 ft) at 2300 UTC on the 8th. To the north, buoy 44004 (38.5N 70.5W) had northwest winds of 43 kts with gusts to 54 kts at 0100 UTC on the 9th, and a peak gust of 62 kts from the south at 2100 UTC March 8. Maximum seas were 9.5 m (31 ft) at 0400 UTC on the 9th. Gulf of Maine buoy 44005 (43.2N 69.2W) reported northwest winds of 41 kts with gusts to 51 kts and 5.5 m seas (18 ft) at 0700 UTC on the 9th. The C/MAN station Duck Pier (DUCN7 at 36.2N 75.7W) reported northwest winds of 38 kts with gusts to 45 kts, and a peak gust 65 kt, at 1800 UTC on the 8th.
North Atlantic Storm, March 11-23: This long-lasting event began as depicted in Figure 12, as a low moving out of the subtropics that rapidly intensified to hurricane force by 1800 UTC March 11. The hurricane-force storm is shown east of Newfoundland twelve hours later, and the central pressure was 965 hPa. At that time Platform VEP717 (46.7N 48.7W) encountered northwest winds of 65 kts, while the vessel Star Indiana (S6BE) (42N 44W) reported southwest winds of 60 kts. The storm then stalled over the central North Atlantic early on the 13th, as the developing storm seen in Figure 12 south of New England merged with the older system on the 13th. The combined system attained a central pressure as low as 955 hPa late on the 14th, with the circulation covering much of the North Atlantic. The system broke up into multiple centers rotating around a mean central center, occasionally producing brief hurricane force winds near the Greenland coast until the 19th. The complex system slowly wound down until the 24th when a new storm to the south took over. What is left at 0000 on the 24th appears in Figure 13 north of the hurricane force low.
|
|

South-Central Storm, March 22-25: The development of this storm is shown in Figure 13, with the center deepening by 26 hPa in the first twenty-four hours. The second part of Figure 13 shows the system near maximum intensity when the ship Desh Shakti (AUCU) near 35N 34W reported west winds of 70 kts. The author is unsure of the reliability of this report, as high-resolution QuikSCAT imagery received 16 hours prior showed 50 to 70 kts winds mainly north of 35N. Aside from this report, the strongest wind reported from a ship was a west wind of 55 kts from Santa Lucia (PBFC) (39N 38W) at 1800 UTC March 23. Reported seas were 10.0 m (33 ft). The storm then weakened to a gale on the 25th while drifting northeast, before stalling near France.
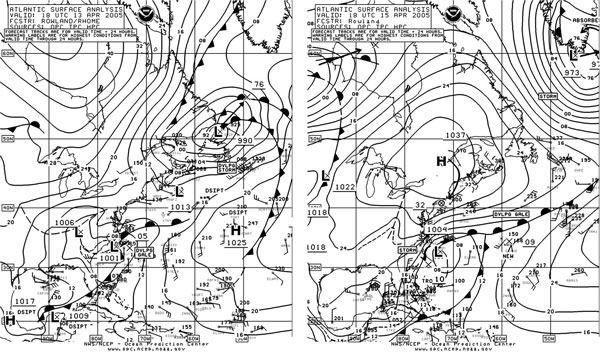 |
Figure 14. OPC North Atlantic Surface Analysis charts (Part 2) valid 1800 UTC April 13 and 15, 2005 (Part 1). |
Coastal and Offshore Storm of April 14-16: This event began as a coastal redevelopment of an inland low, as shown in the first part of Figure 14. The center moved offshore and became a storm near 33N 74W at 0000 UTC April 15, stalled, and then looped to the south on the 16th, blocked by strong high pressure to the north. Although the lowest pressure was only 1000 hPa, the storm was remarkable for the seas generated with north to northeast winds to 55 kts opposing the Gulf Stream, including the highest seas reported during the four-month period in the North Atlantic. There were several reports of seas over 40 ft (12 m) and are listed in Table 4 below. The storm then weakened to a gale near 31N 70W at 0000 UTC on the 17th and reformed as a new center near 36N 61W, which moved off to the northeast before stalling in the central North Atlantic.
| OBSERVATION | POSITION | DATE/TIME (UTC) | WIND (kt) | SEAS (m/ft) |
| Galveston Bay (WPKD) | 39N 68W | 15/1800 | NE 51 | 11.5/37 |
| Zim Iberia (4XFP) | 34N 77W | 15/1800 | NE 55 | 11.5/37 |
| Lykes Explorer (WGLA) | 36N 75W | 15/1800 | N 45 | 6.5/21 |
| Buoy 41001 | 35N 71W | 16/0000 | NE 35 | 7.5/25 |
| SHIP | 32.7N 76.5W | 16/1200 | N 50 | 11.5/38 |
| SHIP | 33N 77W | 16/1200 | N 35 | 6.0/19 |
| SHIP | 33.5N 76.4W | 16/1800 | N 50 | 13.5/44 |
| SHIP | 33.2N 75.8W | 16/1800 | N 50 | 17.0/56 |
| Hoechst Express (DHER) | 34.3N 75.9W | 16/1800 | N 55 | 8.0/26 |
| Green Dale (WCZ5238) | 33.5N 77.5W | 16/1800 | NE 35 | 4.5/15 |
| SeaLand Producer (WJBJ) | 36N 71W | 17/0000 | NE 40 | 13.0/42 |
| SHIP | 34N 75W | 17/0600 | NE 35 | 9.0/29 |
References
1. Sienkiewicz, J. and Chesneau, L., Mariner's Guide to the 500-Millibar Chart (Mariners Weather Log, Winter 1995).
2. Smith, Deborah K. and Wentz, Frank, Remote Sensing Systems, Santa Rosa, CA (E-mail communication through Sienkiewicz, Joseph (OPC), February 18, 2005).
Page last modified: