Mean Circulation Highlights and Climate Anomalies
January through April 2005
A. James Wagner, Senior Forecaster,
Climate Operations Branch, Climate Prediction Center /NCEP/NWS/NOAA.
JANUARY - FEBRUARY 2005
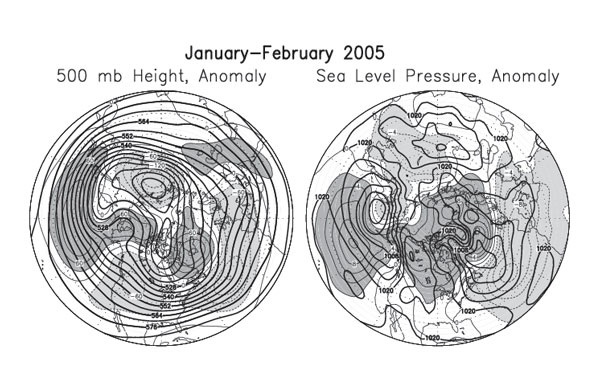
The circulation pattern over the Northern Hemisphere during January and February was characterized by strong high latitude blocking, as reflected in an extensive area of above normal 500 hPa height with positive anomaly centers located over southern Greenland and over the Arctic Ocean on the Siberian side of the Pole. At the surface this was manifested in high pressure of more than 8 hPa above normal centered over the Arctic Ocean under the mid-tropospheric anomaly, with a connecting area of higher than normal surface pressure extending southward from the Arctic to the Great Lakes area. Deeper than normal troughs aloft, above strong mean low pressure areas at the surface, were located over the middle latitudes of the central Pacific and over the western Atlantic just to the south of the Canadian Maritimes. A relatively intense mid-tropospheric trough and lower than normal surface pressure were also located over eastern Europe and western Russia. This type of pattern is described as having strongly negative phases of both the Arctic Oscillation (AO) and North Atlantic Oscillation (NAO).
|
As is typical when this type of pattern occurs during the winter, there were extensive areas of below normal temperature over the northeastern United States and Europe, with cyclonic activity concentrated mainly in the areas of below normal SLP over the central Pacific and the western Atlantic. The Atlantic cyclonic center was strongest in January and the Pacific one was the most intense in February. The abnormally cold weather was especially noteworthy over New England during January, continuing a pronounced cold spell that began during December. The mildest weather relative to normal was located over the southern Great Plains in January, as hinted by the slightly enhanced southerly component in the anomalous geostrophic wind implied by the 500 hPa height anomaly field (Figure 1), although in February the coldest conditions relative to normal were found across the southern tier of states from southern California to Georgia and the Carolinas. Temperatures averaged slightly above normal across the northern border states from Washington to Minnesota during February, while a strong reversal in temperature anomalies occurred over Alaska, going from well below normal during January to as much as 10F above normal in the eastern interior of the state during February.
Offshore anomalous surface flow over much of the Atlantic Seaboard was associated with relatively dry conditions in both January and February, with a general lack of heavy snowstorms in spite of the cold weather. The Florida Peninsula and the southern Plains had heavier than normal precipitation totals in both months, as would appear reasonable in the light of the stronger than normal southerly component in the 500 hPa flow over the southwestern part of the country, and a somewhat enhanced subtropical jet stream in February. However, the wet weather in Florida appears to have been primarily related to frequent showers in the return flow of Arctic air flowing southward off the Atlantic Coast and becoming unstable after being moistened and heated over the relatively warm waters of the Gulf Stream. During February, when the trough over the West was strongest, most locations both along the Pacific Coast and in the interior Southwest reported above average precipitation.
MARCH - APRIL 2005
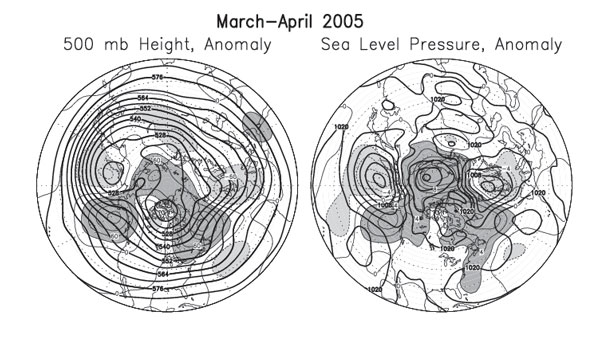
During March and April, both the Canadian and Siberian lobes of the polar vortex became somewhat stronger than normal, although blocking continued over much of the Arctic Basin, Barents Sea and northeastern Atlantic. Both the Bermuda High and the eastern Pacific ridge became stronger than normal, and with Arctic air confined to higher latitudes, temperatures averaged well above normal over most of the United States during March, with a reversion to slightly below normal in the Gulf coast area from Texas to Florida during April. During March, when the eastern Pacific ridge was at its strongest and extended into the West, many record high temperatures for the month, and for so early in the season, were set over the Southwest, accompanied by very dry weather that caused an unusually rapid melting of the snowpack in the mountains and an early outbreak of wildfires.
|
Significant storms during March were confined mostly to the middle of the United States, where the moisture brought welcome relief to some areas with incipient drought conditions. In April, precipitation became more widespread over the Southwest and the Northeast, after both areas were unusually dry in March. Most of the Midwest became drier than normal during April. The variations in the climate during March and April were not all obvious from the map that averaged the two months (Figure 2), due to considerable variability during this period.
THE TROPICS
The first four months of 2005 featured a continuation of neutral ENSO conditions, with equatorial SSTs slightly below normal over the eastern Pacific and more noticeably above normal near and just west of the Dateline. Atmospheric indices that measure the status of ENSO averaged close to normal values. As is often the case with a near neutral ENSO, the Madden-Julian Oscillation (MJO) was fairly active over the eastern Indian and western Pacific Oceans. The MJO waves did not propagate strongly east of the Dateline due to the cooler than normal SSTs that were unable to support active convection. However, it is believed that MJO activity did modulate the circulation over the Pacific during much of the winter, contributing to reversals in the phase of the Pacific/North American Pattern (PNA) that caused significant intra-seasonal variations in temperature and precipitation over the United States. The overall perception was that the climate was somewhat more variable than usual during the first four months of 2005.
There is good evidence that the first hurricane ever recorded in the South Atlantic Ocean occurred during March. Satellite visible imagery showed a well-defined eye, and wind gusts of up to 90 mph were observed near the location of landfall. The storm was named Catarina, after the Brazilian province where it made landfall.
Figure legends and description of units:
The charts show the seasonal mean 500 hPa height contours at 60 m intervals in heavy solid lines, with alternate contours labeled in decameters (dm). Positive height anomalies are contoured in light solid lines at 30 m intervals, and negative height anomalies are shown by light dashed lines. Areas of mean height anomalies greater than 30 m above normal have heavy shading, and areas of mean height anomalies of more than 30 m below normal have light shading.
Also, the charts show the seasonal mean sea level pressure (SLP) at 4 hPa intervals in heavy solid lines, labeled in hPa at selected intervals. Anomalies of SLP are contoured in light lines at 2 hPa intervals, with dark shading and solid lines in areas more than 2 hPa above normal, and light shading with dashed lines in areas greater than 2 hPa below normal.
Page last modified: