Atlantic Hurricane Season of 2004
Jack Beven and James Franklin, National Hurricane Center/Tropical Prediction Center, NOAA/NWS Miami, FLIntroduction
The 2004 Atlantic hurricane season was among the most devastating on record. The year's storms claimed over 3,100 lives, the second largest toll in three decades; 61 of these occurred in the United States. The United States suffered a record $44 billion in property damage from five hurricane landfalls (Charley, Frances, Gaston, Ivan, and Jeanne), and the eyewall crossing of a sixth (Alex). In addition, Bonnie, Hermine, and Matthew made landfall in the United States as tropical storms. Florida was battered by Charley, Frances, Ivan and Jeanne. Several islands of the Caribbean were also hard hit by Charley, Ivan, and Jeanne, particularly Grenada, Jamaica, Grand Cayman, Cuba, and Hispaniola. Additionally, the Bahamas were hit hard by Frances and Jeanne.
Fifteen named storms developed in 2004, including Nicole, a subtropical storm. Nine became hurricanes and six became major hurricanes. One additional tropical depression did not reach storm strength. These totals are considerably above the long-term (1944-2003) means of 10.2 named storms, 6.0 hurricanes, and 2.6 major hurricanes. August alone saw the formation of eight tropical storms, a new record for that month. The season also featured several intense and long-lived hurricanes. Ivan, a category 5 storm on the Saffir-Simpson hurricane scale, reached a minimum pressure of 910 hPa, a value surpassed by only five other tropical cyclones in the Atlantic basin since 1851. In addition, Ivan was a major hurricane for a total of 10 days, a new record for a single storm since the most reliable records began in 1944.
Individual Storms
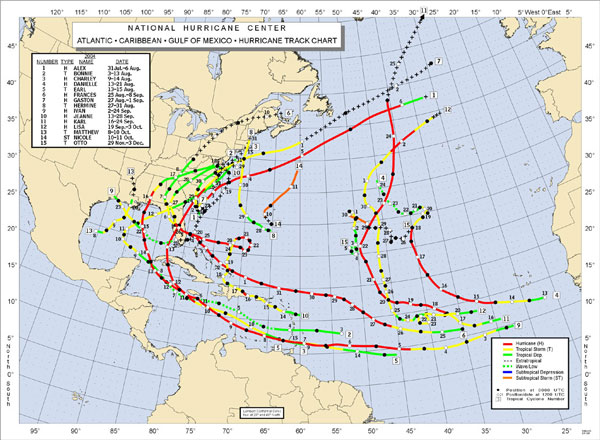
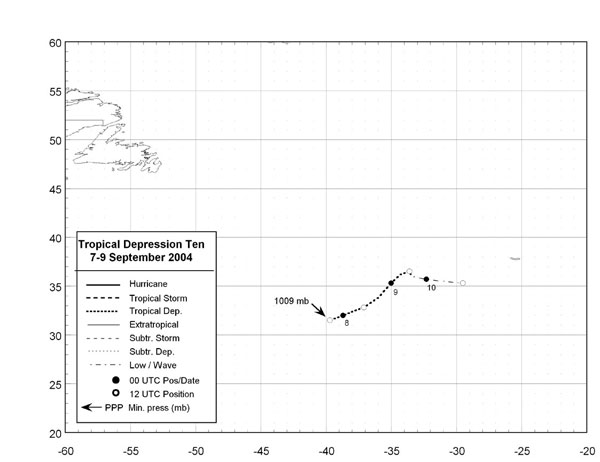
The vital statistics of the named storms of 2004 are given in Table 1, while the tracks are shown in Figure 1. The track of the tropical depression is shown in Figure 2. In the cyclone summaries given below, all dates are based on Universal Coordinated Time, although local time is implied with expressions such as "afternoon," "mid-day," etc.
|
| Name | Classa | Datesb | Maximum wind (kts.) | Minimum
pressure (hPa) |
Direct deaths | U.S. Damage
($ millions) |
| Alex | H | 31 Jul-6 Aug | 105 | 957 | 1 | 5 |
| Bonnie | TS | 3-13 Aug | 55 | 1001 | 3 | minorc |
| Charley | H | 9-14 Aug | 130 | 941 | 15 | 14000 |
| Danielle | H | 13-21 Aug | 95 | 964 | ||
| Earl | TS | 13-15 Aug | 45 | 1009 | ||
| Frances | H | 25 Aug-8 Sep | 125 | 935 | 8 | 8900 |
| Gaston | H | 27 Aug-1 Sep | 65 | 985 | 8 | 130 |
| Hermine | TS | 27-31 Aug | 50 | 1002 | ||
| Ivan | H | 2-24 Sep | 145 | 910 | 93 | 14200 |
| Jeanne | H | 13-28 Sep | 105 | 950 | 3000+ | 6900 |
| Karl | H | 16-24 Sep | 125 | 938 | ||
| Lisa | H | 19 Sep-3 Oct | 65 | 987 | ||
| Matthew | TS | 8-10 Oct | 40 | 997 | minorc | |
| Nicole | ST | 10-11 Oct | 45 | 986 | ||
| Otto | TS | 29 Nov-3 Dec | 45 | 995 |
Table 1. 2004 Atlantic Tropical/Subtropical Storms and Hurricanes
a Tropical (TS) or subtropical storm (ST): wind speed 34-63 kts.
Hurricane (H): wind speed 64 kts or higher.
b Dates begin at 0000 UTC and include tropical and subtropical
depression stages but exclude the extratropical stage.
c Only minor damage was reported, but the extent of the damage was
not quantified.
Hurricane Alex
Alex developed out of a broad area of low pressure that formed near the central Bahamas on 30 July. Associated thunderstorm activity gradually became better organized and the system became a tropical depression on 31 July about 175 nmi off the northeastern Florida coast. Drifting erratically, the depression strengthened to a tropical storm the following day when northeasterly shear over the cyclone decreased. Alex started to move northeastward early on 2 August, slowly approaching the coastline of the Carolinas over the next 36 hours. Alex strengthened, becoming a hurricane on 3 August when it was centered about 65 nmi south-southeast of Cape Fear. Aided by warm Gulf Stream waters and light shear, Alex continued to strengthen during the day as it neared the North Carolina Outer Banks. Alex made its closest approach to land near midday, with its center located about 9 nmi southeast of Cape Hatteras, North Carolina, while the western eyewall of the hurricane raked the Outer Banks with sustained category 1 hurricane force winds. During this close approach the hurricane's category 2 winds remained just offshore. After passing the Outer Banks, Alex accelerated into the open Atlantic, becoming a major hurricane on 5 August about 385 nmi south-southwest of Halifax, Nova Scotia with maximum winds estimated at 105 kts. Only Hurricane Ellen of 1973 attained major hurricane status at a higher latitude. Alex then proceeded to weaken over colder waters and became extratropical on 6 August.
Shipping avoided the core of Alex. Selected ship reports from the outer circulation are included in Table 2. The most significant observation was from the Charles Island (C6JT), which reported winds of 50 kts at 0000 UTC 4 August. On the coast, sustained winds of 67 kts with a gust to 91 kts were reported at Hatteras Village, North Carolina at 1814 UTC 3 August. It should be noted that the National Atmospheric and Oceanographic Administration (NOAA) Buoy 41025 near Diamond Shoals, North Carolina broke loose from its moorings as the core of Alex passed over it.
| Date/Time
(UTC) |
Ship call sign/name | Latitude (°N) | Longitude (°W) | Wind dir/speed
(kts) |
Pressure (hPa) |
| 02 / 1200 | Buoy 30408 | 32.5 | 78.7 | 010 / 37 | 1003.0 |
| 03 / 0000 | Buoy 30408 | 32.5 | 78.7 | 010 / 37 | 1003.0 |
| 04 / 0000 | Charles Island | 33.0 | 72.3 | 180 / 50 | 1010.0 |
| 04 / 1800 | Enterprise | 36.0 | 67.9 | 240 / 40 | 1004.1 |
| 04 / 2100 | Enterprise | 36.4 | 68.3 | 240 / 40 | 1003.5 |
| 05 / 1200 | OOCL Fortune | 35.7 | 59.9 | 220 / 36 | 1012.6 |
| 05 / 1500 | Sealand Developer | 39.3 | 55.9 | 210 / 40 | 1015.8 |
| 05 / 1800 | Sealand Developer | 39.3 | 56.5 | 230 / 35 | 1007.1 |
| 05 / 1800 | Zim Pacific | 39.7 | 48.3 | 200 / 37 | 1014.0 |
| 05 / 2100 | Choyang Phoenix | 37.7 | 56.5 | 230 / 35 | 1011.0 |
| 06 / 1200 | Hansa India | 43.0 | 42.3 | 240 / 40 | 1010.5 |
Table 2. Selected ship and drifting buoy reports with winds of at least 34 kts for Hurricane Alex, 31 July-6 August.
Tropical Storm Bonnie
Bonnie developed from a tropical wave, becoming a tropical depression on 3 August about 360 nmi east of Barbados in the Lesser Antilles. The depression moved rapidly westward and did not maintain a closed surface circulation. The system degenerated to an open wave the next day in the eastern Caribbean Sea, but a depression redeveloped from it four days later about 100 nmi southeast of the western tip of Cuba. The depression moved west-northwestward and became a tropical storm near the northeastern tip of the Yucatan Peninsula the next day. Bonnie moved into the central Gulf of Mexico and then turned northeastward on 11 August, reaching its maximum intensity of 55 kts later that day. Strong southwesterly wind shear then became established over the cyclone, causing weakening. Bonnie made landfall just south of Apalachicola, Florida, during the afternoon of 12 August with maximum sustained winds of 40 kts winds. The cyclone weakened to a tropical depression over land and moved northeastward across eastern Georgia and the Carolinas. Bonnie degenerated to a weak area of low pressure near Cape Cod on 14 August.
The strongest marine winds reported in Bonnie were from NOAA buoy 42001, which reported sustained winds of 51 kts with a gust to 66 kts at 1440 UTC 11 August. Two ships also reported tropical-storm force winds. The Celebration (H3GQ) reported winds of 40 kts at 1800 UTC 10 August, while with the Schackenborg (ZCIH7) reported sustained winds of 37 kts at 0900 UTC that same day.
Bonnie had little impact on the Florida coast. However, it caused 30 tornadoes over the southeastern United States, one of which caused three deaths in North Carolina.
Hurricane Charley
Charley originated from a tropical wave, developing into a tropical depression on 9 August about 100 nmi south-southeast of Barbados. The depression strengthened within a low-shear environment to a tropical storm early the next day in the eastern Caribbean, and became a hurricane on 11 August just south of Jamaica. Charley's center passed about 15 miles northeast of Grand Cayman as the hurricane reached category 2 strength on 12 August. Charley turned to the north-northwest and continued to strengthen, making landfall in western Cuba as a category 3 hurricane with 105 kts maximum winds. Charley weakened slightly after its passage over western Cuba; its maximum winds were about 95 kts when the center reached the Dry Tortugas around 8 am EDT on 13 August.
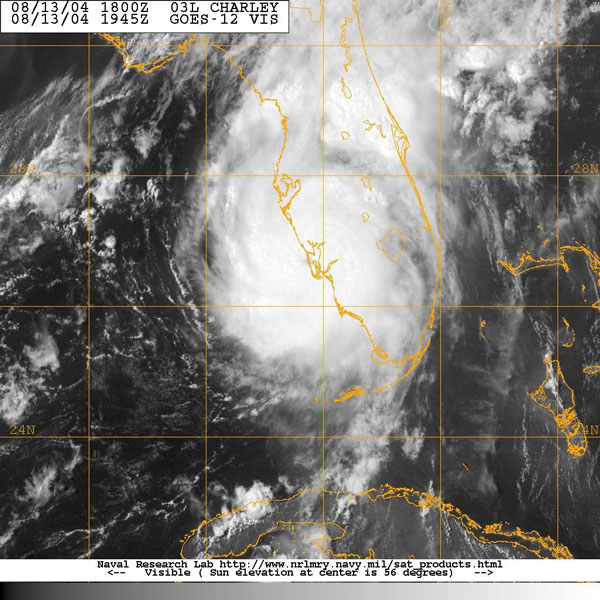 |
Figure 3. GOES-12 visible image of Hurricane Charley at 1945 UTC 13 August 2004. Image courtesy of the Naval Research Laboratory, Monterey, CA |
Charley then came under the influence of an unseasonably strong mid-tropospheric trough that covered the east-central United States and the eastern Gulf of Mexico. The hurricane turned north-northeastward and accelerated toward the southwest coast of Florida, intensifying rapidly as it did so. Reports from Air Force Reserve Hurricane Hunter aircraft indicate that Charley's central pressure fell from 964 hPa to 941 hPa in the last 4.5 hours before landfall near Captiva Island, Florida, with maximum sustained winds increasing to 130 kts-a category 4 hurricane (Figure 3). The center of the unusually small hurricane then crossed the Florida peninsula, passing near Punta Gorda, Kissimmee, and Orlando. Charley was still a hurricane around midnight 14 August when its center cleared the northeastern coast of Florida near Daytona Beach. After moving into the Atlantic, Charley came ashore again near Cape Romain, South Carolina near midday on 14 August with maximum sustained winds near 70 kts. The center then moved just offshore before making a final landfall at North Myrtle Beach, South Carolina with maximum sustained winds near 65 kts. Charley weakened to a tropical storm over southeastern North Carolina and became extratropical on 15 August as it moved back into the Atlantic near Virginia Beach, Virginia.
Several ships encountered Charley (Table 3), but none were hit by the small, but intense, inner core of the hurricane. The highest winds were from the Edyth L (C6YC), which reported 55 kts at 0900 UTC 13 August. Additionally, NOAA buoy 41004 reported sustained winds of 43 kts with a gust to 64 kts at 1250 UTC 14 August. Among the various coastlines affected by Charley, Playa Baracoa, Cuba reported sustained winds of 103 kts with a gust to 130 kts at 0530 UTC 13 August. Charley destroyed the NOAA Coastal Marine Automated Network (C-MAN) station at Dry Tortugas, Florida, before it could report the worst observed conditions. Many stations along the storm track across the Florida Peninsula were damaged and did not report the strongest winds.
| Date/Time
(UTC) |
Ship call sign/name | Latitude (°N) | Longitude (°W) | Wind dir/speed
(kts) |
Pressure (mb) |
| 10 / 2100 | Name Unknown
(WCZ523) |
16.1 | 70.2 | 110 / 47 | 1010.0 |
| 11 / 0100 | Buoy 41545 | 22.1 | 71.1 | NA / 39 | 1018.7 |
| 13 / 0900 | Edyth L | 23.4 | 82.0 | 160 / 55 | 1008.0 |
| 14 / 0600 | Sheila McDevitt
(WDA406) |
29.1 | 77.4 | 130 / 35 | 1018.0 |
| 14 / 1200 | Sheila McDevitt
(WDA406) |
28.9 | 78.6 | 150 / 35 | 1017.1 |
| 14 / 1500 | Lykes Navigator | 31.7 | 77.6 | 180 / 38 | 1018.3 |
| 15 / 0300 | APL Egypt (A8BZ6) | 37.0 | 74.6 | 220 / 42 | 1017.0 |
Table 3. Selected ship and drifting buoy reports with winds of at least 34 kts for Hurricane Charley, 9-14 August 2004.
The total U. S. damage is estimated to be near $14 billion, making Charley the third costliest hurricane in U.S. history. Charley was directly responsible for ten deaths in the United States. There were also four deaths in Cuba and one in Jamaica.
Hurricane Danielle
A vigorous westward-moving tropical wave moved across the west coast of Africa early on 12 August, and spawned a tropical depression on 13 August about 450 nmi southeast of the Cape Verde Islands. The cyclone strengthened quickly, becoming a tropical storm on 14 August and a hurricane the next day. Danielle spent its lifetime over the open waters of the central Atlantic, reaching a peak intensity of 95 kts on 16 August before weakening and ultimately degenerating into a non-convective remnant low pressure system on 21 August.
There were no ship or land reports of tropical-storm force or greater winds from Danielle.
Tropical Storm Earl
Earl was a short-lived tropical storm that formed from a tropical wave on 13 August about 1,000 nmi east of the Windward Islands. It moved quickly westward and became a tropical storm the next day. Earl crossed the Windward Islands on 15 August as it reached its estimated peak intensity of 45 kts. It then weakened rapidly, degenerating to an open tropical wave later that day over the eastern Caribbean Sea.
There were no ship reports of winds of tropical-storm force associated with Earl while it was a tropical cyclone. After Earl degenerated to an open wave, however, two ships reported tropical storm force winds associated with the fast-moving wave over the central Caribbean Sea. The Buffalo Soldier (WWXB) reported 35 kts east winds on 17 August just north of Colombia, while ship Maersk Newark (A8CF2) reported 37 kts east winds on 16 and 17 August just south of Haiti. There were no reports of tropical-storm force winds from the Windward Islands due to Earl, and only minor damage was reported there.
Hurricane Frances
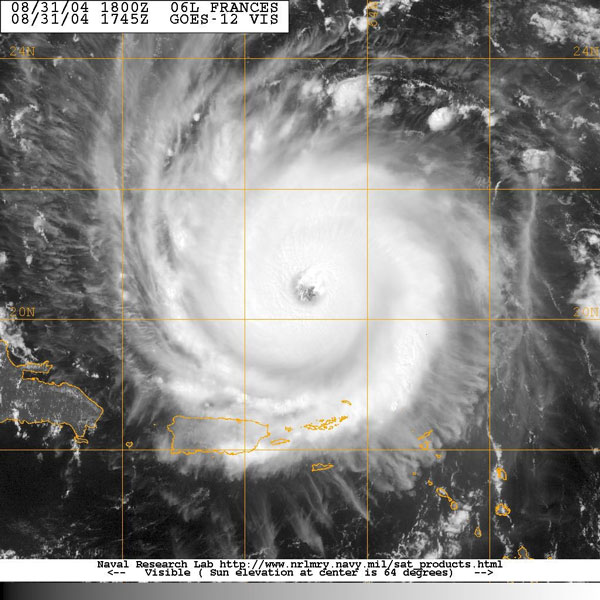 |
Figure 4. GOES-12 visible image of Hurricane Frances at 1745 UTC 31 August 2004. Image courtesy of the Naval Research Laboratory, Monterey, CA |
Frances developed from a tropical wave, becoming a tropical depression on 25 August 655 nmi west-southwest of the southern Cape Verde Islands, a tropical storm later that day, and a hurricane the following day. Frances moved generally west-northwestward for the next several days, passing north of the Leeward Islands on 31 August (Figure 4) and just north of the Turks and Caicos Islands on 2 September. During this time, maximum sustained winds reached 125 kts (category 4) on two occasions, with a reconnaissance aircraft measuring a minimum central pressure of 935 hPa. Westerly wind shear then caused Frances to weaken to a category 2 hurricane by the time it passed over the northwestern Bahamas on 4 September. The hurricane made landfall near Stuart, Florida just after midnight on 5 September with 90 kts (category 2) maximum winds. Frances gradually weakened as it moved slowly across the Florida peninsula, and became a tropical storm just before emerging into the northeastern Gulf of Mexico early on 6 September. Frances made a final landfall in the Florida Big Bend region that afternoon as a tropical storm. It subsequently weakened over the southeastern United States and became extratropical over West Virginia on 9 September.
Shipping mostly avoided Frances as it crossed the Atlantic, although some ships encountered the outer part of the large circulation (Table 4). The highest winds reported were 43 kts from ship Mariner of the Seas (C6FV9) at 1200 UTC 5 September. Two drifting buoys reported sustained winds of 78 kts, although the reliability of these reports is uncertain. Elsewhere, Eleuthera in the Bahamas reported sustained winds of 87 kts at 1000 UTC 3 September, while Port Mayaca, Florida reported sustained winds of 74 kts at 0500 UTC 5 September.
| Date/Time (UTC) | Ship call sign/name | Latitude (°N) | Longitude (°W) | Wind dir/speed (kts) | Pressure (hPa) |
| 01 / 0700 | Buoy 41544 | 23.0 | 66.7 | 090 / 37 | 1010.4 |
| 01 / 1600 | Buoy 41544 | 23.1 | 66.7 | 090 / 41 | 1015.2 |
| 01 / 1601 | Buoy 41927 | 23.6 | 70.1 | 080 / 93 | 1010.9 |
| 02 / 0000 | Buoy 41543 | 24.0 | 70.7 | 100 / 39 | 1008.1 |
| 02 / 0000 | Buoy 41539 | 24.4 | 69.1 | 090 / 35 | 1012.9 |
| 02 / 0000 | Buoy 41545 | 24.4 | 70.4 | 090 / 39 | 1011.0 |
| 02 / 0307 | Buoy 41922 | 22.2 | 71.9 | NA / 35 | 955.2 |
| 02 / 0400 | Buoy 41543 | 24.1 | 70.7 | 120 / 49 | 1009.7 |
| 02 / 0600 | Anke-Angela | 26.9 | 72.1 | 090 / 36 | 1016.0 |
| 02 / 0700 | Buoy 41545 | 24.4 | 70.4 | 110 / 37 | 1010.8 |
| 02 / 0727 | Buoy 41925 | 22.9 | 71.7 | 130 / 70 | 989.3 |
| 02 / 0906 | Buoy 41934 | 24.6 | 72.0 | NA / 78 | N/A |
| 02 / 0910 | Buoy 41939 | 22.2 | 71.2 | NA / 52 | N/A |
| 02 / 1800 | Buoy 41542 | 27.6 | 69.6 | NA / 58 | 1016.0 |
| 02 / 1841 | Buoy 41927 | 23.6 | 70.1 | NA / 41 | N/A |
| 03 / 0243 | Buoy 41926 | 23.1 | 69.1 | 140 / 35 | 1014.6 |
| 03 / 0700 | Buoy 41541 | 24.6 | 76.6 | 320 / 49 | 986.7 |
| 03 / 0700 | Buoy 41542 | 27.6 | 69.6 | 130 / 51 | 1015.2 |
| 03 / 1800 | Buoy 41541 | 24.5 | 76.4 | 200 / 58 | 999.0 |
| 03 / 2000 | Buoy 41540 | 27.9 | 78.6 | NA / 78 | 1009.0 |
| 04 / 0227 | Buoy 41923 | 24.1 | 71.4 | NA / 49 | 1013.8 |
| 04 / 1900 | Buoy 41540 | 28.3 | 79.2 | NA / 49 | 998.3 |
| 05 / 0000 | Zim California | 29.0 | 77.6 | 100 / 35 | 1012.0 |
| 05 / 0600 | Saudi Abha | 26.8 | 76.4 | 140 / 37 | 1005.4 |
| 05 / 1200 | Mariner of the Seas (C6FV9) | 24.2 | 81.5 | 260 / 43 | 1004.0 |
| 05 / 1200 | Galveston Bay | 27.3 | 73.8 | 350 / 40 | 1013.0 |
| 05 / 1800 | SHIP | 25.0 | 83.4 | 270 / 39 | 1004.7 |
| 06 / 0000 | Maersk New Orleans | 29.1 | 78.4 | 120 / 35 | 1009.0 |
| 06 / 0900 | Name Unknown (KS004) | 25.8 | 80.1 | 170 / 37 | 1006.9 |
| 06 / 0900 | Chevron Arizona | 27.5 | 86.1 | 350 / 37 | 999.5 |
| 06 / 1500 | Heidelberg Express | 28.5 | 79.6 | 130 / 39 | 1011.8 |
| 06 / 1800 | Sea-Land Freedom | 30.1 | 79.7 | 160 / 36 | 1010.0 |
| 06 / 1800 | Nordon | 31.8 | 79.3 | 120 / 35 | 1013.0 |
| 07 / 0000 | Nordon | 31.4 | 80.4 | 120 / 37 | 1009.3 |
| 09 / 0300 | Nanticoke | 42.1 | 81.4 | 050 / 38 | 1014.0 |
| 09 / 1200 | Canadian Progress | 42.7 | 80.1 | 000 / 35 | N/A |
| 10 / 0600 | Carnival Victory (3FFL8) | 43.1 | 65.1 | 180 / 35.11 | 1018.0 |
Table 4. Selected ship and drifting buoy reports with winds of at least 34 kts for Hurricane Frances, 25 August-8 September 2004
Eight deaths resulted from the forces of the storm-seven in the United States and one in the Bahamas. U.S. damage is estimated to be near $8.9 billion, over 90% of which occurred in Florida. Widespread damage also occurred in the central and northwestern Bahamas.
Hurricane Gaston
Gaston developed slowly from an area of low pressure associated with a decaying frontal zone, and became a tropical depression on 27 August about 115 nmi east-southeast of Charleston, South Carolina. Drifting erratically, the depression became a tropical storm the next day and continued to strengthen as it began to move northward toward the coast. Gaston reached hurricane strength just before making landfall in South Carolina on the morning of 29 August between Charleston and McClellanville. The cyclone weakened as it moved across northeastern South Carolina, becoming a tropical depression late in the day. Gaston moved northeastward over North Carolina and across the Delmarva Peninsula on 30 August, and late in the day re-strengthened to a tropical storm as it moved back over water. Gaston accelerated east-northeastward and became extratropical on 1 September south of the Canadian Maritimes.
Several ships encountered Gaston, mainly during passage over the North Atlantic shipping lanes. A ship with call sign WYRG reported winds of 44 kts at 0600 UTC 1 September, while the Finnfighter (SBFC) twice reported winds of 45 kts after Gaston became extratropical. Near the coast, an automated station at South Capers Island, South Carolina reported sustained winds of 46 kts with a gust to 71 kts at 1124 UTC 29 August, along with a minimum pressure of 985.1 hPa at 1254 UTC that day.
Gaston produced widespread flooding across South Carolina, North Carolina, and Virginia. Rainfall totals exceeding 12 inches in the Richmond area, where flash floods killed eight people. Total U.S. damage is estimated to be near $130 million. Table 5 contains ship report information on Hurricane Gaston.
| Date/Time
(UTC) |
Ship call sign/name | Latitude (°N) | Longitude (°W) | Wind dir/speed
(kts) |
Pressure (hPa) |
| 29 / 0300 | APL Shanghai
(A8DO7) |
31.5 | 79.8 | 310 / 41 | 1006.0 |
| 29 / 0900 | Nedlloyd Holland | 31.9 | 79.6 | 270 / 38 | 1003.0 |
| 29 / 1800 | OOCL Freedom | 32.8 | 79.0 | 210 / 36 | 1006.7 |
| 30 / 1200 | Olivia Maersk
(OXKO2) |
33.9 | 76.6 | 200 / 35 | 1016.3 |
| 31 / 0000 | Amapola
(H9YY) |
36.5 | 75.1 | 170 / 36 | 1010.0 |
| 31 / 1900 | Saudi Tabuk | 40.6 | 68.9 | 130 / 37 | 1006.8 |
| 01 / 0600 | Independence
(WRYG) |
40.6 | 63.2 | 240 / 44 | 1006.8 |
| 01 / 0600 | Albert | 46.1 | 54.4 | 210 / 41 | 1010.3 |
| 01 / 1200 | Henry Goodrich | 46.4 | 48.4 | 210 / 43 | 1011.6 |
| 01 / 1200 | Platform (VEP717) | 46.7 | 48.7 | 210 / 43 | 1009.9 |
| 01 / 1500 | GSF Grand Banks
(YJUF7) |
46.8 | 48.0 | 210 / 40 | 1008.9 |
| 01 / 1800 | Henry Goodrich | 46.4 | 48.4 | 210 / 41 | 1008.2 |
| 01 / 1800 | Finnfighter | 47.3 | 41.8 | 220 / 45 | 1007.0 |
| 02 / 0000 | Platform (VEP717) | 46.7 | 48.7 | 170 / 38 | 1000.0 |
| 02 / 0000 | GSF Grand Banks
(YJUF7) |
46.8 | 48.0 | 180 / 35 | 1000.9 |
| 02 / 0600 | Finnfighter | 46.3 | 45.6 | 230 / 45 | 998.6 |
| 02 / 1800 | Star Ismene(LANT5) | 48.2 | 34.6 | 220 / 38 | 1000.0 |
Table 5. Selected ship reports with winds of at least 34 kts for Hurricane Gaston, 27 August-1 September 2004.
Tropical Storm Hermine
Hermine developed from the same decaying frontal system that spawned Hurricane Gaston. An area of showers detached from the front on 26 August and the next day a tropical depression formed about 200 nmi south of Bermuda. The cyclone moved toward the west-northwest, became a tropical storm on 29 August, and reached its estimated peak intensity of 50 kts on 30 August. The storm moved northward and began to gradually weaken under strong northerly wind shear caused by the outflow of Gaston. Hermine reached the southern coast of Massachusetts near New Bedford as a minimal tropical storm on 31 August, and became extratropical shortly thereafter.
NOAA buoy 44004 reported a wind gust to 38 kts at 2034 UTC 30 August. Hermine also brought wind gusts to tropical-storm force over eastern Massachusetts.
Hurricane Ivan
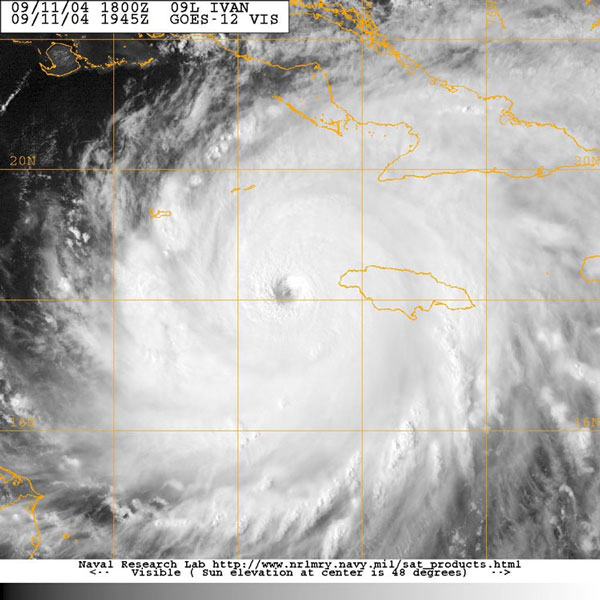 |
Figure 5. GOES-12 visible image of Hurricane Ivan at 1945 UTC 11 September 2004. Image courtesy of the Naval Research Laboratory, Monterey, CA |
Ivan developed from a large tropical wave that crossed the west coast of Africa on 31 August and spawned a tropical depression two days later. The depression reached storm strength on 3 September (one of only twelve on record to do so south of 10 N) and continued to strengthen. By 5 September, Ivan had become a hurricane about 1,000 nmi east of Tobago in the southern Windward Islands. Eighteen hours later, Ivan became the southernmost storm of record to reach major hurricane status, at 10.2 N. Ivan was a category 3 hurricane when its center passed just south of Grenada on 7 September, a path that took the northern eyewall of Ivan directly over the island. In the Caribbean, Ivan became a category 5 hurricane, with maximum sustained winds of 140 kts, on 9 September (while south of the Dominican Republic) and maximum sustained winds of 145 kts on 11 September (Figure 5). The minimum central pressure measured by Air Force Reserve Hurricane Hunter aircraft twice fell to 910 hPa, once on 12 September and once on 13 September-tying the record for the sixth lowest central pressure of record for an Atlantic hurricane. The center of Ivan passed within about 20 nmi of Jamaica on 11 September and a similar distance from Grand Cayman on 12 September. Ivan then turned to the northwest and passed through the Yucatan channel on 14 September, bringing hurricane conditions to extreme western Cuba. Ivan moved across the east-central Gulf of Mexico, making landfall as a major hurricane with sustained winds near 105 kts on 16 September just west of Gulf Shores, Alabama.
Ivan weakened as it moved inland, but it produced over 100 tornadoes and heavy rains across much of the southeastern United States before merging with a frontal system over the Delmarva Peninsula on 18 September. Although this would normally be the end of the story, the extratropical remnant low of Ivan split off from the frontal system and drifted southward in the western Atlantic for several days, crossed southern Florida, and re-entered the Gulf of Mexico on 21 September. The low re-acquired tropical characteristics, becoming a tropical storm for the second time on 22 September in the central Gulf. Ivan weakened before it made its final landfall in southwestern Louisiana as a tropical depression on 24 September.
The highest marine winds observed during Ivan were from the oil drilling platform Ram Powell-VJ956 located about 70 nmi south of Mobile Bay, Alabama. It reported sustained winds of 102 kts with a gust to 135 kts at an elevation of 122 m at 2256 UTC 15 September. A sailboat moored at Wolf Bay, Alabama unofficially reported a wind gust to 126 kts at an elevation of 22 m at 0600 UTC 16 September. Other ship reports from Ivan are shown in Table 6. Among the many islands and coastal areas affected by Ivan, the highest winds were observed at Grand Cayman Island, which reported sustained winds of 130 kts with a gust to 149 kts at 1345 UTC 12 September. Point Salines, Grenada reported sustained winds of 64 kts with a gust to 101 kts at 2100 UTC 7 September, while there was an unofficial report of sustained winds of 77 kts with a gust to 99 kts at 0602 UTC 16 September from Gulf Shores. NOAA buoy 42040 reported a significant wave height of 52.5 ft as the center of Ivan passed nearby, and the buoy broke loose from its moorings during the hurricane.
| Date/Time (UTC) | Ship call sign/name | Latitude (°N) | Longitude (°W) | Wind dir/speed (kts) | Pressure (hPa) |
| 04 / 1100 | Buoy 13009 | 8.0 | 38.0 | NA / 36 | N/A |
| 08 / 0359 | MV Son Monoy | 10.7 | 66.2 | 320 / 40G50 | N/A |
| 08 / 1200 | LNG Sokoto (ZCDE4) | 11.6 | 62.7 | 120 / 47 | 1007.2 |
| 11 / 0600 | Sheila McDevitt (WDA406) | 15.9 | 77.5 | 230 / 37 | 1002.1 |
| 12 / 0400 | JAG Prachi (ATPN) | 16.8 | 80.2 | 010 / 46 | 1005.0 |
| 12 / 1500 | UBC Svea (P3JA8) | 17.7 | 81.8 | 250 / 53 | 997.5 |
| 13 / 1800 | William Oldendorff (A8CO2) | 18.3 | 85.5 | 260 / 35 | 1006.8 |
| 13 / 2100 | William Oldendorff (A8CO2) | 18.3 | 84.9 | 250 / 35 | 1005.9 |
| 14 / 0000 | Norwegian Sea | 17.9 | 86.8 | 280 / 44 | 1002.0 |
| 14 / 1000 | Rhapsody of the Seas | 22.6 | 88.8 | 020 / 44 | 999.0 |
| 14 / 1500 | Saudi Abha | 24.5 | 83.3 | 110 / 52 | 1004.3 |
| 14 / 1700 | Advantage | 25.3 | 83.9 | 120 / 47 | 1004.0 |
| 14 / 1800 | Saudi Abha | 24.1 | 82.7 | 120 / 52 | 1004.4 |
| 14 / 2300 | Advantage | 24.7 | 83.4 | 140 / 52 | 1004.2 |
| 15 / 1200 | Star Ismene (LANT5) | 24.2 | 85.1 | 180 / 43 | 1005.0 |
| 15 / 1500 | Deepwater Horizon | 27.0 | 90.0 | 360 / 50 | 963.0 |
Table 6. Selected ship and drifting buoy reports with winds of at least 34 kts for Hurricane Ivan, 2-24 September 2004.
Ivan's storm surge completely over-washed the island of Grand Cayman, where an estimated 95% of the buildings were damaged or destroyed. Surge heights of 10 to 15 ft occurred along the Gulf coast during Ivan's first U.S. landfall. The death toll from Ivan stands at 93-39 in Grenada, 26 in the United States, 17 in Jamaica, 4 in Dominican Republic, 3 in Venezuela, 2 in the Cayman Islands, and 1 each in Tobago and Barbados. U.S. damage is estimated to be near $14.2 billion, the second largest total on record. The hurricane also caused extensive damage on Grenada, Jamaica, and western Cuba.
Hurricane Jeanne
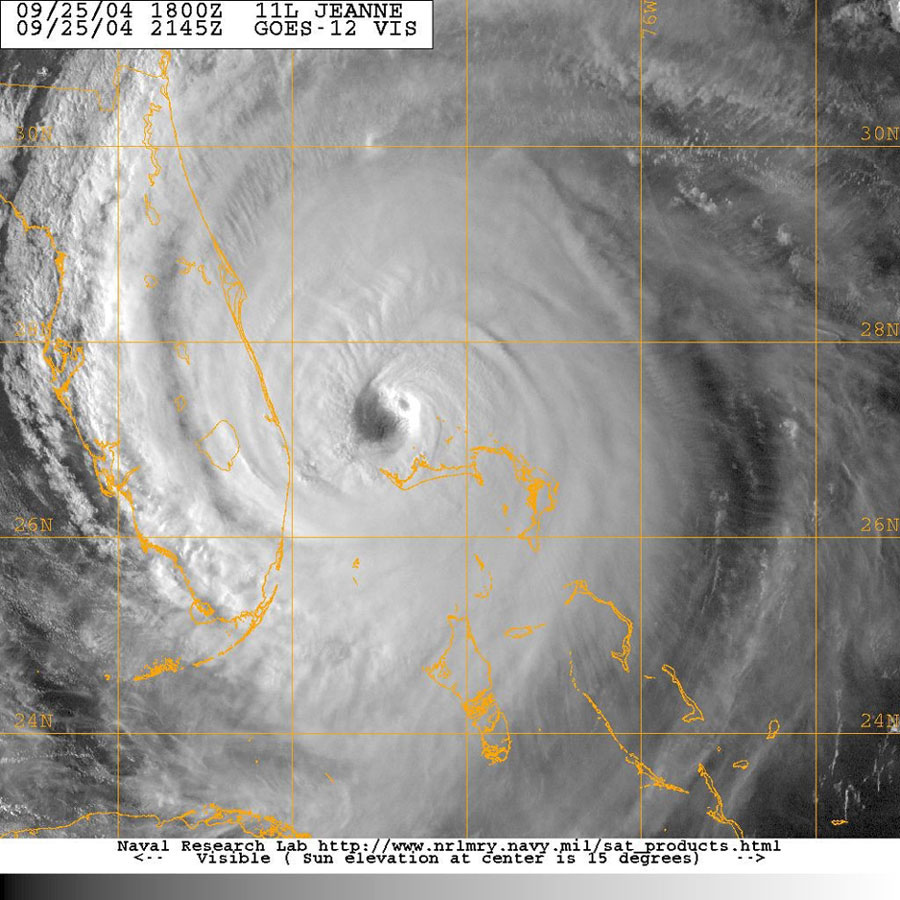 |
Figure 6. GOES-12 visible image of Hurricane Jeanne at 2145 UTC 25 September 2004. Image courtesy of the Naval Research laboratory, Monterey, CA. |
Jeanne formed from a tropical wave, becoming a tropical depression on 13 September near the Leeward Islands, and strengthening to a tropical storm the next day just south of the Virgin Islands. Moving west-northwestward, Jeanne struck Puerto Rico on 15 September with estimated maximum sustained winds of 60 kts and then strengthened to a hurricane just before making landfall in the Dominican Republic the next day. Jeanne spent nearly 36 hours over the rough terrain of Hispaniola, generating localized torrential rainfall before emerging into the Atlantic north of the island. Steering currents in the western Atlantic were weak, and Jeanne moved slowly through and then to the north of the southeastern Bahamas over the next three days while it gradually regained the strength it lost over Hispaniola. It then turned eastward and regained hurricane strength by 22 September. By the next day, high pressure had built in over the northeastern United States and western Atlantic, causing Jeanne to loop back westward. Jeanne strengthened and became a major hurricane on 25 September while the center moved over Abaco and then Grand Bahama Island (Figure 6). Early the next day, the center of Jeanne's 60-mile-wide eye crossed the Florida coast near Stuart, at virtually the identical spot that Frances had come ashore three weeks earlier. Maximum winds at the time of landfall are estimated to be near 105 kts, and a reconnaissance aircraft measured a minimum central pressure of 950 hPa a few hours before landfall.
Jeanne weakened as it moved across central Florida, becoming a tropical storm during the afternoon of 26 September near Tampa, and then weakening to a depression a day later over central Georgia. The depression was still accompanied by heavy rain when it moved over the Carolinas, Virginia, and the Delmarva Peninsula on 28 and 29 September before becoming extratropical.
Several ships encountered the outer portions of Jeanne (Table 7). The most significant observation was from the London Express (DPLE), which reported winds of 52 kts at 1200 UTC 26 September. In the Bahamas, the NOAA C-MAN station at Settlement Point on Grand Bahama reported sustained winds of 77 kts with a gust to 86 kts at 0000 UTC 26 September. Along the Florida coast, an instrumented tower at Sebastian reported sustained winds of 71 kts with a gust to 88 kts at 0647 UTC 26 September. St. Croix, USVI reported sustained winds of 45 kts with a gust to 54 kts at 0800 UTC 15 September, while San Juan, Puerto Rico reported sustained winds of 43 kts with a gust to 62 kts at 1734 UTC 15 September.
| Date/Time
(UTC) |
Ship call sign/name | Latitude (°N) | Longitude (°W) | Wind dir/speed
(kts) |
Pressure (hPa) |
| 15 / 0300 | Kaptian Bochek | 17.3 | 64.5 | 060 / 39 | 1008.3 |
| 15 / 1200 | Kaptian Bochek | 17.9 | 64.7 | 100 / 49 | 1008.7 |
| 16 / 1800 | CSX Discovery | 22.4 | 69.6 | 080 / 37 | 1014.0 |
| 21 / 0600 | Federal Progress | 29.3 | 77.5 | 300 / 35 | 1014.0 |
| 22 / 2100 | CSX Hawaii | 29.9 | 67.7 | 010 / 40 | 1011.3 |
| 24 / 2100 | CSX Challenger | 30.1 | 74.1 | 050 / 37 | 1008.5 |
| 25 / 1200 | El Yunque | 29.5 | 78.2 | 070 / 44 | 1004.8 |
| 25 / 1700 | CSX Producer | 29.8 | 77.6 | 070 / 44 | 1006.5 |
| 25 / 1800 | CSX Producer | 29.7 | 77.5 | 080 / 42 | 1005.7 |
| 25 / 1800 | Maersk Newark
(A8CF2) |
30.1 | 79.1 | 060 / 44 | 1009.0 |
| 26 / 0000 | London Express | 25.6 | 80.0 | 270 / 45 | 997.3 |
| 26 / 0000 | Maersk Newark
(A8CF2) |
29.5 | 78.6 | 060 / 37 | 1004.0 |
| 26 / 0600 | Chevron Arizona | 26.0 | 88.0 | 060 / 37 | 1008.5 |
| 26 / 1200 | Name Unknown
(WDB944) |
27.8 | 79.6 | 160 / 42 | 996.0 |
| 26 / 1200 | London Express | 28.9 | 79.9 | 110 / 52 | 1001.2 |
| 26 / 1800 | P&O Nedlloyd
Piraeus |
27.6 | 79.1 | 140 / 35 | 1006.0 |
| 26 / 1800 | Lykes Liberator | 29.0 | 79.3 | 140 / 39 | 1003.0 |
| 26 / 2100 | P&O Nedlloyd
Piraeus |
27.0 | 79.4 | 180 / 35 | 1005.4 |
| 26 / 2300 | Lykes Liberator | 28.1 | 79.7 | 160 / 38 | 1000.5 |
| 27 / 0000 | Nedlloyd Holland
|
| 80.3 |
150 / 50 |
998.9 | |
| 28 / 1800 | OOCL Faith | 33.2 | 78.0 | 230 / 41 | 1007.0 |
| 29 / 1200 | Lykes Navigator | 36.9 | 72.5 | 260 / 35 | 1007.3 |
Table 7. Selected ship reports with sustained winds of at least 34 kts for Hurricane Jeanne, 13-28, September 2004.