MARINE WEATHER REVIEW NORTH PACIFIC AREA
September to December 2003
George P. Bancroft, National Center for Environmental Prediction
Introduction
The weather of the period featured tropical activity in the western North Pacific, most of which occurred in September and October, but some activity was noted in November and December. Most of this involved storms recurving north and then northeast into the westerlies near Japan and soon becoming extratropical. Only Parma in late October actually entered OPC's high seas area which is north of 30N and east of 160E, as a tropical cyclone, actually accomplishing it twice (see below). Two of the tropical cyclones redeveloped as hurricane-force storms after becoming extratropical, and are described in this article. Non-tropical weather became more active in October, especially in the east. The period from late November through December was very active, with the most intense storms occurring in this period.
Tropical Activity
Typhoon Maemi: Maemi appeared well south of Japan on OPC's oceanic analysis charts as a tropical storm on September 6, then tracked west-northwest and became a typhoon while passing west of OPC's map area early on the 7th. Maemi struck South Korea before recurving north and then northeast and weakening, and became an extratropical gale crossing northern Japan early on September 13. The remains of Maemi then moved northeast toward the Kamchatka Peninsula, briefly becoming a storm at 0000 UTC September 14, before turning east along 50N and crossing the Pacific with winds of gale force or less, taking a week to do so.
Typhoon Choi-Wan: At the time that the remains of Maemi were moving into the south-central coast of Alaska at 0000 UTC September 21, Typhoon Choi-Wan appeared about 180 nmi south of Japan, heading northeast and becoming extratropical near 41N 157E 48 hours later. The maximum strength as a typhoon was 95 kt sustained winds with gusts to 115 kt while south of Japan, before weakening occurred. The ship Aquarius Ace (3FHB8) reported from about 250 nmi southeast of Choi-Wan near 30N 145W with a south wind of 40 kt at 0000 UTC on the 22nd. The remains of Choi-Wan weakened to a gale while passing about 420 nmi south of the western Aleutians early on the 23rd, but reintensified to a storm-force low (979 mb) near 51N 159W at 1800 UTC on the 24th before weakening onshore in Southeast Alaska on the 25th.
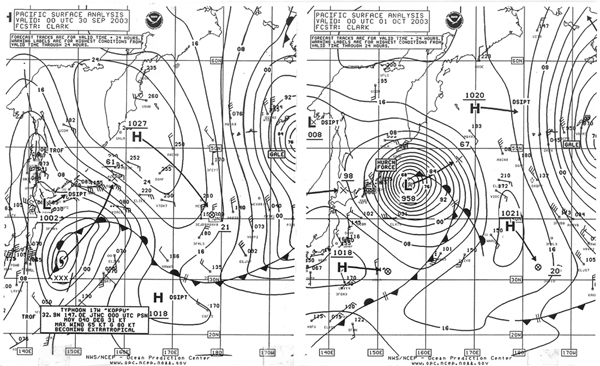
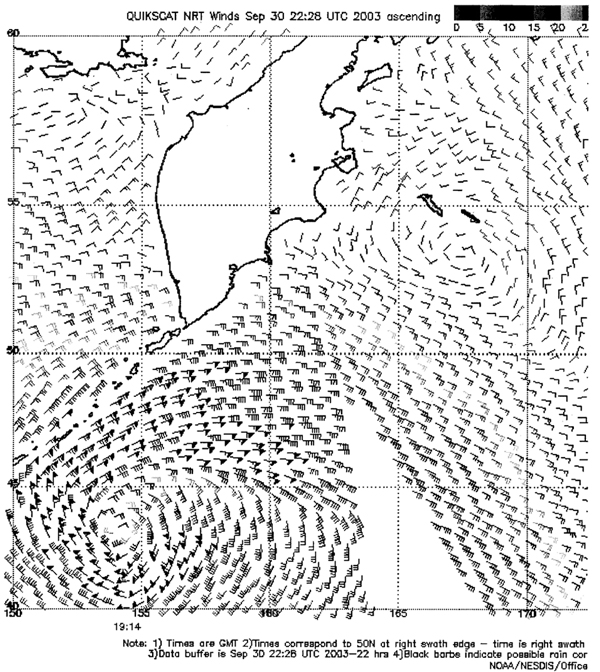
Typhoon Koppu: Tropical Depression 17W appeared on the southwest corner of the OPC oceanic analysis area at 1200 UTC September 25, drifting north-northeast. The cyclone became Tropical Storm Koppu near 21N 139E at 0000 UTC September 27, then a typhoon near 26N 141E 36 hours later. The maximum intensity reached was 90 kt maximum sustained winds with gusts to 110 kt near 28N 142E at 0600 UTC September 29, before weakening and becoming extratropical 24 hours later. Figure 1 shows Koppu about to merge with a frontal zone at 0000 UTC on the 30th, and then become an intense 958-hPa low 24 hours later. The QuikSCAT image of extratropical Koppu in Figure 2 reveals winds of 60 kt or higher around the west and south semicircles of the center, with a maximum of 75 kt northwest of the center, in a part of the ocean with sparse conventional data. The Paris Express (DIHE) reported a north wind of 50 kt at 45N 151E at 0000 UTC October 1.
|
|
The storm then began to weaken and turn east, and passed just south of the Aleutians as a gale-force low from the 2nd to the 4th, before moving to the south coast of mainland Alaska and weakening on October 7.
Tropical Depression 19W: This tropical cyclone made a brief appearance as it entered the oceanic analysis area just south of Japan at 0000 UTC October 13, with maximum sustained winds of 25 kt and gusts to 35 kt. The cyclone became absorbed by a frontal zone to the north twelve hours later.
Typhoon Parma: Long-lived Parma originated from Tropical Depression 21W which formed near 20N 143E early on October 20 and drifted north and then northeast, becoming Typhoon Parma near 24N 147E 48 hours later. Parma continued a northeast track and intensified as a cold front approached from the north, developing maximum winds of 130 kt with gusts of 160 kt upon reaching 31N 162E at 1800 UTC October 24. The front failed to "pick up" Parma and accelerate the cyclone into the westerlies. Instead, Parma looped back to the southeast, then southwest and west along 22N by the 26th. The intensity was down to a minimal typhoon by the 27th before the cyclone turned northwest and reintensified to 85 kt with gusts to 100 kt near 23N 152E at 1800 UTC October 28. On the 29th Parma turned north along 150W, with the intensity increasing to 115 kt sustained winds with gusts to 135 kt as the center reached 27N 150E at 0000 UTC October 30.
Parma then turned northeast and weakened as another cold front approached, finally becoming extratropical near 32N 167E at 1200 UTC on the 31st. At this time Parma was an extratropical 993-hPa storm, with a ship nearby Careen Point (WCY4148) at 33N 164E reporting a northeast wind of 55 kt. The remains of Parma then weakened to a gale while heading east-northeast on November 2, before turning southeast on the 6th off the U.S. Pacific Northwest coast and dissipating southwest of California on the 11th.
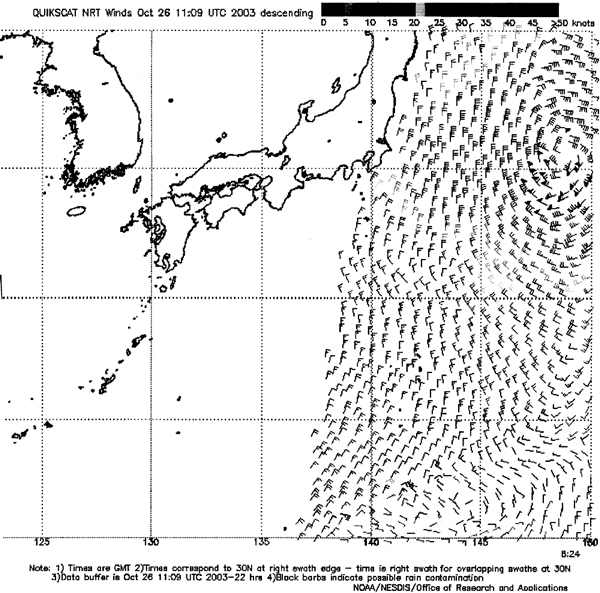
Typhoon Ketsana: Ketsana was short-lived as a tropical cyclone over OPC's map area, appearing south of Japan near 23N at 1800 UTC October 24 while Parma was a typhoon well southeast of Japan. The intensity was 85 kt with gusts to 105 kt, with Ketsana heading northeast and becoming a compact extratropical hurricane-force storm at 0000 UTC October 26. Figure 3 depicts this transformation over a twelve-hour period resulting in the 986-hPa extratropical low east of Japan. The scatterometer data in Figure 4 reveal winds as high as 65 kt southwest of the center. There is a ship east of the center Mayview Maersk (OWEB2) near 34N 151E reporting south winds of 45 kt in the second part of Figure 3. The cyclone then moved northeast and weakened to a gale in the Bering Sea on the 28th. The highest wind reported by a ship was a south wind of 55 kt from the Stimson (WCY2270) near 52N 180 at 0600 UTC October 28.
|
|

Typhoon Lupit: Lupit, formerly a super typhoon west of the OPC analysis area on November 27, recurved northeast to near 26N 137W at 1800 UTC November 30 with maximum sustained winds of 70 kt with gusts to 85 kt. Lupit then weakened to an extratropical storm (982 mb) near 31N 143E at 1200 UTC December 1. Re-intensification occurred after 0000 UTC on the 2nd, with the central pressure lowering to 958-hPa and the center moving to near the Kamchatka Peninsula by 0000 UTC December 5. The storm then stalled and weakened over the Bering Sea by the 7th. Available ship reports in the storm were mostly 50 kt around the center until the 4th.
Other Significant Events
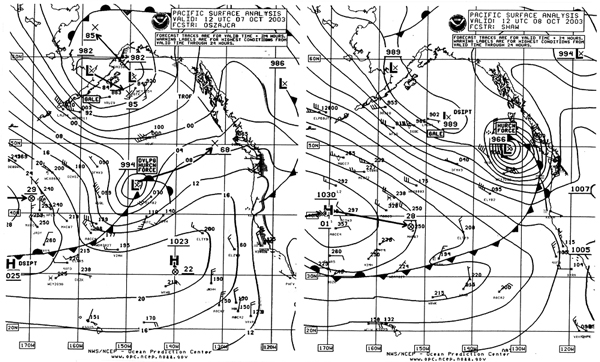
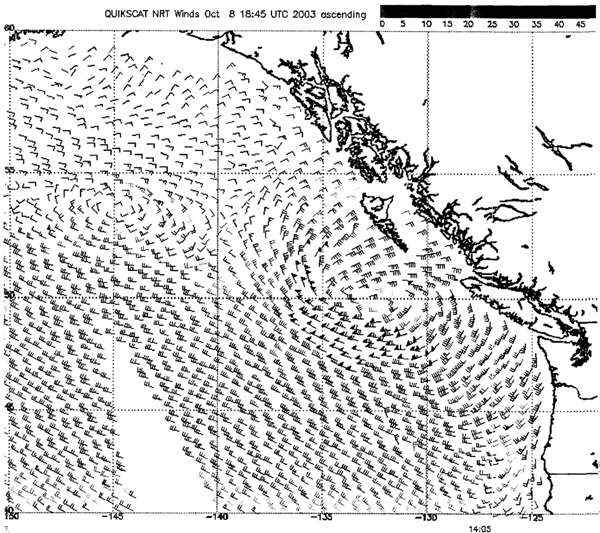
Eastern North Pacific Storm, 7-8 October 2003. Figure 5 displays this rapid development of a hurricane-force storm off Vancouver Island from an open frontal wave over a 24-hour period. The second part of the figure shows the storm at maximum intensity (966-hPa). The central pressure fell 28-hPa in the 24-hour span of the figure. The second part of the figure shows the storm at maximum intensity (966-hPa). The central pressure fell 28-hPa in the 24-hour span of the figure. The ship ZIM Israel (4XGX) reported a west wind of 50 kt near 48N 134W at 1800 UTC October 8 and again at 0000 UTC on the 9th near 48N 132W, with the latter having 15-meter seas (51 feet). The Sea-Land Anchorage (KGTX) encountered north winds of 40 kt and 10.5-meter seas (34 feet) near 52N 135W at 1800 UTC October 8. The Canadian buoy 46132 (49.7N 127.9W) reported a southeast wind of 45 kt with gusts to 56 kt and 5.5-meter seas (18 feet) at 1200 UTC on the 8th, and maximum seas 10.5 meters (34 feet) thirteen hours later. The maximum wind reported by a buoy was a northwest wind of 52 kt with gusts to 70 kt from the buoy 46036 (48.4N 133.9W). The highest seas reported by this buoy was 10.0 meters (33 feet) at 1500 UTC October 8. Buoy 46005 (46N 131W) reported a peak gust of 64 kt from the south at 0700 UTC on the 8th, and maximum significant wave heights of 12.0 meters (39 feet) at 1800 UTC on the 8th. The QuikSCAT data in Figure 6 reveals winds of 65 and 70 kt south and southwest of the storm center near the time of maximum intensity. The storm then moved inland and weakened by the 9th.
|
|
Eastern North Pacific Storm of 10-11 October 2003. A second storm followed a track similar to that of the storm above, and was almost as deep, developing a lowest pressure of 970-hPa near 49N 136W at 1200 UTC October 11. The ship APL Singapore (WCX8812) encountered southwest winds of 55 kt and 9.5-meter seas (31 feet) near 43N 138.6W at 0600 UTC on the 11th. Twelve hours later the same ship reported west winds of 35 kt and 12.0-meter seas (39 feet) at 44N 140w at 1800 UTC October 11.Buoy 46005 (46N 131W) at 2300 UTC October 11 reported a southwest wind of 39 kt with gusts to 54 kt and 11.5-meter seas (38 feet). Maximum seas at this buoy were 13.0 meters (43 feet) at 0300 UTC October 12. To the south, winds at the coastal buoys along the Washington and Oregon coasts only topped out in the 30s in gusts, but swells reached 9.5 meters (31 feet) at Buoy 46029 (46.1N 124.5W) at 0900 UTC October 12.This storm then moved inland over Vancouver Island and weakened early on the 12th.
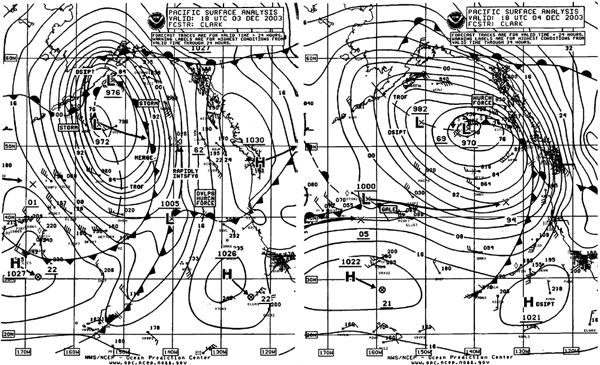
Eastern North Pacific Storm of 3-6 December 2003. This storm was noteworthy because of the rapid intensification and some impressive ship reports. Figure 7 displays this development over a 24-hour period from the merger of a low coming up from the south and a larger northern storm system dropping southeast from Alaska, with the pressure of the southern low dropping 35-hPa. The result is the hurricane-force low west of British Columbia with a very strong occluded front approaching the coast. The President Adams (WRYW) reported an east-southeast wind of 80 kt near the front (49N 133W) at 1200 UTC December 4, while the Horizon Kodiak (KGTZ) encountered an east wind of 65 kt at 1800 UTC on the 4th (plotted in Figure 7). At the same time the Santa Barbara (ELOT3) experienced east-southeast winds of 60 kt near Vancouver Island. The storm subsequently stalled near Vancouver Island and weakened by the 7th.
|

North Pacific and Aleutians Storm of 13-15 December 2003. This was the most intense of a series of storms that tracked northeast across the North Pacific with many turning east and beginning to weaken after reaching the Aleutians. Figure 8 shows the deepest of these, attaining a 943-hPa central pressure (27.85 inches) upon reaching the central Aleutians. This was the deepest low of the period in both oceans. The system was labeled hurricane force by OPC on the 14th. Available sparse ship data showed 50 to 55 kt with Swift Arrow (C6NI7) (49N 179W) reporting northwest winds of 55 kt at 0000 UTC December 14. QuikSCAT data was available for this storm and showed 65 kt south of the center (not displayed here) but was similar to data from a storm of similar intensity that occurred on December 17 farther west (Figure 11).
|
|
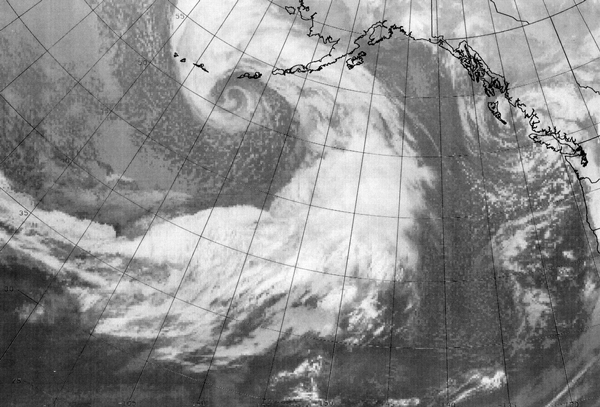

A satellite image of this storm near maximum intensity (Figure 9) reveals the well-defined center marked by frontal clouds with relatively cold tops wrapping around the center near 51N 168W. The storm subsequently weakened to a gale in the Gulf of Alaska by the 16th, followed by dissipation over Alaska by the 18th.
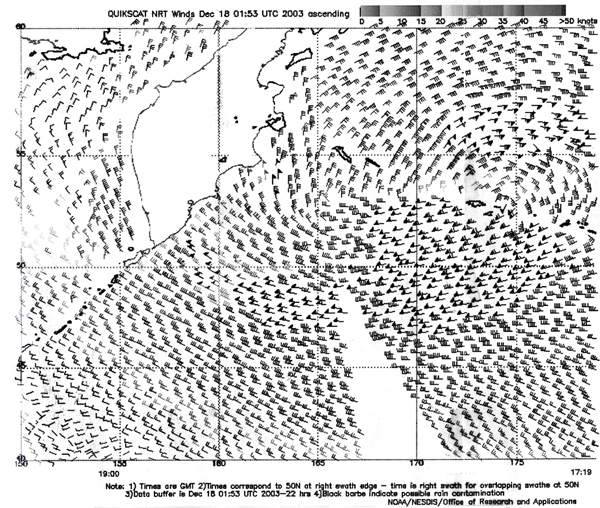
North Pacific Storm of 16-18 December 2003. This system originated near Japan like the previous one and tracked north-northeast to the western Aleutians on the 17th where it developed a 946-hPa central pressure. The largest pressure drop in a 24-hour period was 39-hPa in the period ending at 1200 UTC December 17. The ship DGDD (48N 155E) reported a northwest wind of 55 kt at 0600 UTC December 17. QuikSCAT winds shown in Figure 11 reveal 65 kt south of the western Aleutians. The cyclone then turned east and weakened, and became absorbed by another storm to the southeast on the 20th.
|
|
 |
Figure 13. QuikSCAT scatterometer image of satellite-sensed winds around the storm shown in Figure 12. The valid time of the pass is approximately 1700 UTC December 28, 2003, or seven hours prior to valid time of second surface analysis in Figure 12. (From NOAA/NESDIS/Office ef Resesarch and Applications). |
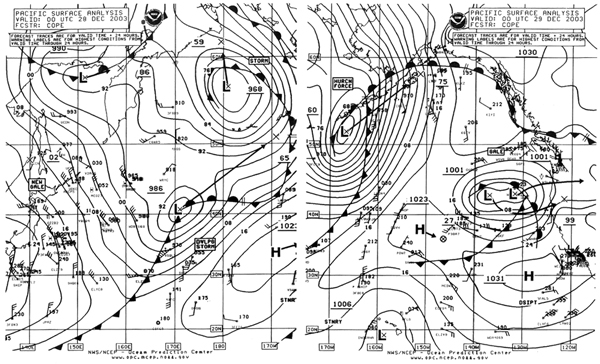
Eastern North Pacific Storm of 16-18 December 2003. This was an intense system associated with the southern branch of the jet stream, originating from a frontal wave out near the dateline on the 15th. Much of the development occurred at relatively far southern latitudes, west of California (Figure 10). This occurred concurrently with the northern storm above. The second part of Figure 10 shows the storm at maximum intensity. The strongest winds as reported by ships occurred at this time and in the twelve hours following. The ship P&O Nedlloyd Southhampton (XBC6) (36N 142W) reported south winds of 60 kt at 1800 UTC North Pacific Storm of 28-30 December 2003. Like other lows of the period, this one moved on a southwest to northeast track from off Japan from December 26 to near the Aleutians late on the 28th (Figure 12) with the low depicted at maximum intensity (960-hPa) in the second part of the figure. Not apparent from available sparse ship data, Figure 13 shows QuikSCAT winds of up to 70 kt southwest of the center in a pass taken about seven hours prior to the analysis time in the second part of Figure 12. The storm then continued on a northeastward heading into the Gulf of Alaska, where it weakened to a gale-force low off Southeast Alaska by the 31st.
References
From Tropical Prediction Center website, www.nhc.noaa.gov/
Vukits, Paul (OPC), E-mail communication, September 20, 2003)
Avila, Lixion A. Tropical Cyclone Report, Hurricane Juan 24-29 September 2003 (Tropical Prediction Center website, www.nhc.noaa.gov.
Bowyer, Peter, The Storm Surge and Waves at Halifax with Hurricane Juan, Environment Canada Hurricane Center website www.atl.ec.gc.ca/weather/hurricane/index_e.html.
Page last modified: