MARINE WEATHER REVIEW - NORTH ATLANTIC AREA
September to December 2003
George P. Bancroft, National Centers for Environmental Prediction
Introduction
Tropical cyclone activity during this period in Ocean Prediction Center's marine area of responsibility was concentrated during the September to early October period, which included what is normally the peak of the Atlantic hurricane season. Four tropical cyclones affected OPC's area during the period, including one tropical depression and the rest hurricanes. Two of these redeveloped into hurricane-force storms after becoming extratropical. Other tropical activity continued into early December but had little impact on OPC's marine area. Otherwise, extratropical cyclonic activity picked up especially from late October on, with November especially active over the western and central North Atlantic.
Tropical Activity
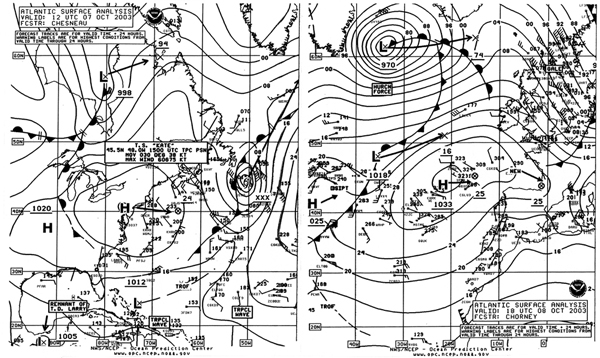
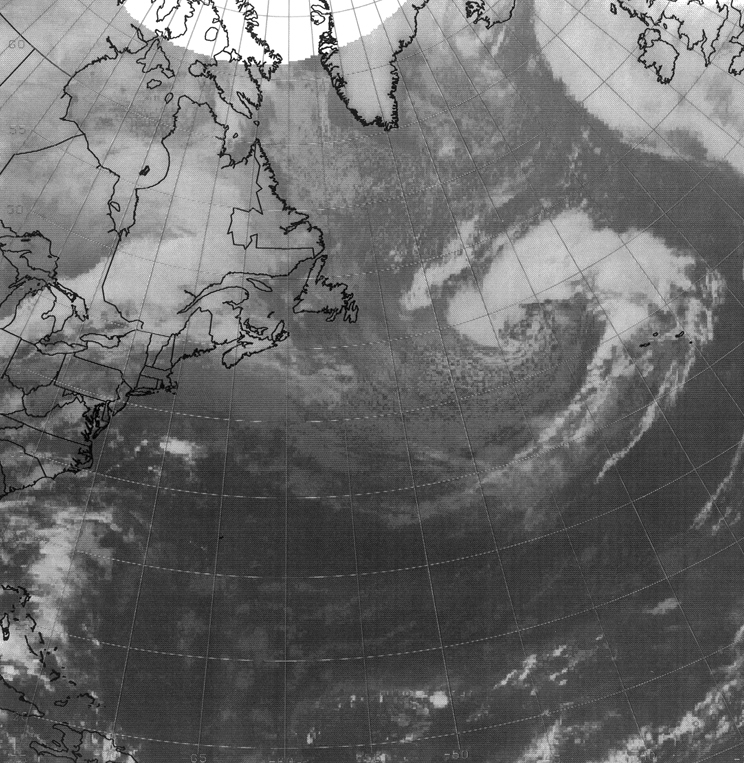
Hurricane Fabian: Fabian moved north into OPC's high seas area, south of Bermuda, early on September 5 as a major hurricane with maximum sustained winds of 105 kt and gusts to 130 kt. The ship San Antonio (ELZU6) north of Fabian near 33N 65W reported an east wind of 35 kt at 1800 UTC September 5. Fabian then passed just west of the Bermuda land station that afternoon where the wind reached an estimated 90 kt with gusts of 115 kt (from the south-southeast) at 1955 UTC September 5 and the pressure dropped to 965-hPa before the station went off the air. After passing Bermuda the storm turned more northeast and accelerated while beginning to weaken, passing about 360 nmi east of the island of Newfoundland early on the 8th while still a minimal hurricane with maximum sustained winds of 65 kt and gusts to 80 kt. The satellite image in Figure 1 shows Fabian beginning extratropical transition while approaching a frontal zone to the north, developing a broad cloud shield north and northwest of the center. The Canadian buoy 44140 (43.8N 51.8W) at 1800 UTC September 7 reported a northeast wind of 31 kt with gusts to 39 kt as Fabian passed to the southeast, with maximum seas 5.0 meters (16 feet) six hours later. The center then passed near the drifting buoy 62711 (47.3N 45.8W), which reported a northwest wind of 70 kt and a pressure of 985.7-hPa at 0700 UTC September 8. This was four hours after the analyzed position of Fabian (based on the 0300 UTC advisory information in the box) in the first part of Figure 2.
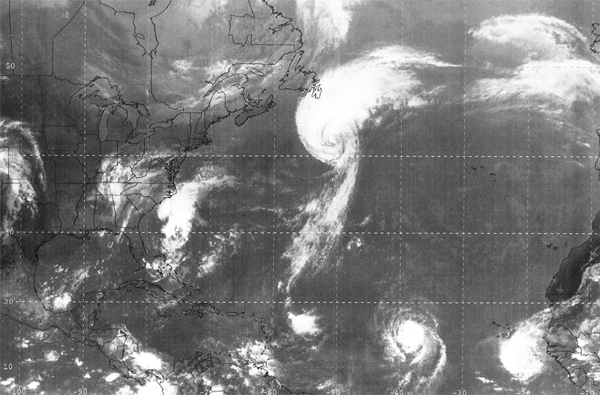 |
Figure 1. Mosaic image consisting of GOES 12 and METROSAT7 infrared satellite imagery valid 1600 IUTC September 7, 2003 showing Hurricane Fabian about twenty-four hours prior to becoming extratropical. The satellite senses temperature on a scale from warm (black) to cold (white) in this type of image. The valid time is eight hours prior to that of the first surface analysis in Figure 1. |
The cyclone became extratropical after passing 50N later that day. The cyclone then turned north as an extratropical hurricane-force storm early on September 9 before weakening and becoming absorbed by another extratropical storm near Greenland on the 9th.
Tropical Depression Henri: Henri, earlier a tropical storm in the Gulf of Mexico, crossed northern Florida early on September 6 and entered OPC's offshore waters about 120 nmi off the Georgia coast early on the 7th as a tropical depression with maximum sustained winds of 30 kt and gusts to 40 kt. Henri is shown in the first part of Figure 2 approaching a stationary front to the north. Henri then became an extratropical low at 0000 UTC September 9 and became nearly stationary about 150 nmi south of Cape Hatteras, held in place by high pressure building down from eastern Canada.
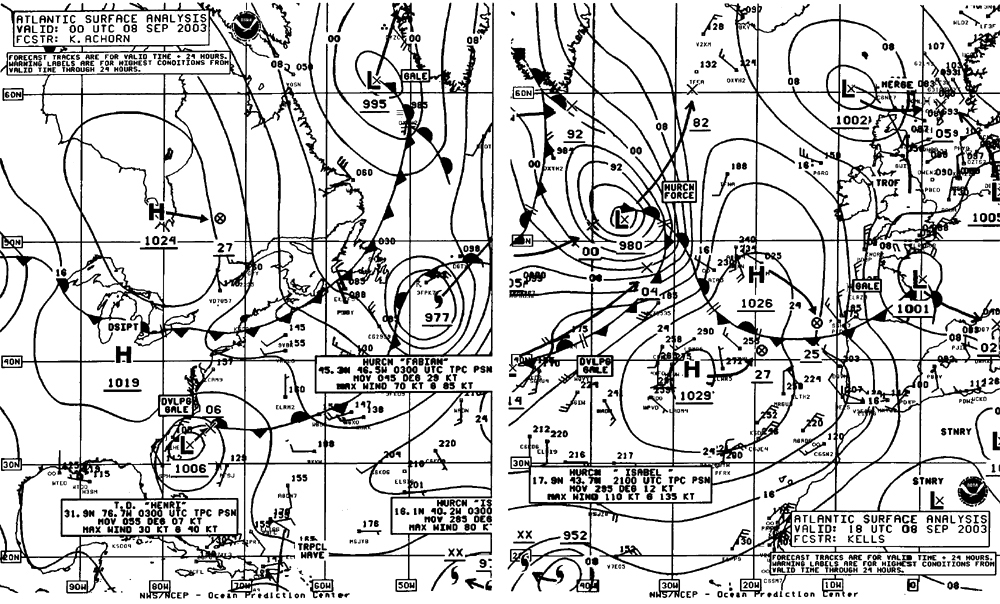 |
Figure 2 - OPC North Atlantic Surface Analysis chart (Part 2 - west, and Part 1 - east) valid 0000 UTC and 1800 UTC September 8, 2003. Hurricane Fabian is depicted becoming an extratropical hurricane-force storm, as well as Tropical Depression Henri off the southeast U.S. Coast. The tropical cyclone information given in the boxes is based on the latest advisory (0300 UTC) and not on the chart's analysis time. |
Gale-force north to northeast winds developed by then between the remains of Henri and the ridge to the north, which persisted through the 11th. The Lykes Explorer (WGLA) and the vessel Energy Enterprise (WBJF) reported north winds of 40 kt near 34N 77W and 34N 76W, respectively, at 1800 UTC September 9. The Lykes Explorer also encountered northeast winds of 40 kt near 36N 74W atv 1200 UTC on the 10th. The system then began a northwest drift and weakened by the 12th, moving inland over the mid-Atlantic states of the U.S. by September 13.
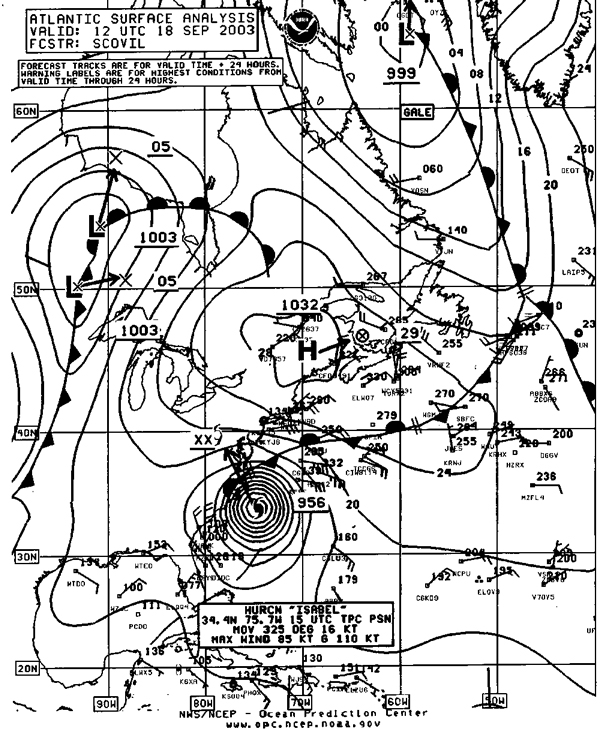
Hurricane Isabel: Formerly attaining the maximum category of 5 on the Saffir-Simpson scale (Reference 1) while over the tropical Atlantic, Isabel crossed 31N into OPC's marine area about 300 nmi southeast of Cape Hatteras late on September 17 as a large Category 2 hurricane with maximum sustained winds of 90 kt and gusts to 115 kt. Isabel only weakened slightly before making landfall on North Carolina's Outer Banks by the afternoon of September 18 (Figure 3).Ships mainly avoided the storm, with the strongest wind report coming from the P&O Nedlloyd Nina (MZNM7), a south wind of 45 kt at 0600 UTC September 19 near 39N 73W, after the center had passed inland. Reports from some buoys and automated coastal (C/MAN) are listed in Table 1.
|
| ||||||||||||||||||||||||||||||||||||||||||||||||||||||||||||||||||||||||||||||
Hurricane Juan: Juan entered OPC's marine area about 180 nmi southeast of Bermuda on the evening of September 25 as a tropical storm and tracked mostly north, gaining hurricane strength while passing about 150 nmi east of Bermuda by the afternoon of the 26th. The cyclone was at a maximum intensity of 90 kt with gusts of 110 kt (a Category 2 hurricane) from the afternoon of the 27th until the next morning, and only weakened slightly while accelerating northward and making landfall in Nova Scotia near Halifax on the evening of the 29th. Figure 4 shows Juan making landfall with maximum sustained winds of 70 kt, but a post-storm analysis by meteorologists at the Canadian Hurricane Center led to an upgrade in strength at landfall to 85 kt sustained winds (a minimal Category 2 storm) (Reference 3). Prior to landfall, Juan passed over the Canadian buoy 44142 (42.5N 64.0W) which reported an east wind of 54 kt with gusts to 68 kt and 8.0-meter seas (26 feet) at 2300 UTC September 28. An hour later the buoy reported a southwest wind of 37 kt with gusts to 54 kt, 12-meter seas (39 feet) and a pressure of 974.7-hPa.
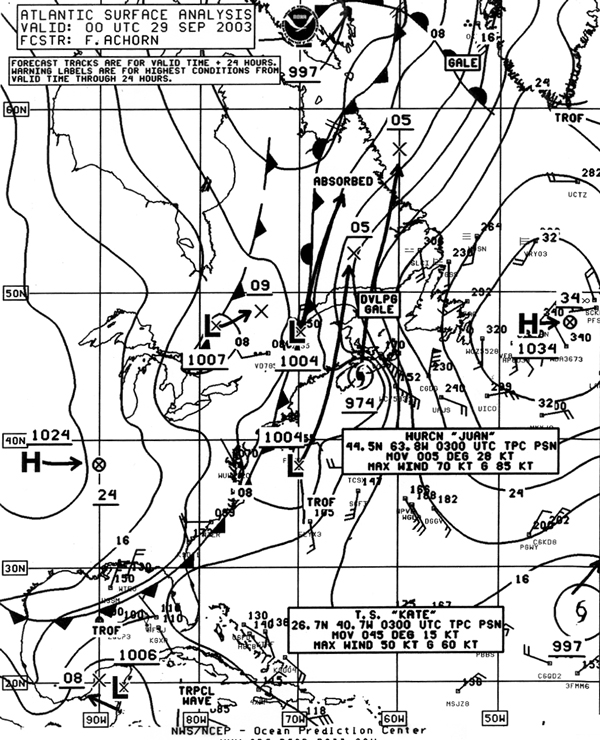 |
Figure 4. OPC North Atlantic Surface Analysis chart (Part 2) valid 0000 UTC September 29, 2003, showing Hurricane Juan making landfall near Halifax, Nova Scotia, Canada. Also Tropical Storm Kate appears near the southeast edge of the chart. |
Another Canadian buoy (44258) just outside Halifax Harbor reported seas of 9.0 meters (30 feet) and extreme waves of 19 to 20 meters (62 to 66 feet) between 0320 and 0420 UTC September 29 (Reference 4). As Juan was moving into the Gulf of St. Lawrence, the ship Panuke Sea (VOCT) (46N 61.5W) encountered southeast winds of 60 kt. The storm then weakened and merged with an extratropical low inland over eastern Canada later on September 29.
Hurricane Kate: Kate, briefly attaining hurricane strength just southeast of OPC's high seas area late on September 29, entered OPC's waters about 600 nmi southwest of the Azores as a tropical storm early on September 30 and drifted northwest until early on October 1 when the cyclone turned more west-southwest and reintensified into a minimal hurricane at 2100 UTC October (maximum sustained winds of 65 kt with gusts to 80 kt) near 31N 42W. Kate passed just south of 31N (OPC's southern boundary) by early on October 2 and continued to intensify, becoming a major hurricane on the 3rd. Kate attained a maximum strength of 110 kt with gusts to 135 kt at 2100 UTC on the 4th just south of OPC's waters near 30N 54W and began a northwest turn.
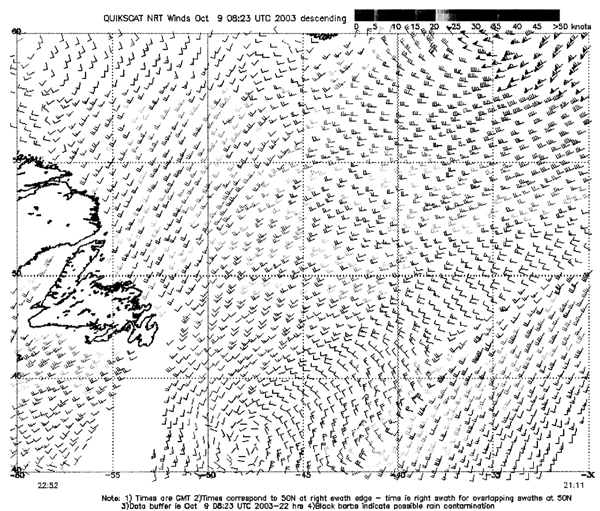
Kate then began to weaken upon moving north of 31N again early on October 5. Early on the 6th Kate began to recurve toward the north-northeast and the maximum sustained winds were 80 kt with gusts to 100 kt. The cyclone crossed 40N as a minimal hurricane late on the 6th. The ship Mackinac Bridge (JKES) (37N 52W) encountered south winds of 35 kt with Kate passing 180 nmi northwest. Kate then weakened to a strong tropical storm six hours later (maximum sustained winds 60 kt with gusts to 75 kt) while accelerating toward the north-northeast. At 1200 UTC October 7, the vessel Scandinavian Highway (3EXS4) (40.5N 50W) reported a southwest wind of 35 kt and 10.5-meter seas (34 feet) following passage of Kate. Kate passed near the Grand Banks oil platforms shortly thereafter, with VEP717 (46.7N 48.7W) reporting a northwest wind of 51 kt at 2100 UTC October 7. The drifting buoy 44771 (46.0N 48.4W) reported a pressure of 980.1-hPa at 1600 UTC that day. Kate then merged with a frontal zone at 0000 UTC October 8 and became an extratropical hurricane-force storm. Figure 5 depicts this transition with the second part of the figure showing former Kate at maximum intensity while extratropical east of Cape Farewell. The storm was in a data-sparse area, with the scatterometer winds in Figure 6 showing winds to 70 kt in the southern side of the storm. The cyclone turned east at that time and maintained its intensity until after passing south of Iceland on the 9th when the system began to weaken. The remains of Kate moved into Norway late on the 10th.
|
|
Other Significant Events of the Period
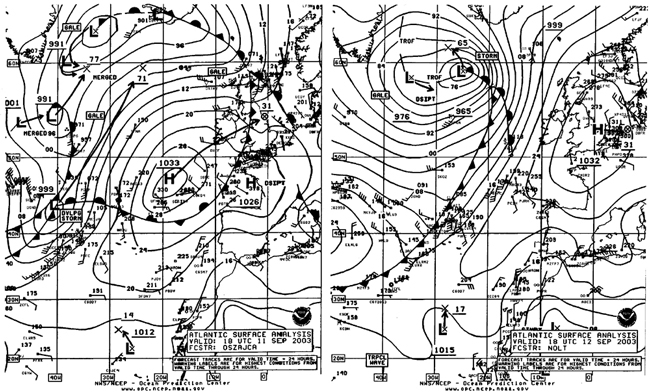
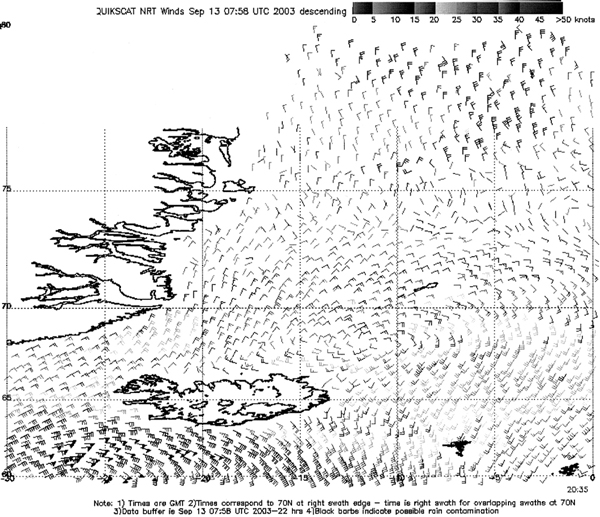
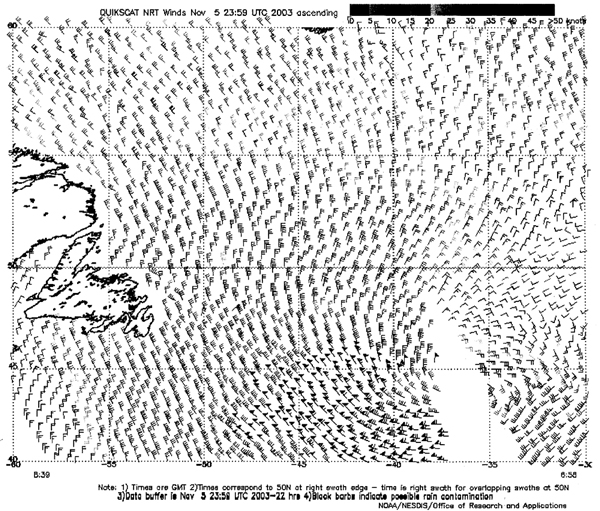
North Atlantic Storm, 11-13 September 2003. There were two early-season storms in the first half of September with central pressures dropping into the mid-960s, unseasonably deep for so early in the season. The stronger of these is depicted in Figure 7, with the low absorbing another low and trailing cold front to the north and rapidly deepening by 34-hPa over the 24-hour period ending at 1800 UTC September 12. The low had originated as a frontal wave about 600 nmi east of the North Carolina coast late on the 9th which broke off from the extratropical remains of Tropical Depression Henri. The lowest central pressure was 964-hPa, reached at 1200 UTC September 13, or 18 hours later than the analysis time of the second part of Figure 7. The cyclone moved into a data-sparse area between Greenland and Iceland, but the QuikScat image in Figure 8 shows some wind barbs of at least 60 to 65 kt on the north side of the storm which was centered to the south off the chart. The system then weakened, passing northeast of Iceland on the 14th.
|
|
North Atlantic Storm, 4-6 November 2003. This low, one of the most intense of the four-month period, followed a track that was different from most other systems of similar intensity during the period, initially heading southeast from the island of Newfoundland into an area of considerable ship traffic in the mid-ocean twenty-four hours later, Figure 9. This low was another rapid deepener, dropping 33-hPa in central pressure in the 24-hour period ending at 1200 UTC November 5.
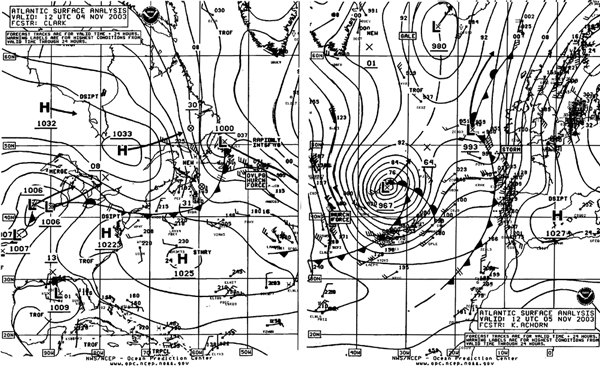 |
Figure 9. OPC North Atlantic Surface Analysis charts (Part 2 - west and Part 1 - east) valid 1200 UTC November 4 and 5, 2003. |
The central pressure bottomed out at 960-hPa twelve hours later as the storm made a turn to the north-northeast. Some of the more notable ship reports are listed in Table 2 below.
| Table 2 - Some observations taken during the North Atlantic storm of November 4-6, 2003. | ||||
| OBSERVATION | POSITION | DATE/TIME (UTC) | WIND | SEAS (m/ft) |
|---|---|---|---|---|
| Zim Iberia
(4XFP) |
41N 44W | 5/0600 | NW 58 | 11.5/37 |
| Nedlloyd Sydney
(PDHY) |
41N 45W | 5/1500 | NW 60 | 12.5/41 |
| 41N 36W | 5/1800 | W 50 | 13.0/43 | |
| A8CG3 | 45N 26W | 6/1200 | NW 60 | 14.5/47 |
| LARZ5 | 54N 28W | 6/1800 | NW 65 | 3.5/11 |
| Buoy 62108 | 53.6N 19.3W | 6/2200 | S 35 | 12.2/40 |
| VEP7171
(oil platform) |
46.7N 48.7W | 5/0600 | N 56 | |
Figure 10 is a GOES12 infrared satellite picture taken as the storm was approaching maximum intensity. Note the broad frontal cloud bands with cold tops to the north and northeast of the occlusion and warm front as shown in the second chart in Figure 9.
|
|
The convective-type clouds south of the center indicate unstable conditions, favoring the mixing of strong winds aloft down to the surface. The scatterometer image in Figure 11 taken at about the same time shows hurricane-force winds south and southwest of the center (located in data-free swath) with even some 75 kt wind barbs. The cyclone subsequently began to weaken while turning northwest toward Greenland on the 7th, and dissipated over Greenland on November 8.
Western North Atlantic Storm of 9-11 November 2003.
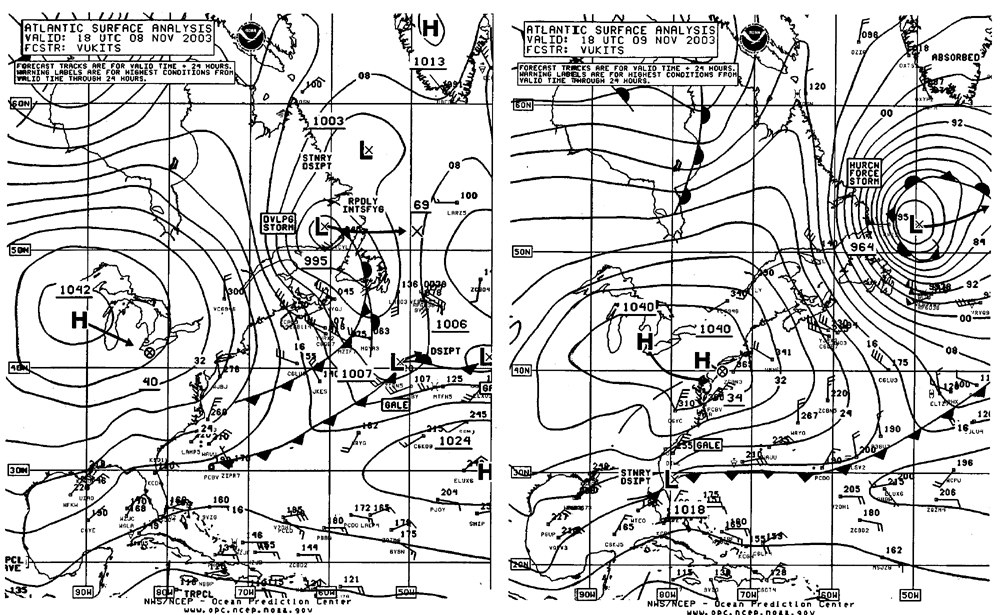
This storm was similar to the preceding storm above in terms of intensity, but tracked more northeast after leaving the coast of Newfoundland, and the strongest winds were closer to the coast of the Canadian Maritimes. Figure 12 shows the system rapidly deepening while moving off the coast, with the central pressure dropping 31 mb in the 24-hour period ending at 1800 UTC November 9. At 1200 UTC November 9 the Tampa (LMWO3) (44N 58W) reported a west wind of 60 kt and 4.6-meter seas (15 feet). Six hours later the Grand Banks oil platforms VEP717 and HP6038 reported west winds of 65 kt and 9.8-meter seas (32 feet), and west winds of 60 kt, respectively. VEP717 then came in with 70 and 75 kt west to northwest winds at 0000 UTC and 0600 UTC November 10, respectively. At 1500 UTC November 10 the drifting buoy 44546 (48N 45W) reported a west wind of 85 kt. Winds obtained via scatterometer during the storm (not shown) supported winds of at least 70 kt. The central pressure of the storm was as low as 959-hPa at 1200 UTC November 10 when the center was at 53N 42W. The system then began to weaken, becoming a gale-force low while passing south of Iceland on the 12th.
 |
|
Figure 12. OPC North Atlantic Surface Analysis charts (Part 2) valid 1800 UTC November 8 and 9, 2003. |
 |
|
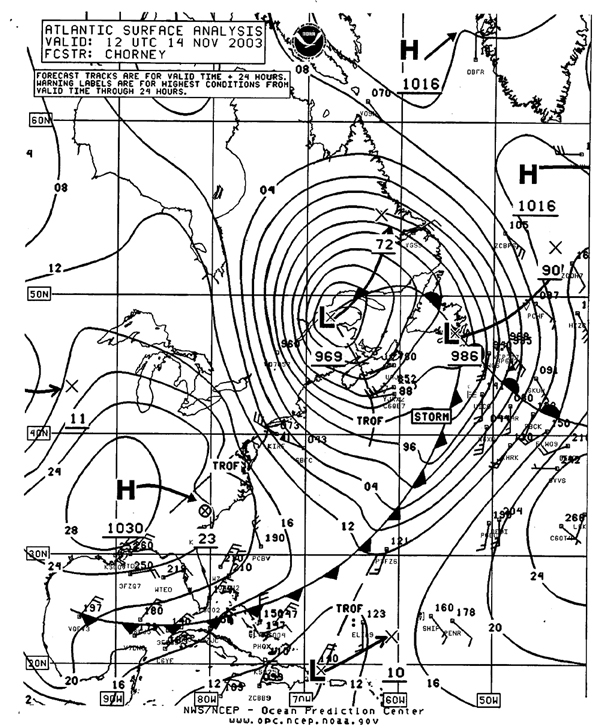
Figure 13. OPC North Atlantic Surface Analysis chart (Part 2) valid 1200 UTC November 14, 2003. |
Western North Atlantic Storm of 12-15 November 2003. Much of the intensification of this system was inland while the center was moving across the Great Lakes and St. Lawrence Valley, with Figure 13 showing the storm near maximum intensity. Most of the reports of higher winds and seas were in the west to northwest flow of cold air south of the center.
The ship Finnfighter (SBFC) near 39N 69W encountered west winds of 55 kt at 0000 UTC November 14 and 60 kt six hours later. The ship MSC Italy (ELTN3) reported west winds of 50 kt and 8.5-meter seas (28 feet) in the Gulf of Maine near 42.5N 68W at 0600 UTC on the 14th, followed by the Fidelio (WQVY) encountering west winds of 55 kt near 36N 60W at 0000 UTC November 15. Many of the offshore buoys from off the northern mid-Atlantic coast of the U.S. northeastward through the New England waters and off Nova Scotia reported sustained winds of 35 to 40 kt and higher gusts on November 13 and 14. Buoy 44004 (38.5N 70.5W) reported a sustained wind of 40 kt from the west and 9.4-meter seas (31 feet) at 0200 UTC November 14. Buoy 44008 (40.5N 69.4W) at Nantucket Shoals reported northwest winds of 39 kt with gusts to 52 kt at 2000 UTC November 14 and seas of 6.5 meters (21 feet). The highest seas or significant wave height came at 0100 UTC on the 14th when the waves reached 8.0 meters (26 feet). Among the C-MAN automated coastal stations, Ambrose Light (ALSN6) near 40.5N 73.7W reported the highest sustained wind and gust, west at 46 kt 1300 UTC November 13, and a peak gust of 61 kt two hours later. The storm system then drifted east over the Labrador Sea on November 15 before weakening to a gale south of Greenland, and then reformed near Iceland by the 20th before dissipating near Great Britain by November 23.
Northwest Atlantic Storm of 29 November 29 -1 December 2003. This storm like the previous one developed inland over southern Quebec early on the 29th but instead took a more northward track into the northern Labrador Sea, developing a brief period of hurricane-force winds against the southwest Greenland coast at 1800 UTC November 30. The central pressure was down to 953-hPa at that time, the lowest in the North Atlantic during this period. The center then weakened and reformed east of Greenland by December 1 before being replaced by another storm lifting northeast from the Canadian Maritimes two days later.
References
From Tropical Prediction Center website, www.nhc.noaa.gov/, Vukits, Paul (OPC), E-mail communication, September 20, 2003)
Avila, Lixion A. Tropical Cyclone Report, Hurricane Juan 24-29 September 2003 (Tropical Prediction Center website, www.nhc.noaa.gov/).
Bowyer, Peter, The Storm Surge and Waves at Halifax with Hurricane Juan, Environment Canada Hurricane Center website Canada Hurricane Center website.
Page last modified: