Atlantic Hurricane Season of 2003
Jack Beven and Miles B. LawrenceNational Hurricane Center, Miami, Florida
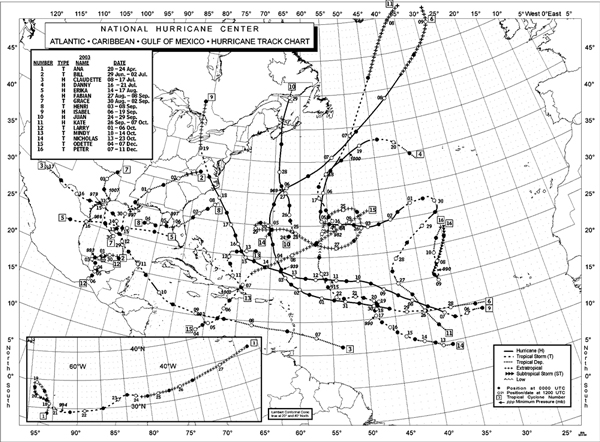 |
Figure 1 - Atlantic tropical storms and hurricanes of 2003. |
1. Introduction
There were 16 named tropical cyclones in the Atlantic basin in 2003 (Table 1, Fig. 1), seven of which became hurricanes and three became major hurricane (category three or higher on the Saffir-Simpson Hurricane Scale or SSHS). This activity was well above the long-term averages of 10 named tropical cyclones, of which six become hurricanes and two become major hurricanes. In addition, there were five tropical depressions that did not reach storm strength. Including 2003, there have been six seasons with 16 or more named tropical cyclones in the 118 seasons since 1886, so the 2003 season ranks in the upper fifth percentile of seasonal number of named tropical cyclones.
| Name | Class* | Dates** | Max. Winds KT | Min.
Pressure
hPa ) |
Direct Deaths | U.S. Damage
($ million) |
|---|---|---|---|---|---|---|
| Ann | T | 20-24 Apr | 50 | 994 | 2 | |
| Bill | T | 29 Jun - 2 Jul | 50 | 997 | 4 | 50 |
| Claudette | H | 8-17 Jul | 80 | 979 | 1 | 180 |
| Danny | H | 16-21 Jul | 65 | 1000 | ||
| Erika | H | 14-17 Aug | 65 | 986 | 2 | |
| Fabian | H | 27 Aug - 8 Sep | 125 | 989 | 8 | |
| Grace | T | 30 Aug - 2 Sep | 35 | 1007 | ||
| Henri | T | 3-8 Sep | 50 | 997 | ||
| Isabel | H | 6-19 Sep | 145 | 915 | 17 | 3,370 |
| Juan | H | 24-29 Sep | 90 | 969 | 2 | |
| Kate | H | 25 Sep - 7 Oct | 110 | 952 | ||
| Larry | T | 1-6 Oct | 55 | 993 | 5 | |
| Mindy | T | 10-14 Oct | 40 | 1002 | ||
| Nicholas | T | 13-23 Oct | 60 | 990 | ||
| Odette | T | 4-7 Dec | 55 | 993 | 8 | |
| Peter | T | 7-11 Dec | 60 | 990 | ||
|
* T - tropical storm, maximum sustained winds 34-63 KT;
H - hurricane, maximum sustained winds 64 KT or higher. ** Dates based on UTC time and include tropical depression stage. | ||||||
| Table 1. Atlantic tropical storms and hurricanes of 2003. | ||||||
There were two U.S. hurricane landfalls: Claudette struck Texas near Matagorda Island as a category-one hurricane, while Isabel made landfall on the Outer Banks of North Carolina as a category-two hurricane. Isabel brought hurricane conditions to portions of North Carolina and Virginia and record flood levels from storm surge to the upper Chesapeake Bay. Elsewhere, Fabian was the most destructive hurricane to hit Bermuda in over 75 years and Juan was the worst hurricane to hit Halifax, Nova Scotia in its modern history. Erika just reached hurricane strength as it made landfall in northeastern Mexico.
This season's tropical cyclones took a total of 49 lives, including 25 in the United States. Total damage in the United States is estimated at 3.6 billion dollars, mostly from Hurricane Isabel.
An April tropical storm and two December tropical storms extended the season well beyond the normal June-through-November limits. Ana was the first April tropical storm on record and only one other year, 1887, has produced two December storms.
In the individual summaries below, dates are based on Universal Coordinated Time.
2. Individual storm summaries
Tropical Storm Ana: Ana began as a non-tropical low about 210 nmi south-southwest of Bermuda on 18 April. After making a cyclonic loop, it developed sufficient organized convection to become a subtropical storm on 20 April. It acquired tropical characteristics early on 21 April when its maximum sustained winds were estimated at 50 kt. Ana moved generally toward the east before becoming extratropical on 24 April. Two ships reported tropical-storm force winds during Ana. The Atlantic Forest reported 44 kt winds and a pressure of 998.0-hPa at 0900 UTC 22 April. The Rosa Delmas reported 41 kt winds at 0300 UTC 23 April. Two deaths are attributed to Ana: a boat capsized at Jupiter Inlet, Florida on 20 April, due to a combination of incoming swells from Ana and the outgoing tide.
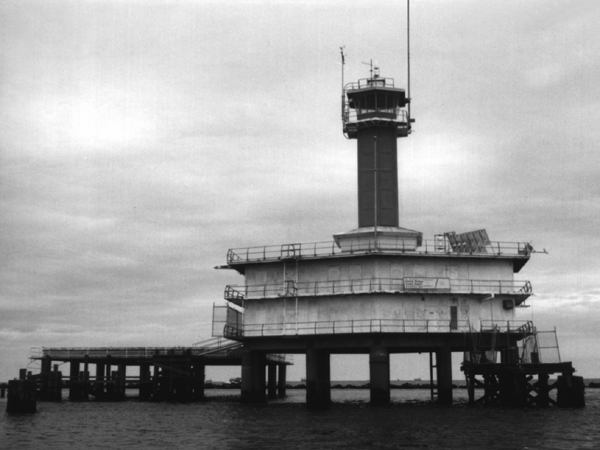 |
BURL1, a Coastal-Marine Automated Network Station at Southwest Pass, Louisiana |
Tropical Storm Bill: Bill formed over the southern Gulf of Mexico on 29 June from the interaction of a tropical wave with an upper-level low. It moved northward and intensified, making landfall in southeastern Louisiana with maximum sustained winds estimated at 50 kt near 1800 UTC the next day. The cyclone then turned northeastward across the southeastern United States, becoming absorbed by a frontal system over Virginia on 3 July. A few ships encountered Bill, and selected observations are given in Table 2. The highest ship-reported winds were from the Maersk Rapier, which reported 45 kt winds at 0000 UTC 30 June. The Louisiana Offshore Oil Port (LOOP) marine terminal reported 56 kt sustained winds with a gust to 65 kt 150 ft above sea level at 1525 UTC 30 June. On the coast, a station at Terrebonne Bay operated by the Louisiana Universities Marine Consortium reported 50 kt sustained winds with a gust to 58 kt, while the Coastal Marine Automated Network (C-MAN) station at Southwest Pass (BURL1), Louisiana, reported 48 kt sustained winds with a gust to 65 kt. On land, Bill produced 30 tornadoes from Louisiana to North Carolina, caused coastal flooding, and dumped heavy rains. One tornado struck Reserve, Louisiana, damaging 20 mobile homes and injuring four persons. Bill was responsible for four deaths and 50 million dollars in damage.
| Date/Time (UTC) | Ship Name of Call Sign | Latitude
(°N) |
Longitude (°W) | Wind dir/speed KT | Pressure hPa |
|---|---|---|---|---|---|
| 29 / 1200 | Celebration | 24.2 | 88.9 | 150 / 38 | 1013.0 |
| 29 / 1500 | C6FM7 | 25.0 | 90.0 | 130 / 40 | 1014.0 |
| 29 / 1800 | C6FM7 | 25.4 | 89.7 | 140 / 40 | 1014.0 |
| 29 / 2100 | C6FM7 | 24.9 | 89.2 | 150 / 40 | 1013.0 |
| 30 / 0000 | Maersk Rapier | 25.6 | 89.5 | 140 / 45 | 1012.1 |
| 30 / 0000 | Celebration | 27.1 | 91.9 | 080 / 35 | 1011.0 |
| 30 / 0900 | Maersk Rapier | 27.0 | 91.3 | 250 / 37 | 1009.5 |
| 30 / 1800 | Discoverer Deep Seas | 27.3 | 90.8 | 200 / 40 | 1009.1 |
| Table 2. Selected ship reports with winds of at least 34 KT for Tropical Storm Bill, 29 June - 2 July 2003. | |||||
|
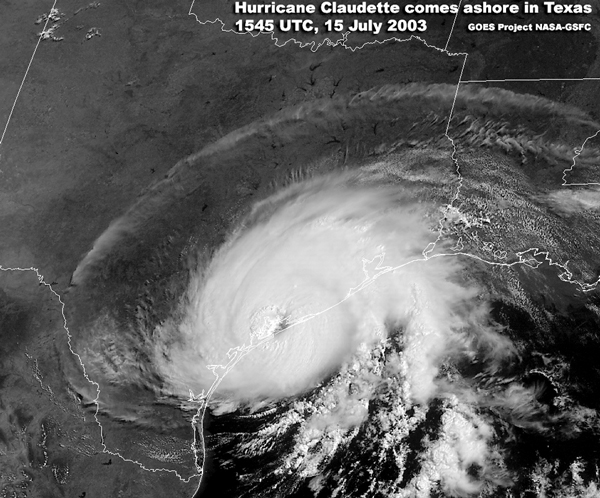
Figure 2. GOES-12 visible image of Hurricane Claudette at 1545 UTC 15 July 2003. Image courtesy of the GOES project at the NASA Goddard Space Flight Center. |
Hurricane Claudette: A strong tropical wave moved through the Windward Islands on 7 July. The system developed into Tropical Storm Claudette the next day over the central Caribbean Sea. The storm moved generally westward through 10 July, then turned northwestward on 11 July while reaching and briefly retaining hurricane strength. Claudette continued northwestward across the Yucatan Peninsula into the southern Gulf of Mexico on 11 July with 50 kt winds, then moved slowly and erratically northwestward for the next two days. The cyclone began turning westward late on 14 July, and it accelerated westward on 15 July as it regained hurricane status. Maximum sustained winds reached an estimated 80 kt (SSHS category one) as Claudette made landfall at Matagorda Island, Texas (just east of Port O'Connor), near 1500 UTC that day (Figure 2). Claudette continued generally westward across southern Texas and northern Mexico, finally dissipating over the high terrain of northwestern Mexico on 17 July. The cyclone was slow to weaken over land. Radar and satellite images indicated that its structure remained distinct for more than 24 hours after landfall, and surface observations indicated that it remained a tropical storm until reaching western Texas. Several ships encountered Claudette with selected observations in Table 3. The highest ship-reported winds were sustained 56 kt from the Rhapsody of the Seas at 0600 UTC 14 July. The Discover Spirit reported 55 kt sustained winds with a gust to 67 kt at 0000 UTC that day, and the James N. Sullivan reported 55 kt sustained winds at 1500 UTC that day. Additionally, several oil rigs in the northwestern Gulf of Mexico reported hurricane-force winds at 100-200 ft above sea level. At the coast, the Remote Automated Weather Stations (RAWS) site on Matagorda Island reported a 10-min average wind of 65 kt, while the Texas Coastal Ocean Observation Network (TCOON) station at Port O'Connor reported a 6-min average wind of 62 kt with a gust to 78 kt. Claudette produced storm surges of 3-6 ft on the Texas coast between Matagorda Island and Galveston Bay. The hurricane also generated two tornadoes and rainfall of up to 6.5 inches. It was directly responsible for one death and 180 million dollars in damage in Texas. Minor damage was reported from St. Lucia in the Windward Islands from the pre-Claudette tropical wave.
| Date/Time (UTC) | Ship Name or Call Sign | Latitude (°N) | Longitude (°W) | Wind dir/speed KT | Pressure hPa |
|---|---|---|---|---|---|
| 09 / 0300 | R. Hal Dean | 16.9 | 72.3 | 090 / 40 | 1014.5 |
| 09 / 0600 | R. Hal Dean | 16.6 | 72.0 | 090 / 36 | 1012.0 |
| 11 / 0356 | Explorer of the Seas | 21.2 | 86.2 | 080 / 50 | 1009.6 |
| 11 / 2100 | Saudi Abha | 26.1 | 87.6 | 120 / 35 | 1017.2 |
| 13 / 2100 | C6FM7 | 25.6 | 89.6 | 060 / 41 | 1014.0 |
| 14 / 0000 | Discoverer Spirit | 27.3 | 91.1 | 095 / 55G67 | N / A |
| 14 / 0600 | Cleveland | 26.6 | 90.8 | 090 / 37 | 1009.0 |
| 14 / 0600 | Rhapsody of the Seas | 28.1 | 92.8 | 050 / 56 | 1010.0 |
| 14 / 0900 | Rhapsody of the Seas | 27.6 | 92.0 | 010 / 53 | 1006.0 |
| 14 / 1100 | Ocean Valiant | 27.3 | 92.0 | 180 / 40G53 | N / A |
| 14 / 1200 | Sargasso | 27.1 | 90.8 | 150 / 44 | 1010.6 |
| 14 / 1200 | Cleveland | 27.9 | 92.6 | 090 / 37 | 1008.0 |
| 14 / 1500 | Sargasso | 27.0 | 90.5 | 150 / 44 | 1013.0 |
| 14 / 1500 | James N. Sullivan | 27.6 | 92.8 | 080 / 55 | 1003.7 |
| 14 / 1800 | Discoverer Deep Seas | 27.2 | 90.8 | 140 / 40 | 1012.8 |
| 14 / 1800 | Overseas New Orleans | 28.1 | 91.2 | 120 38 | 1012.0 |
| 14 / 2100 | James N. Sullivan | 27.5 | 92.6 | 150 / 50 | 999.7 |
| 14 / 2100 | Galveston Bay | 28.3 | 93.1 | 080 / 54 | 1005.0 |
| 15 / 1200 | Celebration | 26.4 | 94.0 | 200 / 35 | 1008.0 |
| Table 3. Selected ship reports with winds of at least 34 KT for Hurricane Claudette. | |||||
Hurricane Danny: Danny developed from a tropical wave about 550 n mi east of Bermuda on 16 July. The cyclone moved northward and then eastward across the North Atlantic Ocean beginning a lengthy clockwise loop. Danny became a hurricane with estimated maximum sustained winds of 65 kt on 18-19 July. It weakened to a tropical storm later on 19 July, to a tropical depression on 20 July, and to a non-convective remnant low on 21 July. The remnant low continued on the clockwise track, with a smaller loop superimposed on the larger-scale track, for six more days. It finally dissipated on 27 July about 1080 nmi east of Bermuda and only 550 nmi east of the point where Danny originated. A ship with the call sign MANE reported 39 kt winds at 1200 UTC 20 July.
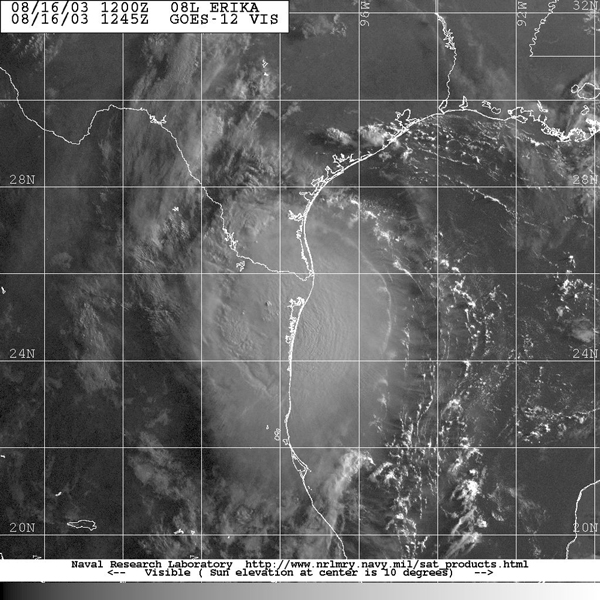
Hurricane Erika: Erika was first detected as a weak surface low detached from a decaying frontal system about 1000 nmi east of Bermuda on 8 August. This low interacted with an upper-level cold low and the combined system moved across the Bahamas and south Florida. After several attempts to develop in the Atlantic, the system developed into Tropical Storm Erika about 75 nmi west of Ft. Myers, Florida on 14 August. Erika moved quickly slightly south of due west across the Gulf of Mexico and it briefly was a hurricane just before landfall near Boca San Rafael, Mexico around 1030 UTC 16 August (Figure 3). The cyclone moved west-southwestward after landfall and dissipated over northeastern Mexico early the next day. Two ships encountered the northern fringe of Erika. The Discoverer Deep Seas reported 40 kt winds at 1200 UTC 15 August, while the Lykes Discoverer reported 38 kt winds at 0200 UTC the same day. NOAA buoy 42002 reported 34 kt sustained winds with a gust to 42 kt at 0030 UTC 16 August. On the coast, San Fernando, Mexico, reported 10-min average winds of 35 kt with a gust to 55 kt. Two persons died in Montemorelos, Mexico when their truck was swept away by flood waters as they tried to cross a partially submerged bridge. Portions of northeastern Mexico suffered building roof and automobile damage, as well as the blockage of numerous highways by mud slides.
|
|
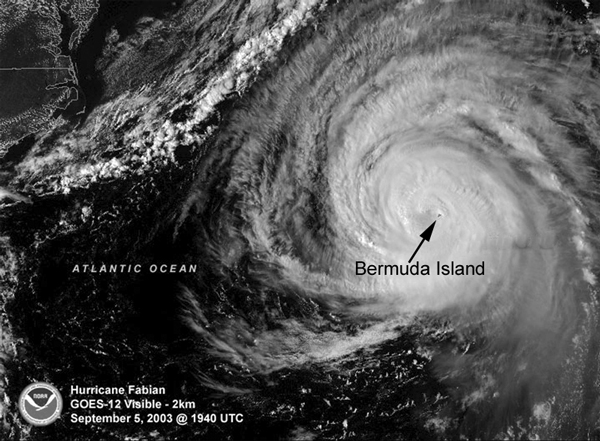
Hurricane Fabian: Long-lived Fabian followed a clockwise path around the Bermuda-Azores high pressure system. It began as a tropical depression on 27 August from a tropical wave over the far eastern tropical Atlantic Ocean. Fabian moved west-northwestward across the tropical Atlantic from 27 August until 3 September. During that time, it became a tropical storm on 28 August, a hurricane on 30 August, and reached an estimated peak intensity of 125 kt (SSHS category four) on 1 September while about 265 nmi east-northeast of the Leeward Islands. Fluctuating in intensity for several days, but remaining of at least category three intensity, the hurricane turned north-northwestward on 4 September, and hit Bermuda on the next day with winds near 100 kt (Figure 4). The hurricane turned northeastward on 6 September, and this motion continued until Fabian became extratropical about 700 n mi east-northeast of Cape Race, Newfoundland, on 8 September. Several ships encountered Fabian, mainly as it crossed the north Atlantic shipping lanes (Table 4).
| Date/Time (UTC) | Ship Name or Call Sign | Latitude (°N) | Longitude (°W) | Wind dir/speed KT | Pressure hPa |
|---|---|---|---|---|---|
| 03 / 1800 | Hornstream | 20.6 | 59.4 | 180 / 35 | 1014.5 |
| 05 / 2200 | ELZU6 | 34.3 | 66.1 | 040 / 43 | 1003.0 |
| 07 / 1200 | EFKD9 | 38.4 | 51.1 | 180 / 45 | 1007.3 |
| 08 / 0300 | VEP717 | 46.7 | 48.7 | 010 / 35 | 993.8 |
| 08 / 0300 | 3FPK7 | 46.7 | 48.0 | 320 / 36 | 990.7 |
| 08 / 0300 | HP6038 | 46.4 | 48.4 | 040 / 40 | 990.9 |
| 08 / 0600 | Contship London | 43.0 | 40.8 | 200 / 35 | 1011.0 |
| 08 / 0600 | VEP717 | 46.7 | 48.7 | 350 / 40 | 995.2 |
| 08 / 0600 | 3FPK7 | 46.7 | 48.0 | 340 / 37 | 992.7 |
| 08 / 0600 | HP6038 | 46.4 | 48.4 | 310 / 41 | 993.6 |
| Table 4. Selected ship reports with winds of at least 34 KT for Hurricane Fabian, 27 August-8 September 2003. | |||||
The strongest reported wind was 45 kt at 1200 UTC 7 September from a ship with the call sign 3FKD9. On hard-hit Bermuda, a station at the Cable and Wireless reported 105 kt sustained winds with a gust to 131 kt, while Bermuda Harbor Radio reported 102 kt sustained winds with a gust of 143 kt. Both observations were 250-300 ft above ground level. Fabian caused four deaths on Bermuda as well as extensive damage estimated near 300 million U.S. dollars. The total death toll of eight includes three fishermen who drowned near Newfoundland and a rip current drowning near Cape Hatteras, North Carolina.
Tropical Storm Grace: The short-lived and disorganized Grace developed from a tropical wave that moved westward from the coast of Africa on 19 August. The wave became a tropical depression and then a minimal tropical storm on 30 August over the west-central Gulf of Mexico. Grace moved northwestward to the Texas coast near Galveston on 31 August as a weakening tropical storm. It weakened to a depression as it moved inland that day, then merged with a frontal system over Arkansas two days later. Two ships encountered Grace. An unidentified ship reported 40 kt sustained winds with a gust to 50 kt at 1500 UTC 30 August, while the Sealand Challenger reported 36 kt winds at 0000 UTC 31 August. Several oil rigs reported tropical-storm force winds several hundred ft above sea level. At the coast, the C-MAN station at Sea Rim State Park, Texas, reported 35 kt sustained winds with a gust to 46 kt at 1450 UTC 31 August. Grace caused no casualties and little damage.
Tropical Storm Henri: Henri became a depression from a tropical wave on 3 September over the east-central Gulf of Mexico. It moved erratically eastward through early on 6 September with maximum sustained winds briefly reaching an estimated 50 kt on 5 September. Henri then weakened and accelerated northeastward across north-central Florida as a tropical depression. Henri became extratropical on 8 September off the coast of the Carolinas, with the low moving inland over North Carolina on 12 September. No ships reported tropical-storm force winds from Henri. However, NOAA buoy 42036 in the Gulf of Mexico reported 10-min average winds of 45 kt with a gust to 64 kt at 1750 UTC 5 September. Henri caused no deaths and little damage.
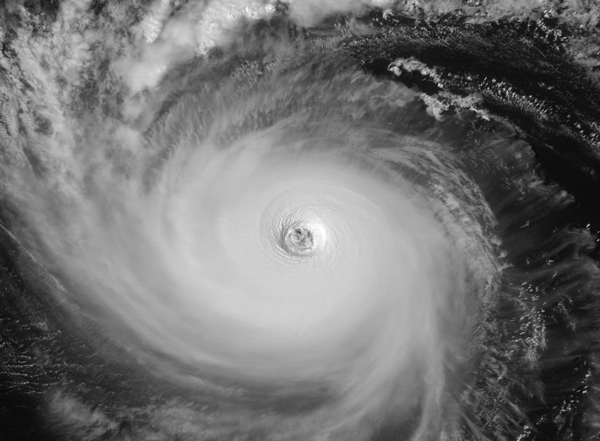 |
Figure 5. GOES-12 visible image of Hurricane Isabel at 1815 UTC 12 September 2003. Image courtesy of the Cooperative Institute for Meteorological Satellite Studies of the University of Wisconsin. |
Hurricane Isabel: Isabel, a classic Cape Verde hurricane, began as a depression over the eastern tropical Atlantic Ocean on 6 September. It moved westward and became a tropical storm later that day, then turned west-northwestward the next day while becoming a hurricane. The cyclone continued west-northwestward until 10 September, and then it turned westward. Maximum sustained winds reached an estimated 145 kt (SSHS category five) on 11 September. Isabel maintained 130-140 kt maximum winds until 15 September (Figure 5). The hurricane resumed a west-northwestward track on 13 September, then turned north-northwestward while weakening on 15 September. This motion continued until Isabel made landfall with maximum sustained winds estimated at 90 kt (SSHS category two) near Drum Inlet, North Carolina around 1700 UTC 18 September. Isabel continued north-northwestward after landfall, with the center crossing northeastern North Carolina into central Virginia by early 19 September as it weakened to a tropical storm. The center continued across northeastern West Virginia, northwestern Maryland, and western Pennsylvania, where Isabel lost tropical characteristics. The extratropical low continued across the Great Lakes into Canada where it was absorbed by a frontal system early on 20 September. Shipping largely avoided the wrath of Isabel, with the most significant reports coming from near the U. S. east coast as Isabel made landfall (Table 5). A ship with the call sign ZIPR7 reported 52 kt winds at 1200 UTC 17 September. NOAA Buoy 41002 reported 52 kt sustained winds with a gust to 70 kt at 0540 UTC 18 September, along with a 978.8-hPa pressure at 0800 UTC that day. At the coast, an instrumented tower at Cape Hatteras, North Carolina (operated by the University of Florida and Clemson University), reported 69 kt sustained winds with a gust to 85 kt at 1622 UTC 18 September, while a similar tower in Atlantic Beach, North Carolina, measured a 962.8-hPa pressure at 1645 UTC The National Ocean Service station at the Cape Hatteras Pier reported 6-min average winds of 68 kt with a gust to 83 kt before the station was disabled by the storm, likely before the strongest winds arrived. Although Isabel's intensity decreased as it approached landfall, its horizontal size increased.
| Date/Time (UTC) | Ship Name or Call Sign | Latitude (°N) | Longitude (°W) | Wind dir/speed KT | Pressure hPa |
|---|---|---|---|---|---|
| 17 / 0300 | Duncan Island | 27.4 | 68.7 | 160 / 42 | 1007.5 |
| 17 / 0900 | Duncan Island | 29.1 | 67.9 | 160 / 45 | 1010.0 |
| 17 / 0900 | ZIPR7 | 32.0 | 68.3 | 110 / 45 | 1010.7 |
| 17 / 1200 | ZIPR7 | 30.2 | 67.4 | 150 / 52 | 1011.6 |
| 17 / 1800 | Sealand Hawaii | 31.0 | 68.5 | 130 / 40 | 1010.2 |
| 17 / 1800 | Galveston Bay | 33.4 | 76.7 | 020 / 37 | 1010.8 |
| 19 / 0000 | Orietal Bay | 35.5 | 73.1 | 140 / 37 | 1010.6 |
| 19 / 0300 | P&O Ned Lloyd Pegasus | 34.7 | 74.8 | 190 / 37 | 1010.5 |
| 19 / 0600 | P&O Ned Lloyd Pegasus | 38.9 | 72.9 | 160 / 45 | 1015.3 |
| 19 / 1200 | James R. Barker | 42.2 | 81.1 | 060 / 42 | 1001.0 |
| Table 5. Selected ship reports with winds of at least 34 KT for Hurricane Isabel, 6-19 September 2003. | |||||
The large wind field led to portions of eastern North Carolina and southeastern Virginia experiencing sustained hurricane-force winds. Tropical-storm-force winds spread inland over a large area from eastern North Carolina northward to the eastern Great Lakes and western New England, as well as spreading northward along the Atlantic coast to New York. Storm surge flooding along the Atlantic coast was 6 to 8 feet above normal near the point of landfall and above normal tides extended to Long Island. Over 10 feet of surge was reported on North Carolina's Neuse River. Surge values of 6 to 8 feet were observed in the upper reaches of Chesapeake Bay and in many of the rivers that normally drain into the bay, including the Potomac and James Rivers. Water levels in Washington, D.C., Baltimore, and Annapolis exceeded the previous record levels established by the 1933 Chesapeake-Potomac hurricane. Delaware Bay and the Delaware River also had significant storm surge flooding. Isabel was directly responsible for 17 deaths: ten in Virginia, two in New Jersey, and one each in Maryland, North Carolina, Pennsylvania, Rhode Island, and Florida. The Florida and Rhode Island deaths were drownings in the high surf generated by Isabel. The total damage caused by Isabel is currently estimated at 3.37 billion U.S. dollars.
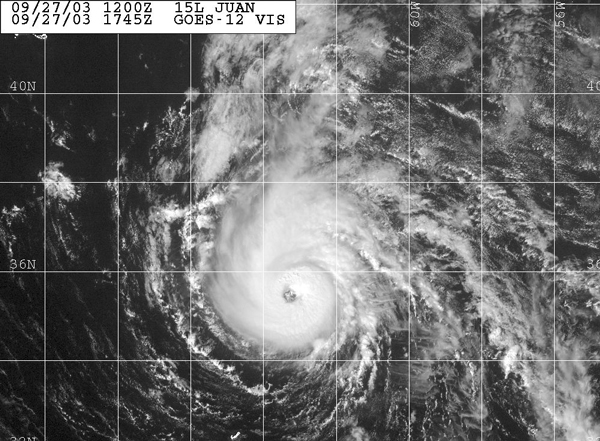 |
Figure 6. GOES-12 visible image of Hurricane Juan at 1745 UTC 27 September 2003. Image courtesy of the Naval Research Laboratory, Monterey, California. |
Hurricane Juan: Juan had a complex formation, becoming a depression from the interaction of a tropical wave with a large upper-level low about 300 n mi southeast of Bermuda on 24 September. Juan initially had some subtropical characteristics, but became fully tropical while it moved east of Bermuda. It became a hurricane on 26 September, and on 27 September its maximum sustained winds reached an estimated 90 kt while it jogged north-northwestward (Figure 6).
Juan moved northward for the rest of its life, and this track brought the center to the coast of Nova Scotia southwest of Halifax near Prospect and Peggy's Cove around 0300 UTC 29 September with estimated winds of 85 kt (SSHS category two). The hurricane continued northward across Prince Edward Island, then weakened to a tropical storm over the Gulf of St. Lawrence. Juan was absorbed by a frontal system over eastern Canada late on 29 September.
Three ships reported tropical-storm force winds from Juan. The Astron reported 60 kt winds at 0600 UTC 29 September, while the Leif Ericson reported 49 kt winds at 0300 UTC that day. The Ericson also reported a 981.1-hPa pressure at 0400 UTC 29 September. Additionally, a ship with the call sign WCY533 reported 45 kt winds at 0000 UTC 29 September. Canadian buoy 44142 reported 54 kt sustained winds at 2300 UTC 28 September and a 974.7-hPa pressure an hour later. At the coast, McNabb Island, Nova Scotia, reported a 2-min average wind of 81 kt with a gust to 95 kt at 0324 UTC 29 September and a pressure of 982.1-hPa 36 min later. Juan caused extensive damage from the Halifax area northward to Prince Edward Island including to many boats along the coast. The hurricane directly caused two deaths and the Canadian Hurricane Centre reports that Juan is the most damaging storm in modern history for Halifax.
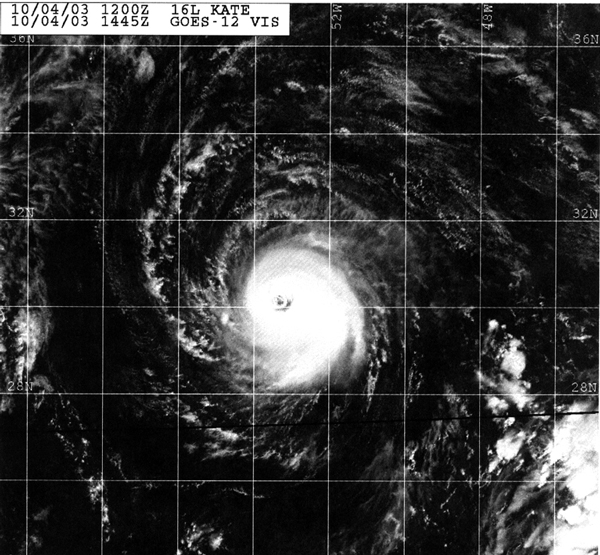 |
Figure 7. GOES-12 visible image of Hurricane Kate at 1445 UTC 4 October 2003. Image courtesy of the Naval Research Laboratory, Monterey, California. |
Hurricane Kate: Kate formed into a depression from a tropical wave in the central tropical Atlantic Ocean on 25 September. The cyclone moved northwestward for two days, becoming a tropical storm late on 27 September. It then turned northeastward and continued this motion until 30 September. Kate became a hurricane on 29 September, then interaction with an upper-level low caused weakening to tropical-storm status.
This low also helped Kate turn west-southwestward on 1-2 October. Kate regained hurricane status late on 1 October, and continued to strengthen as it moved westward on 3-4 October. Maximum sustained winds reached an estimated 110 kt (SSHS category three) late on 4 October (Figure 7). The hurricane turned northward on 5 October and northeastward the next day. This motion continued until Kate became a powerful extratropical low east of Newfoundland near 0000 UTC 8 October.
The cyclone merged with another low pressure system near Norway on 10 October. Several ships encountered the fringes of Kate during its lifetime, especially as it moved across the north Atlantic shipping lanes (Table 6). A ship with the call sign VEP717 reported 51 kt winds at 2100 UTC 7 October, while a ship with the call sign HP6038 reported 50 kt winds at 1500 UTC that day. Additionally, Canadian buoy 44140 reported 39 kt sustained winds at 1400 UTC that day.
| Date/Time (UTC) | Ship Name or Call Sign | Latitude (°N) | Longitude (°W) | Wind dir/speed KT | Pressure hPa |
|---|---|---|---|---|---|
| 28 / 1200 | Maracas Bay | 23.0 | 42.3 | 180 / 41 | 1008.2 |
| 07 / 0300 | Mackinac Bridge | 37.2 | 53.3 | 220 / 39 | 1007.0 |
| 07 / 1200 | Scadinavian Highway | 40.2 | 50.3 | 250 / 37 | 1008.0 |
| 07 / 1200 | Leonard J. Cowley | 42.0 | 46.9 | 150 / 35 | 1011.7 |
| 07 / 1200 | Alligator Reliance | 43.6 | 44.0 | 150 / 35 | 1015.5 |
| 07 / 1200 | Bussol | 44.5 | 52.8 | 320 / 39 | 1001.5 |
| 07 / 1500 | Odoyevsk | 43.4 | 51.7 | 300 / 33 | 993.3 |
| 07 / 1500 | HP6038 | 46.4 | 48.4 | 090 / 50 | 992.1 |
| 07 / 1500 | VEP717 | 46.7 | 48.7 | 120 / 38 | 993.1 |
| 07 / 1800 | Alligator Reliance | 43.4 | 42.1 | 150 / 40 | 1016.0 |
| 07 / 1800 | 3FPK7 | 46.7 | 48.0 | 240 / 40 | 988.9 |
| 07 / 2100 | VEP717 | 46.7 | 48.7 | 320 / 51 | 1006.0 |
| 07 / 2100 | 3FPK7 | 46.7 | 48.0 | 290 / 48 | 1007.8 |
| Table 6. Selected ship reports with winds of at least 34 KT for Hurricane Kate, 25 September - 7 October 2003. | |||||
Tropical Storm Larry: Larry developed from a low pressure area spawned by a tropical wave that interacted with a frontal system. The low became an extratropical gale center on 30 September, then developed tropical characteristics and became a tropical storm over the Bay of Campeche on 1 October. Maximum sustained winds reached an estimated 55 kt the next day as the tropical storm drifted slowly and erratically southward moving inland on 5 October with winds estimated at 50 kt near Paraiso, Mexico, in the state of Tabasco. Larry dissipated inland over the state of Vera Cruz the next day. A few ships encountered Larry while it meandered in the Bay of Campeche (Table 7). The strongest reported winds were from a ship with the call sign ZIYE7, 50 kt winds at 1800 UTC 2 October. Additionally, several oil rigs in the Bay of Campeche reported tropical-storm force winds at 100-200 feet above the surface.
| Date/Time (UTC) | Ship Name or Call Sign | Latitude (°N) | Longitude (°W) | Wind dir/speed KT | Pressure hPa |
|---|---|---|---|---|---|
| 29 / 1800 | 3FPQ9 | 25.8 | 87.7 | 030 / 35 | 1013.0 |
| 02 / 0300 | ELXU6 | 19.8 | 94.8 | 280 / 46 | 1008.4 |
| 02 / 1800 | ZIYE7 | 19.9 | 96.2 | 320 / 50 | 1006.0 |
| 02 / 2100 | ZIYE7 | 20.5 | 96.5 | 280 / 48 | 1005.5 |
| 03 / 0000 | Endurance | 19.3 | 94.1 | 280 / 45 | 1009.0 |
| Table 7. Selected ship reports with winds of at least 34 KT for Hurricane Larry, 1-6 October 2003. | |||||
Heavy rains affected portions of southeastern Mexico and there were five deaths from freshwater floods attributed to Larry.
Tropical Storm Mindy: Mindy originated from a tropical wave and became a tropical storm with 40 kt estimated maximum sustained winds on 10 October near the northeastern tip of the Dominican Republic. Mindy moved northwestward to northward for two days, gradually weakened to a depression by 12 October, and then turned eastward. The depression dissipated on 14 October while located about 400 nmi south-southwest of Bermuda. Although Mindy passed near the Turks and Caicos Islands on 11October, heavy rain and tropical storm force winds remained to the east of these islands. Mindy produced periods of heavy rain over portions of Puerto Rico and eastern Dominican Republic.
Tropical Storm Nicholas: Nicholas formed from a tropical wave on 13 October about 790 nmi west-southwest of the Cape Verde Islands. Moving generally northwestward, the system became a tropical storm on 14 October and reached an estimated peak intensity of 60 kt on 17 October. After a slow northward jog from 18-20 October, the storm turned westward on 20-21 October. Nicholas turned north-northwestward on 23 October while weakening to a depression, then it turned northward and degenerated into a non-convective remnant low the next day several hundred nmi southeast of the northern Leeward Islands. The low merged with a cold front later that day and meandered erratically over the western North Atlantic Ocean for several more days.
Tropical Storm Odette: Odette is the first December storm on record to develop over the Caribbean Sea. It developed from an area of disturbed weather that originated along a frontal zone and then lingered over the southwestern Caribbean Sea for several days. The disturbance became a tropical depression, and then a tropical storm, on 4 December about 300 nmi south of Kingston, Jamaica. The storm moved slowly northeastward and maximum sustained winds reached an estimated 55 kt early on 6 December. Later that day, Odette made landfall on the Barahona Peninsula of the Dominican Republic with maximum sustained winds estimated at 50 kt. Odette weakened while moving over Hispaniola, then moved into the Atlantic on 7 December and became extratropical as it merged with a frontal trough. Odette's extratropical remnant circulation raced northeastward and maintained a distinct circulation for two more days before dissipating late on 9 December.
Three ships reported tropical-storm force winds in Odette. A ship with the call sign MZRS8 reported 38 kt winds at 1200 UTC 6 December, while a ship with the call sign C6FU9 reported 37 kt winds at 1200 UTC 5 December. The Mikhail Kutuzov reported 35 kt winds at 1200 UTC 8 December. Inland, Odette dropped rainfall of up to 9 inches over portions of the Dominican Republic and Haiti. Eight deaths related to fresh-water floods or mud slides were reported from the Dominican Republic.
Tropical Storm Peter: Peter formed from a large extratropical gale center over the eastern North Atlantic Ocean. Moving southward, the low gradually acquired organized convection and became Subtropical Storm Peter on 7 December while located about 805 nmi northwest of the Cape Verde Islands. Peter completed its transformation to a tropical storm by 9 December and reached an estimated maximum intensity of 60 kt later that day. At the same time, Peter reversed its southward motion and headed northward ahead of an approaching frontal trough, which was the system that had absorbed Odette a few days earlier. Peter weakened to a depression on 10 December. It became extratropical on 11 December and was absorbed by a cold front soon thereafter. Satellite imagery showed a short-lived eye feature on 9 December, suggesting that Peter may have briefly reached hurricane force.
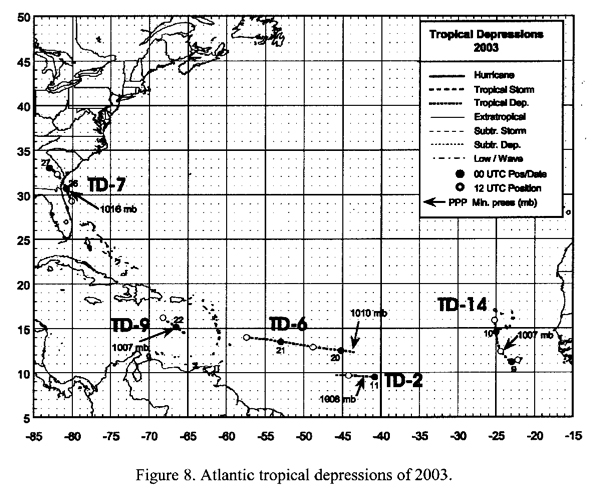
Tropical Depressions: There were five tropical depressions that did not become tropical storms (Figure 8). Tropical Depression Two formed and dissipated over the tropical Atlantic on 11 June. Tropical Depression Six also occurred over the tropical Atlantic, from 19-21 July. Tropical Depression Seven formed just east of the northeast coast of Florida on 29 July and moved inland over Georgia the next day. Tropical Depression Nine occurred over the eastern Caribbean Sea from 21-22 August. Finally, Tropical Depression Fourteen was present near the Cape Verde Islands from 8-10 September.
Page last modified: