Tropical Atlantic and Tropical East Pacific Areas September through December 2009
Jessica Schauer and Scott Stripling
Tropical Analysis and Forecast Branch,
National Hurricane Center, Miami, Florida
NOAA National Center for Environmental Prediction
A note about the loss of the QuikSCAT scatterometer instrument
Shortly after 0700 UTC on 23 Nov 2009, marine forecasters around the world lost their most powerful instrument for observing surface winds over the open ocean the NASA Quick Scatterometer, better known as QuikSCAT. The high-resolution wind measurements captured during the ten years of QuikSCAT (more than double its planned mission life) provided marine forecasters with a better understanding of the life cycle of tropical and extratropical cyclones, as well as gap wind events. QuikSCAT data also assisted forecasters with the analysis of surface features and related wind fields in regions with extremely sparse in situ data coverage, i.e. the open oceans of the world. While there is wind data still currently available to forecasters from other satellite scatterometers, such as the MetOp Advanced SCATerometer (ASCAT) and the U.S. Navys satellite-based polarimetric microwave radiometer (WindSat), these instruments provide less areal coverage and reduced resolution as compared to QuikSCAT. In this post-QuikSCAT era, it will be even more important for our partners within the Voluntary Observing Ship (VOS) program to provide observations. This data tremendously improves the quality of our analyses and forecasts. We thank you for your continued participation in the VOS program. Without your participation, our products would be less accurate, making the seas a more dangerous place to do your jobs.
North Atlantic Ocean to 31N and Eastward to 35W, including the Caribbean Sea and the Gulf of Mexico
The fall season began quietly across the Tropical Analysis and Forecast Branch Atlantic Area of Responsibility (AOR) with no non-tropical advisories issued during September. Only two gale events occurred in October, while November became more active, with eight gale events. December, however, proved to be quite active, with eleven gale events and one storm force wind event. Table 1 summarizes these warnings.
| Onset | Region | Peak Wind Speed | Gale / Storm Duration |
|---|---|---|---|
| 1200 UTC 31 Oct | Gulf of Mexico | 35 KT | 37 hr |
| 1800 UTC 31 Oct | SW N Atl | 35 KT | 24 hr |
| 1200 UTC 03 Nov | Gulf of Mexico | 35 KT | 24 hr |
| 1800 UTC 06 Nov | Gulf of Mexico | 35 KT | 12 hr |
| 0000 UTC 08 Nov | SW N Atlantic (Florida Straits) | 35 KT | 12 hr |
| 0000 UTC 08 Nov | Gulf of Mexico | 40 KT | 36 hr |
| 0600 UTC 09 Nov | SW N Atlantic (Florida Straits) | 35 KT | 06 hr |
| 1200 UTC 10 Nov | Gulf of Mexico | 35 KT | 12 hr |
| 1200 UTC 10 Nov | SW N Atlantic | 35 KT | 18 hr |
| 1500 UTC 17 Nov | Gulf of Mexico | 35 KT | 03 hr |
| 1800 UTC 01 Dec | Gulf of Mexico | 35 KT | 30 hr |
| 1800 UTC 02 Dec | SW N Atlantic | 35 KT | 12 hr |
| 1200 UTC 04 Dec | Gulf of Mexico | 40 KT | 30 hr |
| 1200 UTC 12 Dec | Caribbean | 35 KT | 84 hr |
| 1200 UTC 14 Dec | SW N Atlantic | 35 KT | 12 hr |
| 0600 UTC 16 Dec | Gulf of Mexico | 35 KT | 42 hr |
| 1200 UTC 18 Dec | SW N Atlantic | 35 KT | 42 hr |
| 1200 UTC 22 Dec | SW N Atlantic | 40 KT | 30 hr |
| 1200 UTC 24 Dec | Gulf of Mexico | 35 KT | 12 hr |
| 1200 UTC 25 Dec | SW N Atlantic | 45 KT | 66 hr |
| 1800 UTC 26 Dec | SW N Atlantic | 50 KT | 24 hr |
| 0600 UTC 29 Dec | SW N Atlantic | 35 KT | 36 hr |
The Soufriere Hills Volcano reawakens
Tropical cyclones, gales and large swell events are not the only marine hazards that may affect the Atlantic basin during the fall months. Volcanic ash is a marine hazard that impacts the Caribbean region. Soufriere Hills Volcano in Montserrat, became active in 1992, and has spewed large amounts of ash into the middle and upper atmosphere on several occasions. After being quiet during most of 2009, the volcano resumed the venting of low level ash emissions in early October. Typically, these low level emissions consisting of ash, steam and other gases from the volcano, rise only a few thousand feet into the atmosphere and are then transported directly downwind of the volcano in a narrow streaming band. However, a more significant emission to above 12000 ft occurred during the morning of 16 Oct, with the associated plume of ash eventually spreading northwest across much of the extreme northeast Caribbean. (NESDIS 2009) See Atlantic Figure 1. This required a VOLCANIC ASH ADVISORY for a portion of the NE Caribbean through 1200 UTC 17 Oct. Advisories and forecasts for volcanic eruptions are issued by nine Volcanic Ash Advisory Centers globally. The Washington VAAC is responsible for much of North America, Central America, northern South America, and a large portion of the central and eastern Pacific regions. This AOR includes the Caribbean Sea and the Soufriere Hills Volcano. Statements and forecasts issued by the Washington VAAC are used by TAFB to prepare Volcanic Ash Advisories for our AOR. A Volcanic Ash Advisory indicates that a volcanic eruption has produced significant amounts of ash suspended in the atmosphere, such that visibilities will be restricted to 5 nm or less, and falling ash will present damage potential if ingested by engines and other mechanical parts. Additionally, there is the risk for respiratory problems in humans.
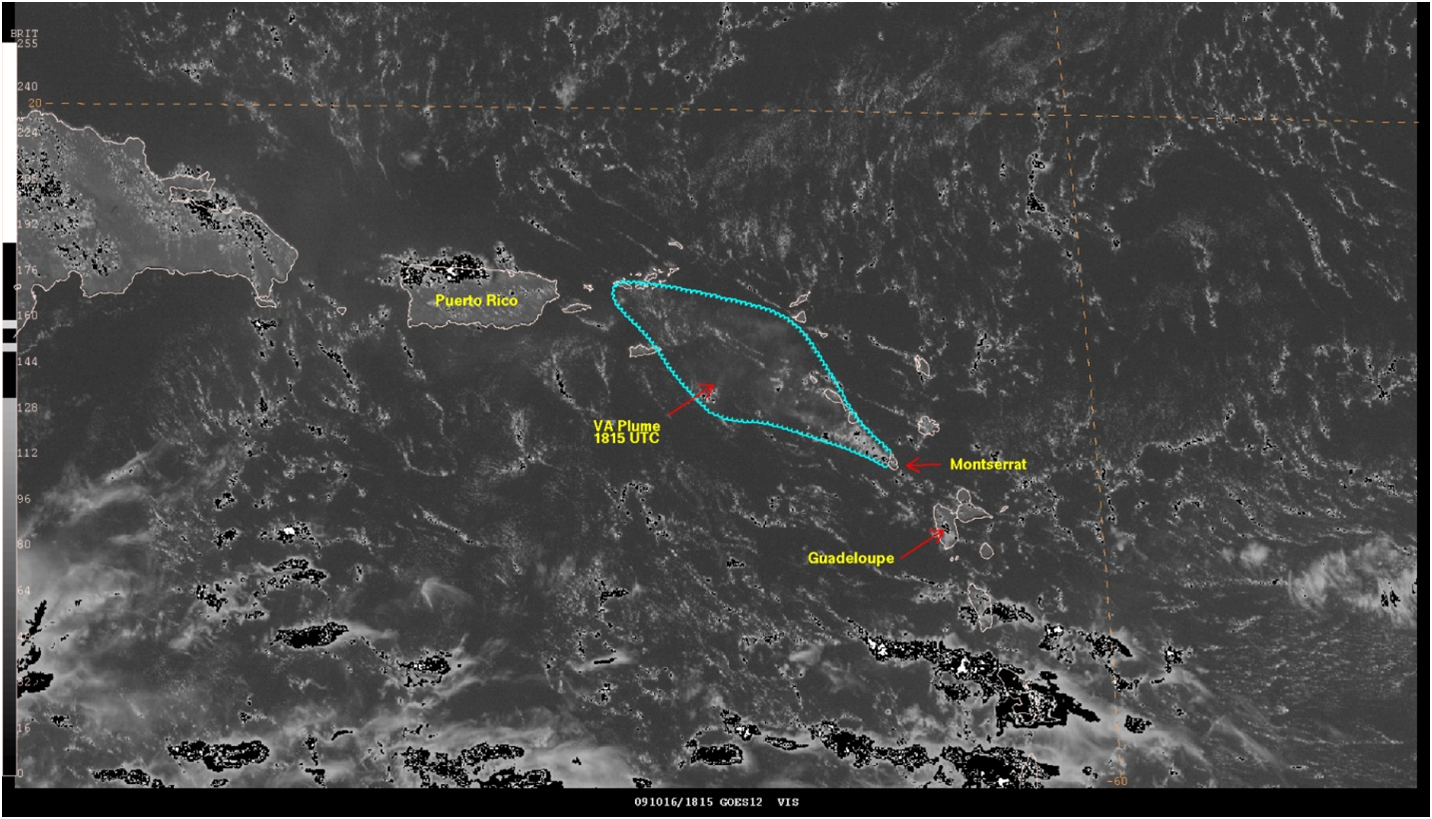
Atlantic Figure 1. 1815 UTC 17 Oct GOES visible image depicting ash plume spreading northwestward across the northeast Caribbean
The complex weather pattern of early November
Although the 2009 hurricane season witnessed lower than normal annual activity, Hurricane Ida contributed to widespread high winds and seas during early November across the Gulf of Mexico and portions of the SW Atlantic well away from the core circulation. The broad scale pattern across North and Central America, and the adjacent waters during the life cycle of Ida (Avila and Cangialosi, 2010) consisted of a strong high pressure ridge across much of the south and central U.S. and broad low pressure over the tropical eastern Pacific extending across Central America and into the SW Caribbean. The pressure gradient between these two systems, and the further influence of Ida, eventually produced gales in separate and shifting zones, from the Gulf of Tehuantepec to the northwest Bahamas. (see Pacific section for more detail) The same cold front that initiated an extended period of gales in the Gulf of Tehuantepec on 1 Nov continued to move southeastward across the Gulf of Mexico, and by 7 Nov, the weakening front had become aligned nearly west to east from the southern Gulf of Mexico through the Straits of Florida, across the central Bahamas and into the SW North Atlantic along 23-24N. The large high pressure ridge had shifted northeastward by this time and was centered over the southeastern U.S. extending up the eastern seaboard. This configuration produced a tight pressure gradient and a broad zone of 20-25 KT winds along and north of the old frontal boundary for several days, with gales lingering across the SW Gulf of Mexico since the initial frontal passage on 1 Nov. These strong winds north of the weakening frontal boundary increased to gales across the southeast Gulf early on 8 Nov, as Ida moved north through the NW Caribbean, and intensified into a hurricane. An 1142 UTC QuikSCAT pass on the morning of 8 Nov revealed the circulation of Ida, and the gales across the southeast Gulf that were spreading east through the Straits of Florida and to the NW Bahamas. See Atlantic Figure 2. Several ships reported gale force winds across this elongated area throughout 8 and 9 Nov. On 8 Nov, from the Straits of Florida near 23.4N 79.1W Carnival Destiny (C6FN4) reported east winds at 40 KT at 0700 UTC, while further west in the southeastern Gulf near 22.3N 85.4W, Enchantment of the Seas (C6FZ7) reported east winds at 43 KT at 0900 UTC. At 1200 UTC Fantasy (H3GS) near 24.3N 87.6W reported east winds at 45 KT . As Ida continued to lift north through the Gulf during the next few days, the dissipating frontal boundary and zone of gale force winds lifted north in tandem, with gales ending across the north central Gulf the evening of 10 Nov, as Ida underwent extratropical transition near the Alabama coast.
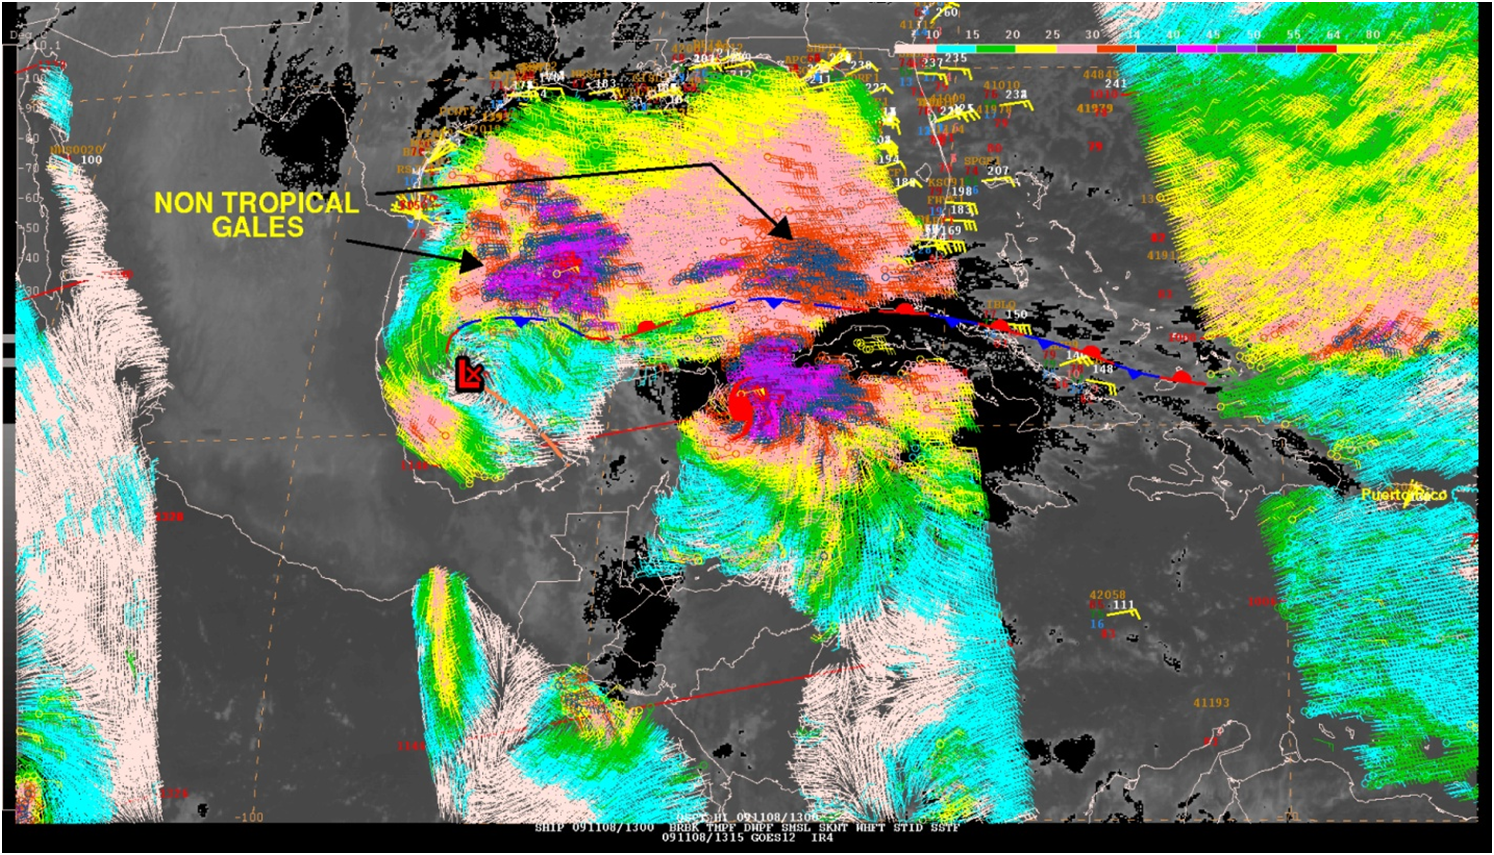
Atlantic Figure 2. 1315 UTC 8 Nov GOES IR image with 1142 UTC QukSCAT winds (center portion) overlaid. Position of Hurricane Ida in far NW Caribbean Sea depicted by red hurricane symbol, with position of dissipating frontal boundary depicted as weakening stationary front. Notice two areas of gale force winds (in blue and magenta color vectors) shown in QuikSCAT pass over the Gulf located north of the frontal boundary and removed from the core circulation of Ida.
Big swell event of Late December and Early January
A large swell event is typically generated each fall by an intense low pressure system across the North Atlantic, usually during late October or November. (Wave Information Studies, USACE Coastal & Hydraulics Laboratory, 1998) However during the fall of 2009 such an event did not occur until late December. A complex low pressure area shifted eastward into the central Atlantic on 24 Dec, became better organized, deepened rapidly during the next 48 hours, and developed into a large 966 hPa low near 38N57W on 1200 UTC 26 Dec, with hurricane force winds across the western semicircle. See Atlantic Figure 3. This large and deep low moved slowly toward the northeast during the next few days and generated a large and broad wave field aimed directly at the Lesser Antilles and the waters to the north and east. Storm force winds scraped across the far NE portions of the AOR with seas in excess of 30 ft. On 26 Dec 2100 UTC Edisongracht (PDUJ) near 29.3N 45.8W reported northwest winds at 41 KT and seas to 6 m (20 ft). NDBC buoys within a 450 nmi radius of the NE Caribbean showed seas peaking from 28 through 29 December at 4.0-5.2 m (13-17 ft) at 15-17 seconds, with the peak energy aimed just east of the island chain. A second pulse of large swell generated by this low moved through these same waters 31 December through 2 January, with maximum buoy readings of 3.6-4.6 m (11.8-15 ft) at 14-15 seconds. Atlantic Figures 4 and 5 show data from buoy 41140 located just offshore of Christiansted, St Croix, USVI. The British Virgin Islands archipelago to the north of St Croix blocks northerly swell moving through the Anegada passage and into the north coast of St Croix. However the buoy data clearly shows the two strong and distinct pulses of large long period north northeast swell refracting around the Virgin Islands archipelago, through the Anegada Passage, and reaching the north central coast of St Croix. These buoy readings also illustrate how the changing shape, intensity and direction of motion of weather systems influence their generated wave fields.
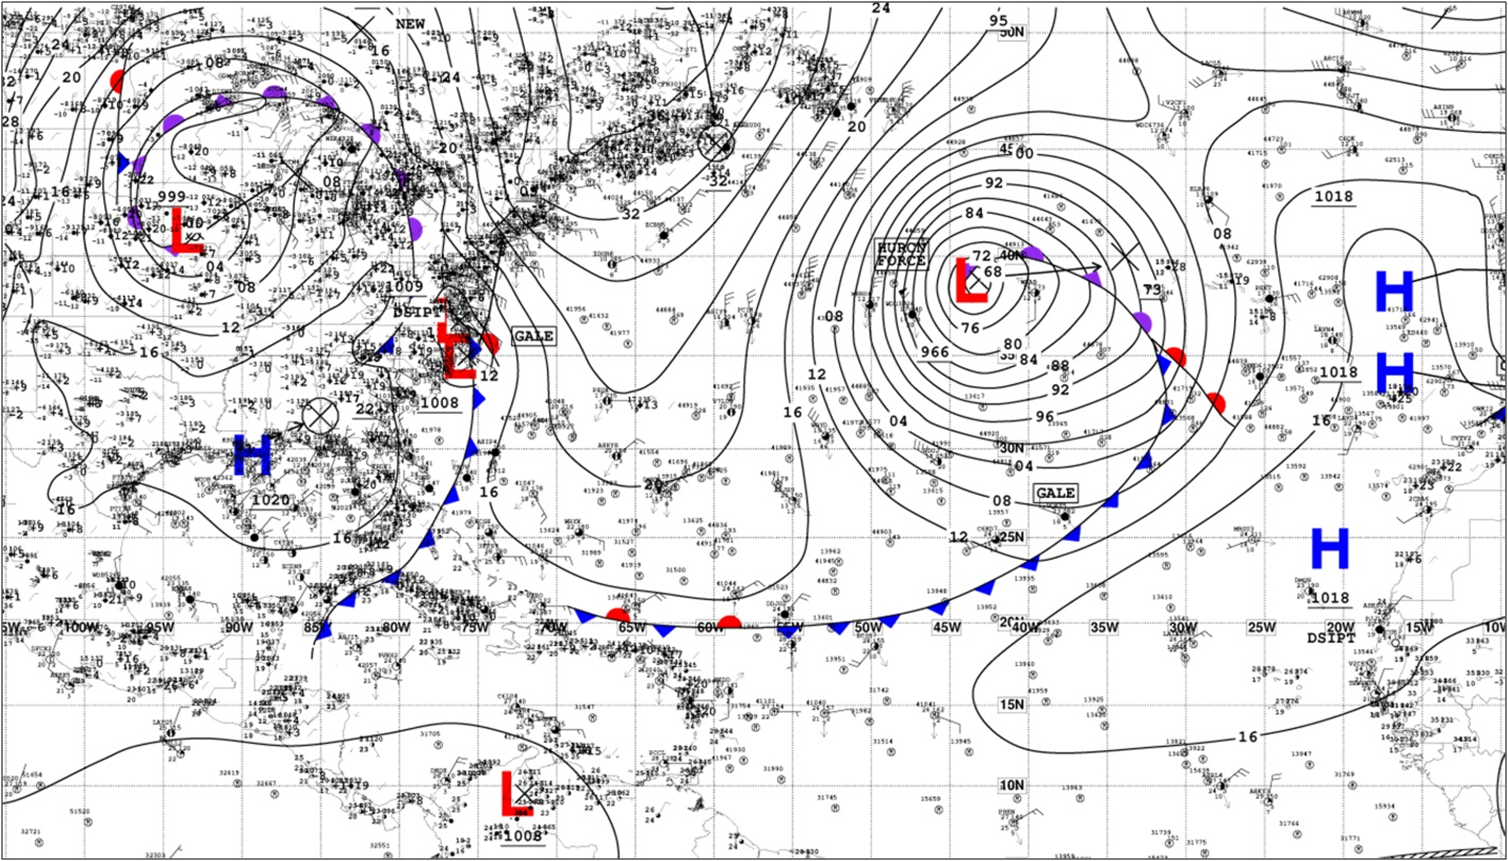
Atlantic Figure 3. The National Weather Service Unified Surface Analysis from 1200 UTC 26 Dec 2009. Note the large low pressure system over the eastern Atlantic with hurricane force winds in western semicircle, and associated northerly fetch pointed towards the Atlantic waters just east of the Lesser Antilles.
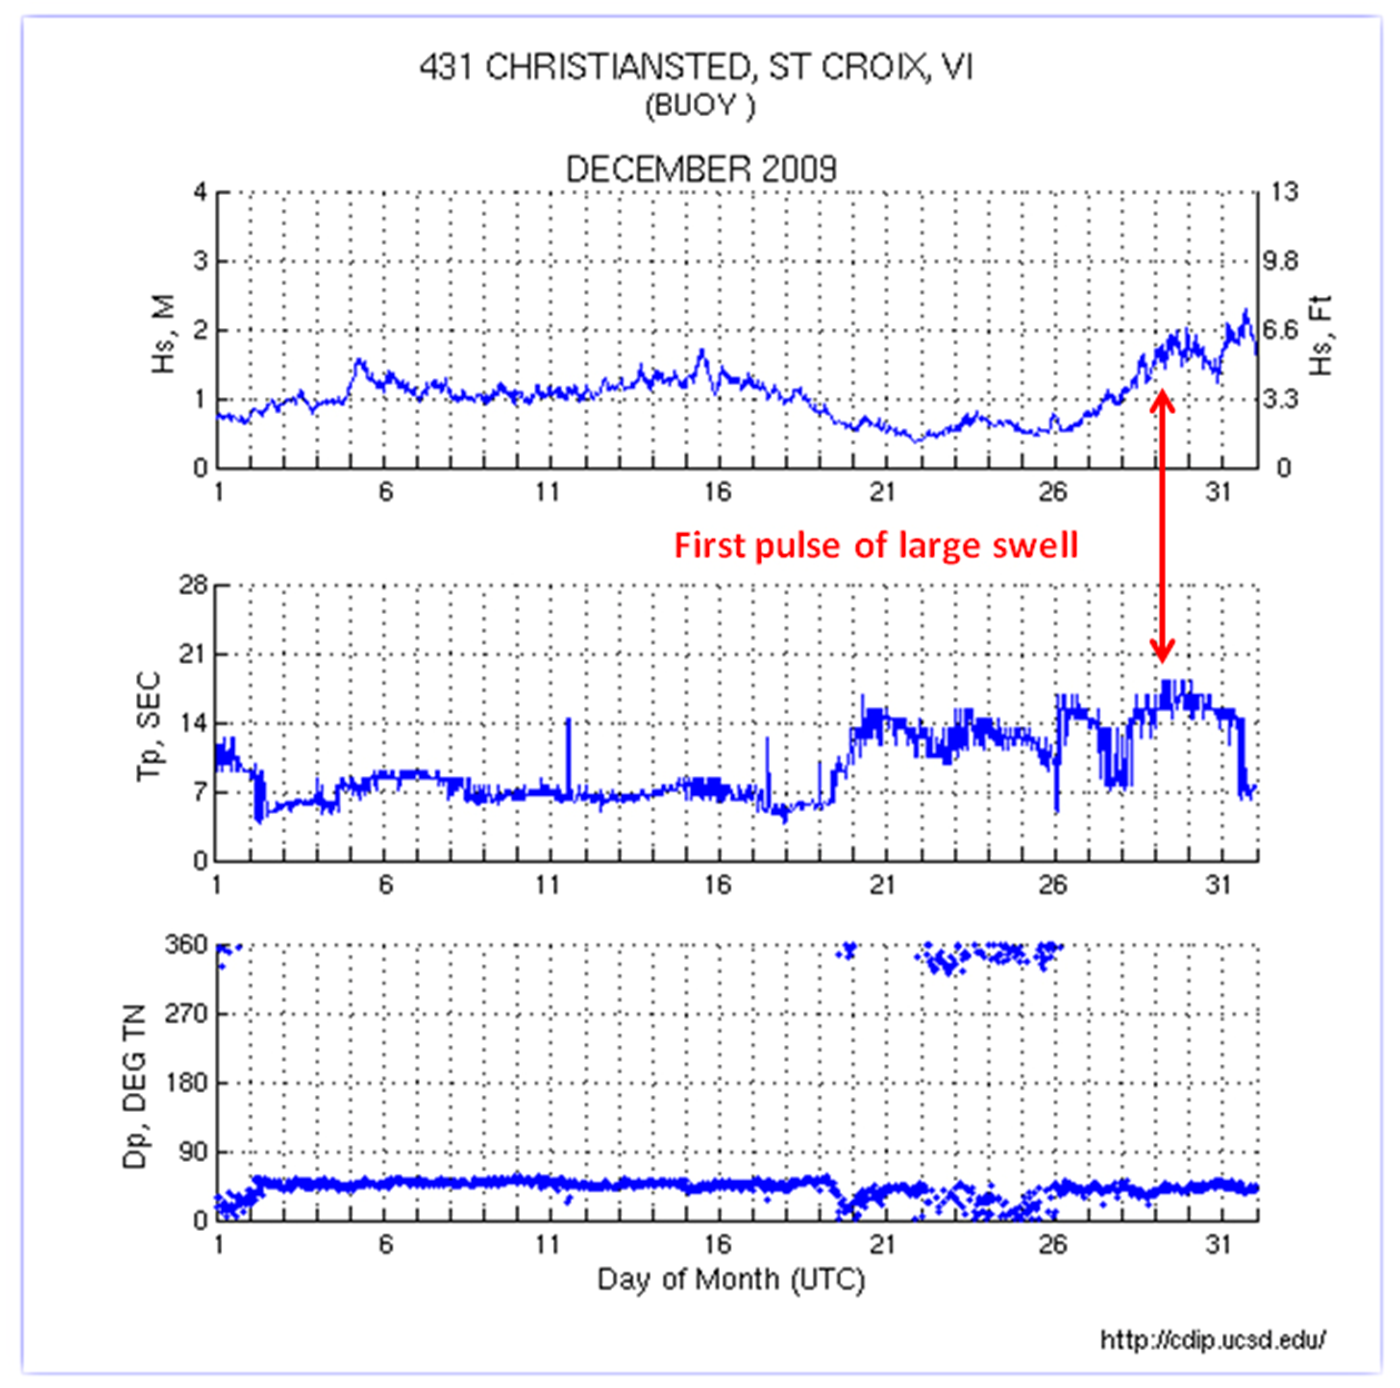
Atlantic Figure 4. December 2009 monthly summary of CDIP buoy data for 431 Christiansted, St Croix, USVI (NDBC buoy #41140). Top row depicts significant wave height, Hs, in meters, middle row depicts peak wave period, Tp, in seconds, and bottom row depicts dominant wave direction in degrees. Notice several long period swell events occurring during last 12 days of month culminating in large long period NE swell 29-31 Dec.
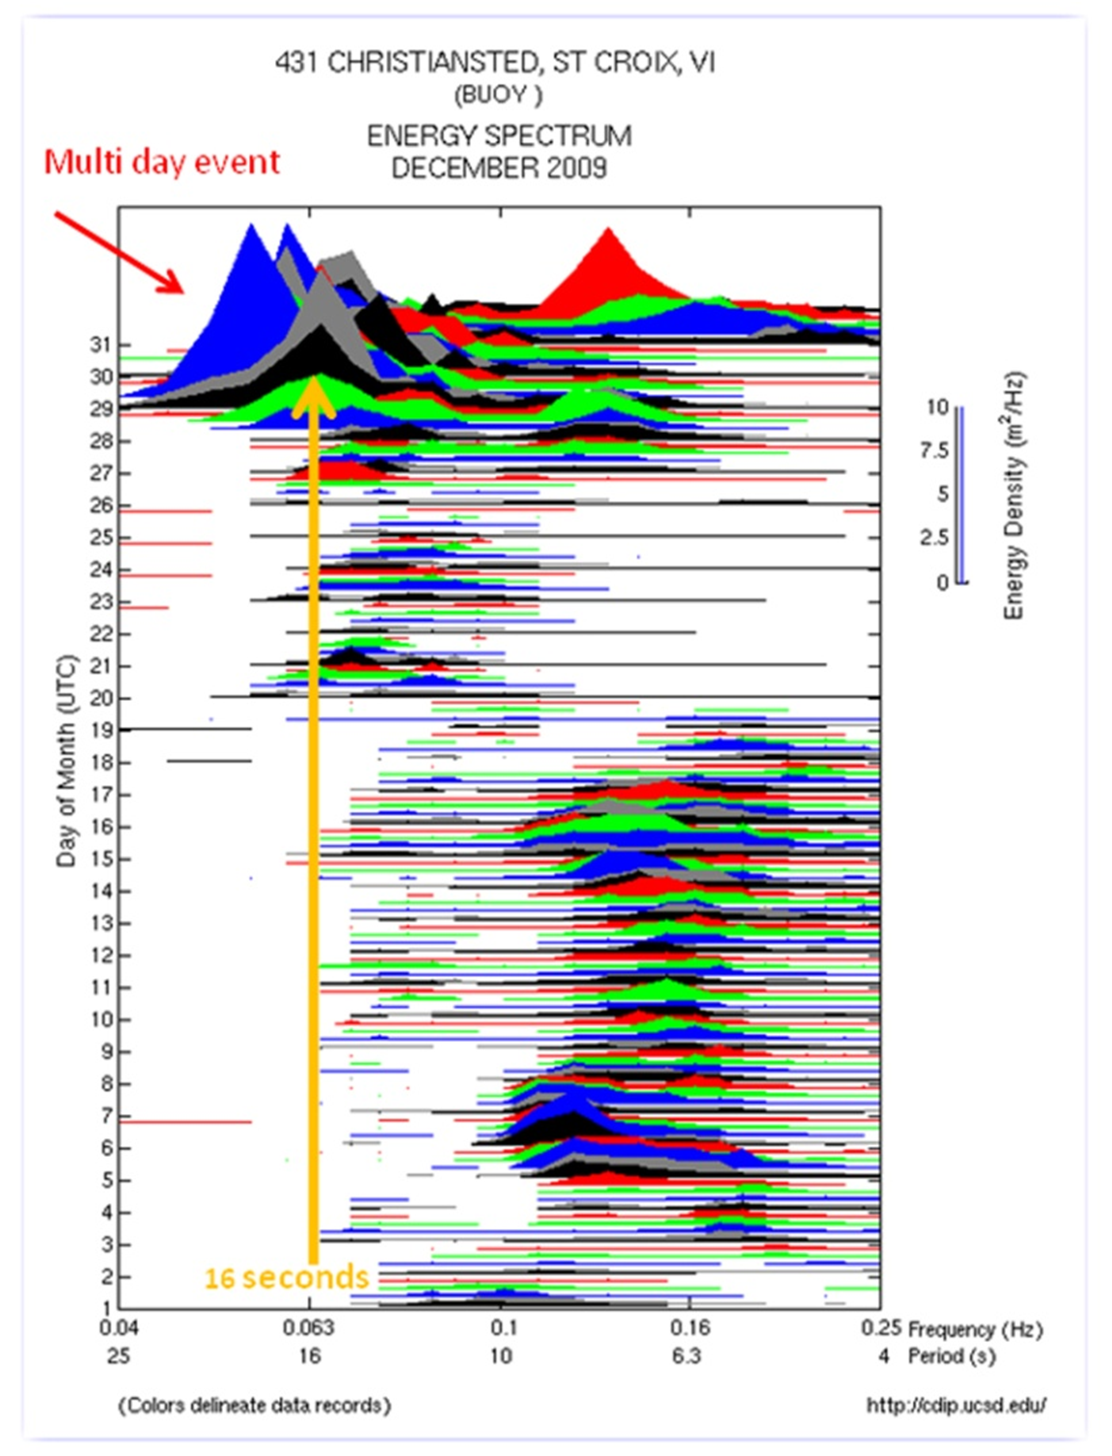
Atlantic Figure 5. December 2009 monthly summary of energy spectrum for 431 Christiansted, St Croix, USVI (NDBC buoy #41140) called a mountain plot, with day of month on left axis. The total wave energy for each day is depicted by a mountain, distributed over the spectrum of wave periods measured, with height of each mountain directly proportional to integrated energy per the scale on right. Bottom axis depicts wave frequency and period. Notice that this first half of the month was dominated by small to modest waves of 6-10 seconds, while the latter half of the month was dominated by wave periods 15 seconds and greater, and the large swell event occurring Dec 29, 30, and 31.
References
- Montserrat Volcano Observatory, n.d. Web. Jan 27, 2010
- Washington Volcanic Ash Advisory Center, Volcanic Ash Advisory 2009/063 1623 UTC 16 Nov
- Avilla, L.A. and J. Cangialosi, 2010. Tropical Cyclone Report: Hurricane Ida. National Hurricane Center. http://www.nhc.noaa.gov/pdf/TCR-AL112009_Ida.pdf
- Wave Information Studies, USACE Coastal & Hydraulics Laboratory, 1998 Web. http://frf.usace.army.mil/cgi-bin/wis/atl/atl_main.html
Northeastern Pacific Ocean to 30N and east of 140W
All of the eastern North Pacific non-tropical warning events observed from 15 September 2009 to 1 January 2010 found between 30N and the equator east of 140W were in the Gulf of Tehuantepec, driven by mid-latitude cold frontal passages through the narrow Isthmus of Tehuantepec. There were eight occurrences of gale force winds, with three of those events producing winds of storm force. These events are cataloged in Table 2.
| Onset | Region | Peak Wind Speed | Gale / Storm Duration |
|---|---|---|---|
| 0000 UTC 18 Oct | Tehuantepec | 50 KT | 66 hr / 12 hr |
| 0600 UTC 1 Nov | Tehuantepec | 45 KT | 144 hr |
| 1200 UTC 10 Nov | Tehuantepec | 55 KT | 72 hr / 18 hr |
| 1200 UTC 17 Nov | Tehuantepec | 35 KT | 30 hr |
| 0000 UTC 26 Nov | Tehuantepec | 55 KT | 66 hr / 24 hr |
| 1200 UTC 05 Dec | Tehuantepec | 35 KT | 24 hr |
| 0000 UTC 17 Dec | Tehuantepec | 40 KT | 42 hr |
| 0000 UTC 29 Dec | Tehuantepec | 35 KT | 18 hr |
The first non-tropical warning event of the period coincidentally occurred shortly after the passage of Hurricane Rick south of the Gulf of Tehuantepec. Pacific Figure 1 below shows the QuikSCAT imagery from 1234 UTC on 18 Oct 2009. Winds in the 30 to 40 KT range were observed in the Gulf of Tehuantepec by this pass while the wind field from Hurricane Rick is evident on the western edge of the image. Winds reached storm force in Tehuantepec by 1800 UCT 18 Oct, but the storm force winds only lasted 12 hours. At 0900 UTC on 19 Oct, the Celebrity Infinity (9HJD9) reported 45 KT north winds just south of the Gulf of Tehuantepec near 14.8N94.5W. Winds in the region gradually tapered off through 1800 UTC on 20 Oct when the gale warning ended.
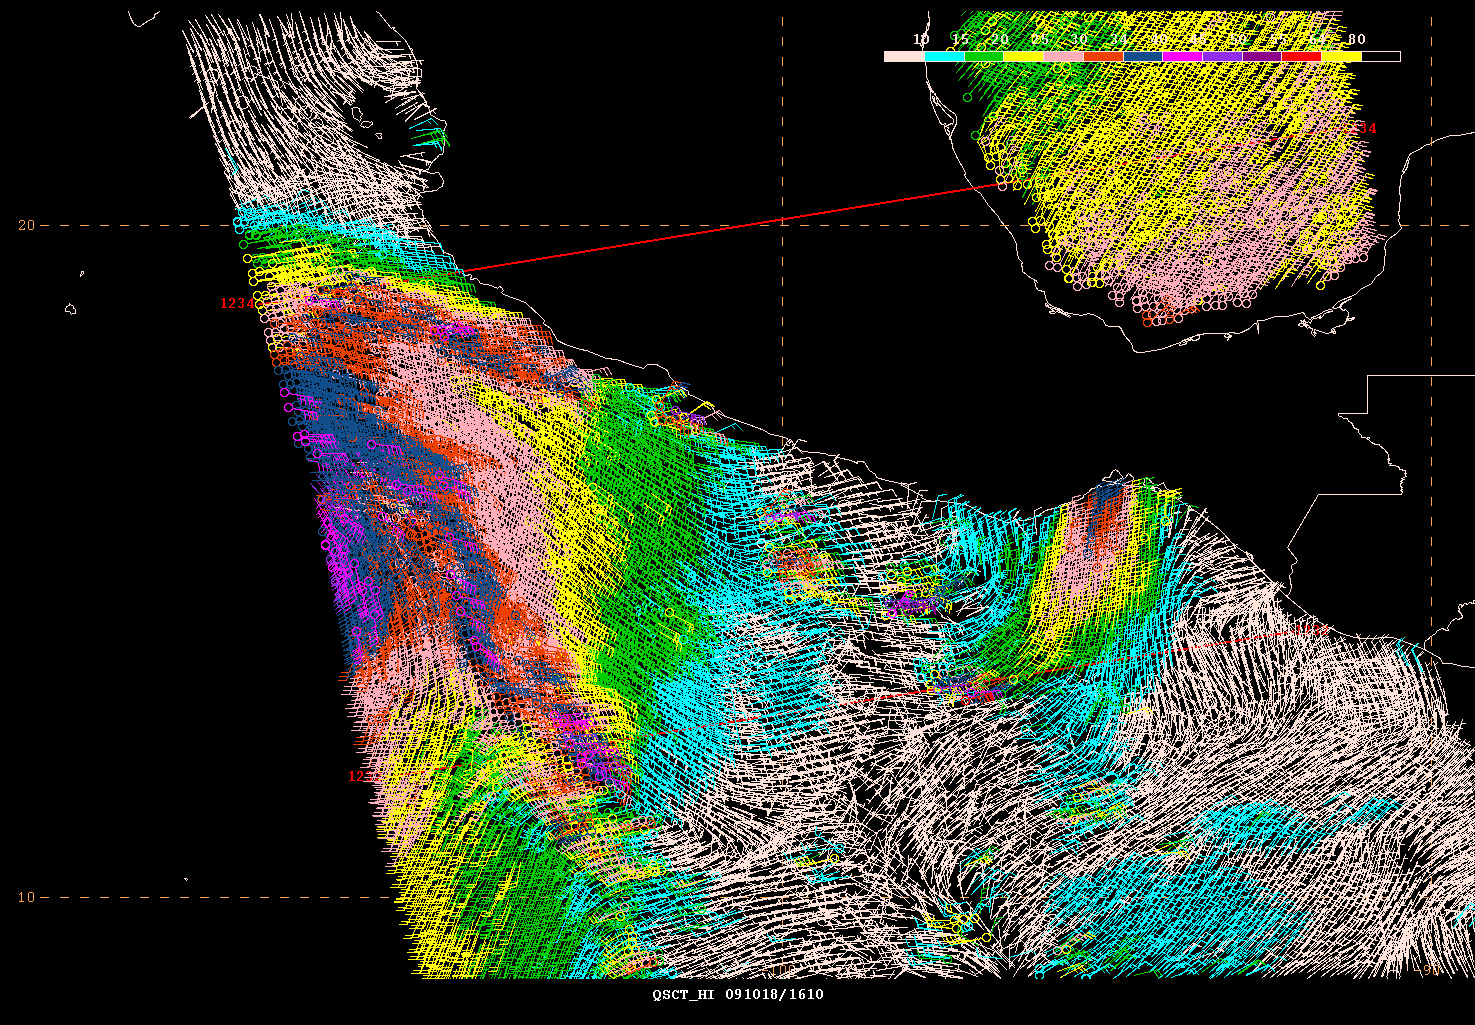
Pacific Figure 1 Ocean vector wind retrievals from the QuikSCAT satellite on 1234 UTC 18 Oct 2009. Note the gale force winds in the Gulf of Tehuantepec and the eastern side of Hurricane Rick on the western edge of the swath.
The longest non-tropical warning period in the eastern North Pacific began at 0600 UTC 1 Nov and lasted six days (see Atlantic section for further discussion). While this gale period began with the passage of a cold front through the Isthmus of Tehuantepec, it lasted longer than average due to a persistent strong pressure gradient between slow moving high pressure north of the front and unusually strong low pressure south of the Gulf of Tehuantepec. This low pressure was caused by a large, low-level cyclonic gyre across Central America that eventually assisted in the development of Hurricane Ida in the Caribbean Sea (Avila and Cangialosi, 2010). Pacific Figure 2 shows an example of this persistent surface pattern at 0000 UTC 05 Nov. Ship observations from the Coral Princess (ZCDF4), the Statendam (PHSG), the Maersk Damietta (A8OU4), the Veendam (PHEO), and the APL Spinel (9VVK) were vital for monitoring the event. Winds did not reach storm force during this warning period.
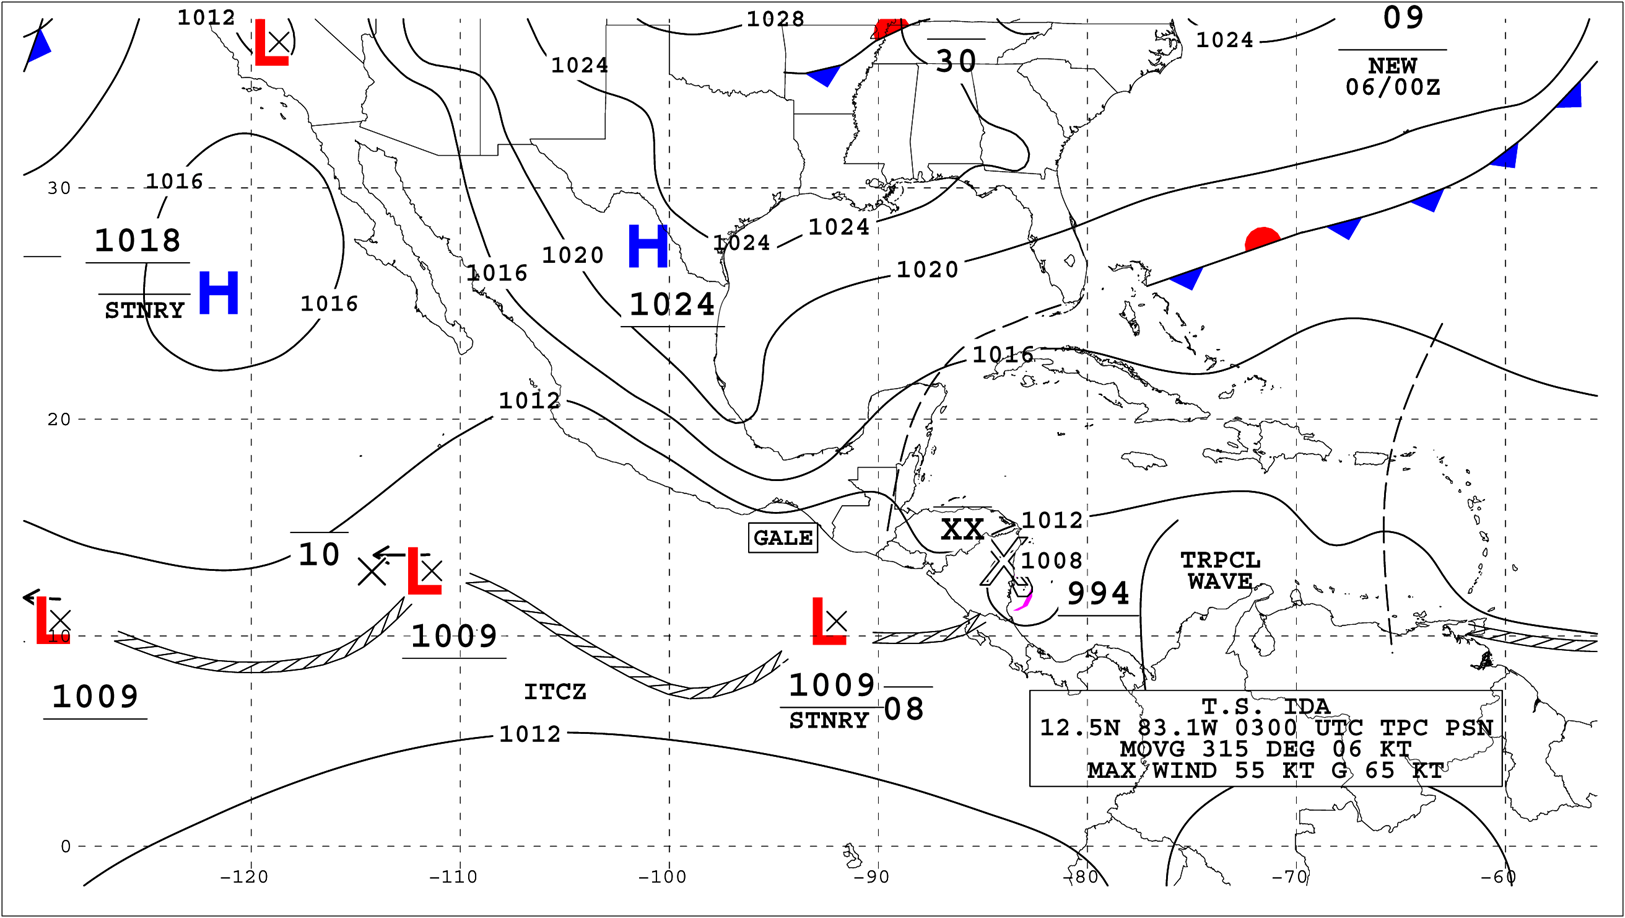
Pacific Figure 2 The National Weather Service Unified Surface Analysis from 0000 UTC 5 Nov 2009. Note the gradient between high pressure to the north of the Gulf of Tehuantepec and low pressure to the south.
The second gap wind event to reach storm-force intensity began 10 Nov and lasted three days. The initial gale event rapidly rose to above 45 KT as evidenced by the ship Leverkusen Express (DEHY). That ship reported 46 KT winds near 14.1N95.6W on 10 Nov at 1200 UTC. The QuikSCAT passes from 1208 UTC on 11 Nov and 0038 UTC on 12 Nov displayed in Pacific Figure 3 captured the period of storm force winds.
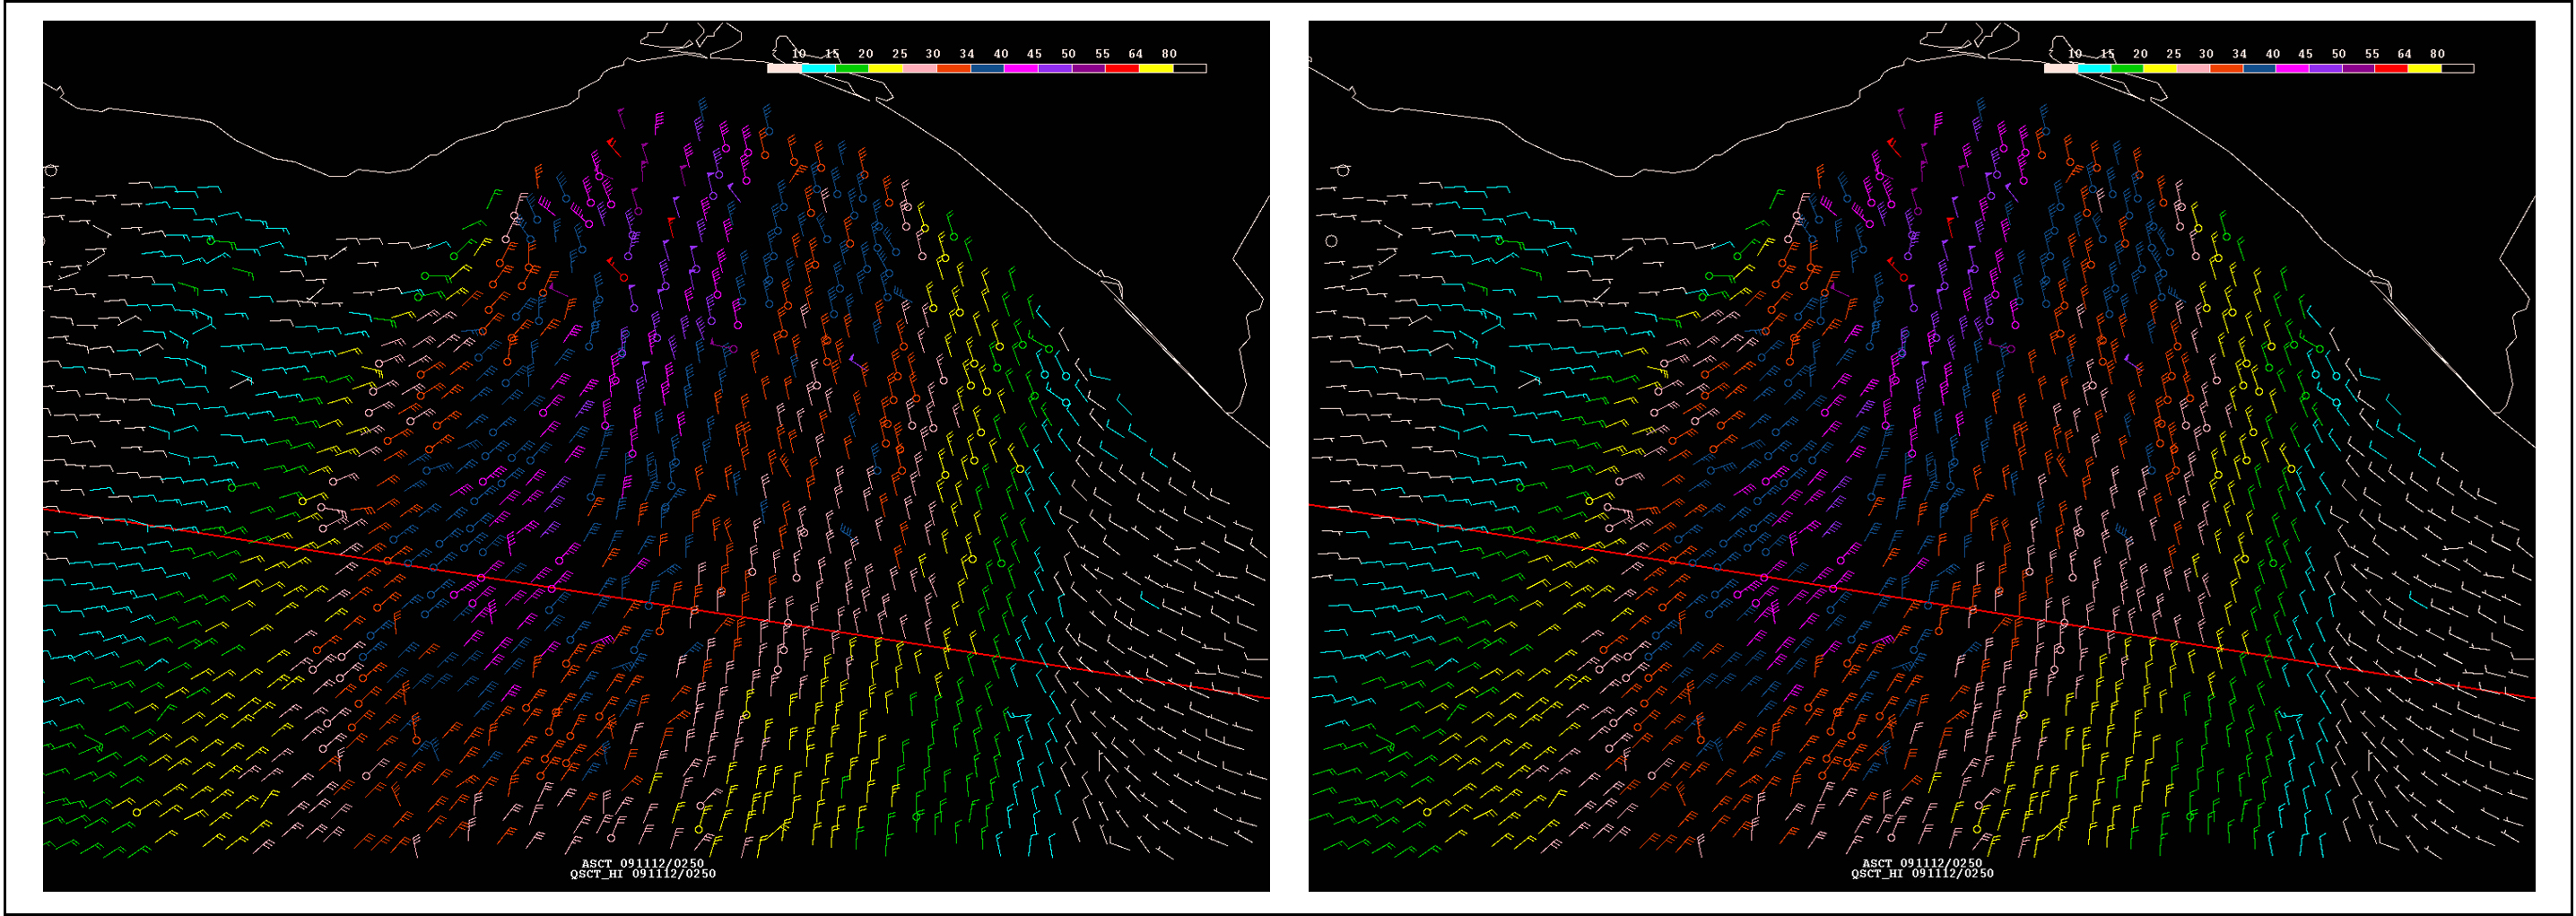
Pacific Figure 3 QuikSCAT passes from 11 Nov 2009 at 1208 UTC (left) and from 12 Nov 2009 at 0038 UTC (right). These passes captured a period of storm force winds in the Gulf of Tehuantepec.
The final storm-force event in the Gulf of Tehuantepec in 2009 began at 0000 UTC on 26 Nov. Three different observing ships, the Ludwigshafen Express (DILE), the Star Princess (ZCDD6), and the Celebrity Infinity (9HJD9), all reported winds of storm force. This was the first gap wind event in the Gulf of Tehuantepec of the post-QuikSCAT era, and the observations made by these ships were crucial for assessing the current conditions and evaluating the computer model output used by forecasters.
The generally progressive weather pattern seen during December 2009 over Mexico and the Gulf of Mexico did not lend itself to any long-lived gap wind events in the Gulf of Tehuantepec. There were only three gale warning periods, none of which exceed gale force or lasted for more than 42 hours.
The generally progressive weather pattern seen during December 2009 over Mexico and the Gulf of Mexico did not lend itself to any long-lived gap wind events in the Gulf of Tehuantepec. There were only three gale warning periods, none of which exceed gale force or lasted for more than 42 hours.
A potent winter storm in the central North Pacific brought a long period northwest swell train into forecast waters beginning 8 Dec. Seas of (6 m) 20 ft with 18-20 second periods moved into the northwest portion of the Tropical Analysis and Forecast Branchs (TAFB) area of responsibility near 30N140W on the morning of 8 Dec. As the swell propagated southeastward, significant wave heights rose above (3 m) 10 ft in much of the forecast area west of 110W for nearly four days. Pacific Figure 4 shows the TAFB significant wave height analysis from 11 Dec at 0000 UTC during the peak coverage of seas in excess of (3 m) 10 ft.
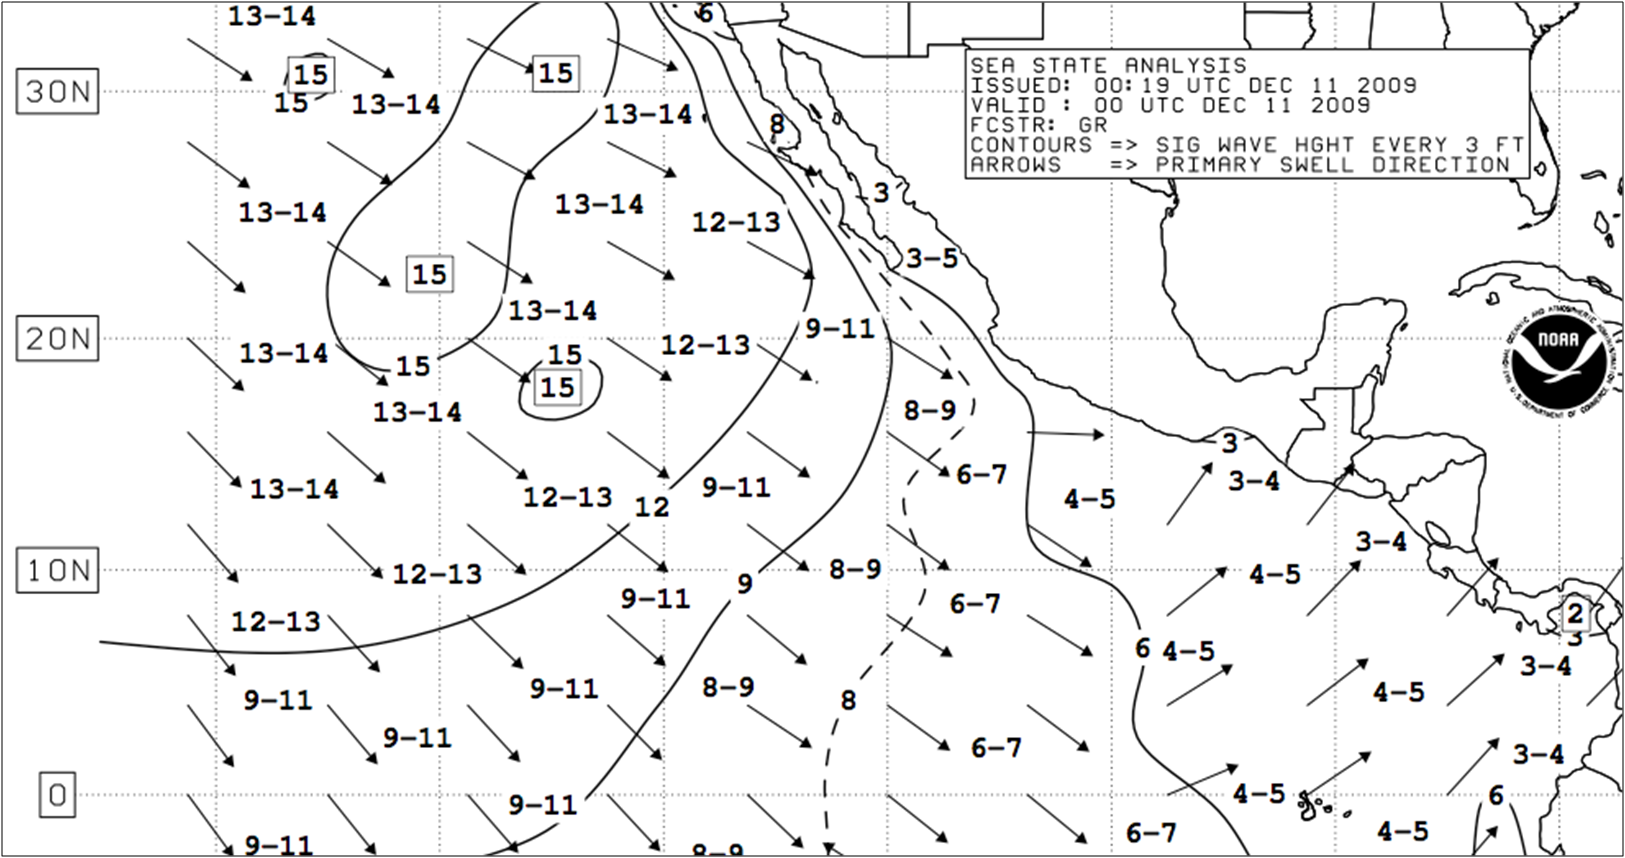
Pacific Figure 4 Analysis of the significant wave heights in the TAFB area of responsibility on 11 Dec 2009 at 0000 UTC. The arrows depict swell direction.
References
Back to top