Marine Weather Review North Pacific Area September to December 2009
By George P. Bancroft
NOAA National Center for Environmental Prediction
Introduction
The weather pattern over the North Pacific became increasingly active as late summer weather gave way to an active fall and early winter pattern, with tropical cyclones contributing to some of the developments of cyclones in the western North Pacific during September and October. One measure of the activity is the number of extratropical lows producing hurricane-force winds. There were three each in September and October, six in November and seven in December. In the past it has been found that December has the greatest frequency of hurricane-force lows in the North Pacific (Reference 4). In contrast the previous September (2008) produced none. Tropical activity contributed to two of the intense cyclones in September 2009 as described below. The main track of low-pressure systems was from the area near Japan northeastward to the Gulf of Alaska with some of the cyclones turning more northward into the Bering Sea. By December high-latitude blocking suppressed activity to the south and when cyclones turned north into the Gulf of Alaska or Bering Sea they were forced to stall or turn west.
Tropical cyclones in the northwestern Pacific were most active in September and October when six appeared on OPCs oceanic radiofacsimile surface analysis charts, including three super typhoons. November and December featured weak activity with the exception of Super Typhoon Nida in early December. Tropical cyclones Choi-Wan in late September and Lupit in late October re-intensified into intense extratropical lows. Overall this period was more active in terms of numbers and strength of tropical systems than the same period a year earlier.
Tropical Activity
Tropical Storm Dujuan: This cyclone moved northeast into OPCs radiofacsimile chart area 300 nmi south of Japan at 0000 UTC September 6 with maximum sustained winds of 45 KT with gusts to 55 KT (Figure 6). Dujuan then weakened to a depression by 0600 UTC on the 7th before re-intensifying to a tropical storm near 34N 149E at 0000 UTC on the 9th with maximum sustained winds of 55 KT with gusts to 70 KT. The Maersk Diadema (DDAL2) reported south winds of 35 KT near 25N 141E at 1800 UTC on the 6th. By 1800 UTC on the 9th Dujuan merged with a front and became an extratropical storm-force low with a 982-hPa central pressure near 40N 159E at 0000 UTC September 10. The cyclone then moved into the Bering Sea and weakened to a gale early on the 11th before turning southeast into the northeastern Pacific on the 14th where it was absorbed by a larger Gulf of Alaska gale.
Super Typhoon Choi-Wan: Tropical Storm Choi-Wan moved northwest to near 16N 151E at 1800 UTC September 12 with maximum sustained winds of 35 KT with gusts to 45 KT. While drifting northwest Choi-Wan rapidly intensified to a minimal typhoon twenty-four hours later and to a super typhoon by 0600 UTC September 15, near 18N 146E with maximum sustained winds of 130 KT with gusts to 160 KT. Twelve hours later Choi-Wan reached maximum intensity near 18N 144E with maximum sustained winds 140 KT with gusts to 170 KT, or Category 5 (highest) on the Saffir-Simpson scale (Reference 5). The cyclone then turned to the north on the 16th and began to weaken. By 0000 UTC on the 20th Choi-Wan was a strong tropical storm near 34N 147W undergoing extratropical transition as it approached a front (Figure 1). What actually happened was that twelve hours later Choi-Wan re-intensified into an extratropical hurricane-force low near 36N 152E and after another twelve hours the cyclone became absorbed into a rapidly intensifying low to the north, near 44N 158E in the first part of Figure 1. Figure 2 is a high-resolution QuikSCAT image of Choi-Wan shortly after becoming extratropical with winds as high as 75 KT appearing in the west semicircle of the cyclone. In the second part of Figure 1 the two cyclones have consolidated into an intense 962-hPa hurricane-force low. At 1100 UTC on the 19th the APL China (WDB3161) reported northeast winds of 45 KT near 34N 138E. Seven hours later the APL England (9VDD2) encountered south winds of 45 KT. At 0600 UTC on the 20th the APL China (31N 142E) reported north winds of 35 KT and 7.5-meter seas (24 feet) followed five hours later by a report of 13.5-meter seas (44 feet). To the north the Salvia Ace (ZCXR) near 47N 156E reported northeast winds of 45 KT and 6.7meter seas (22 feet). The cyclone subsequently tracked east south of the Aleutians and weakened to a gale and then turned northeast through the Gulf of Alaska followed by weakening inland over Alaska.
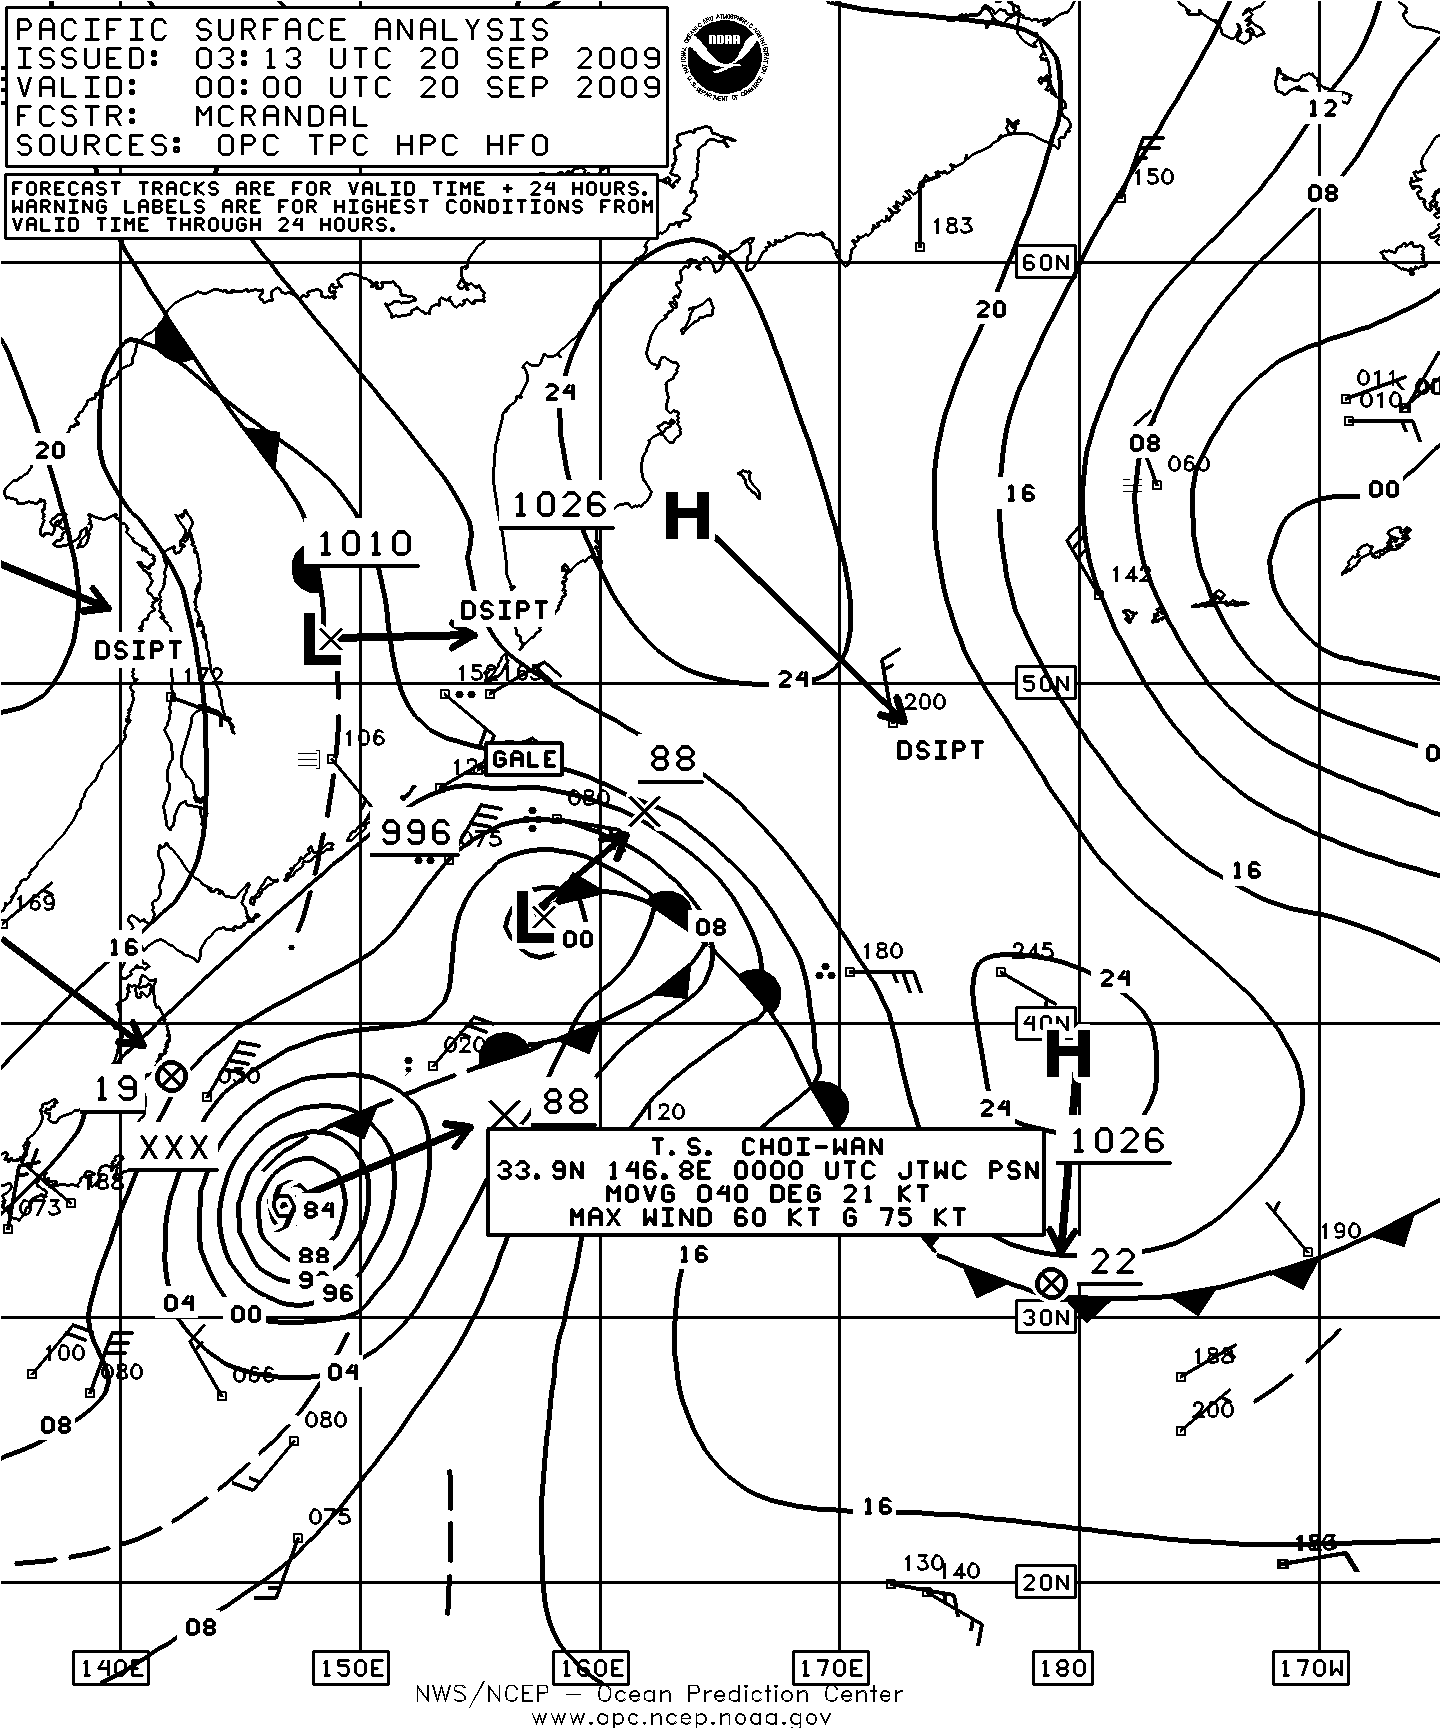
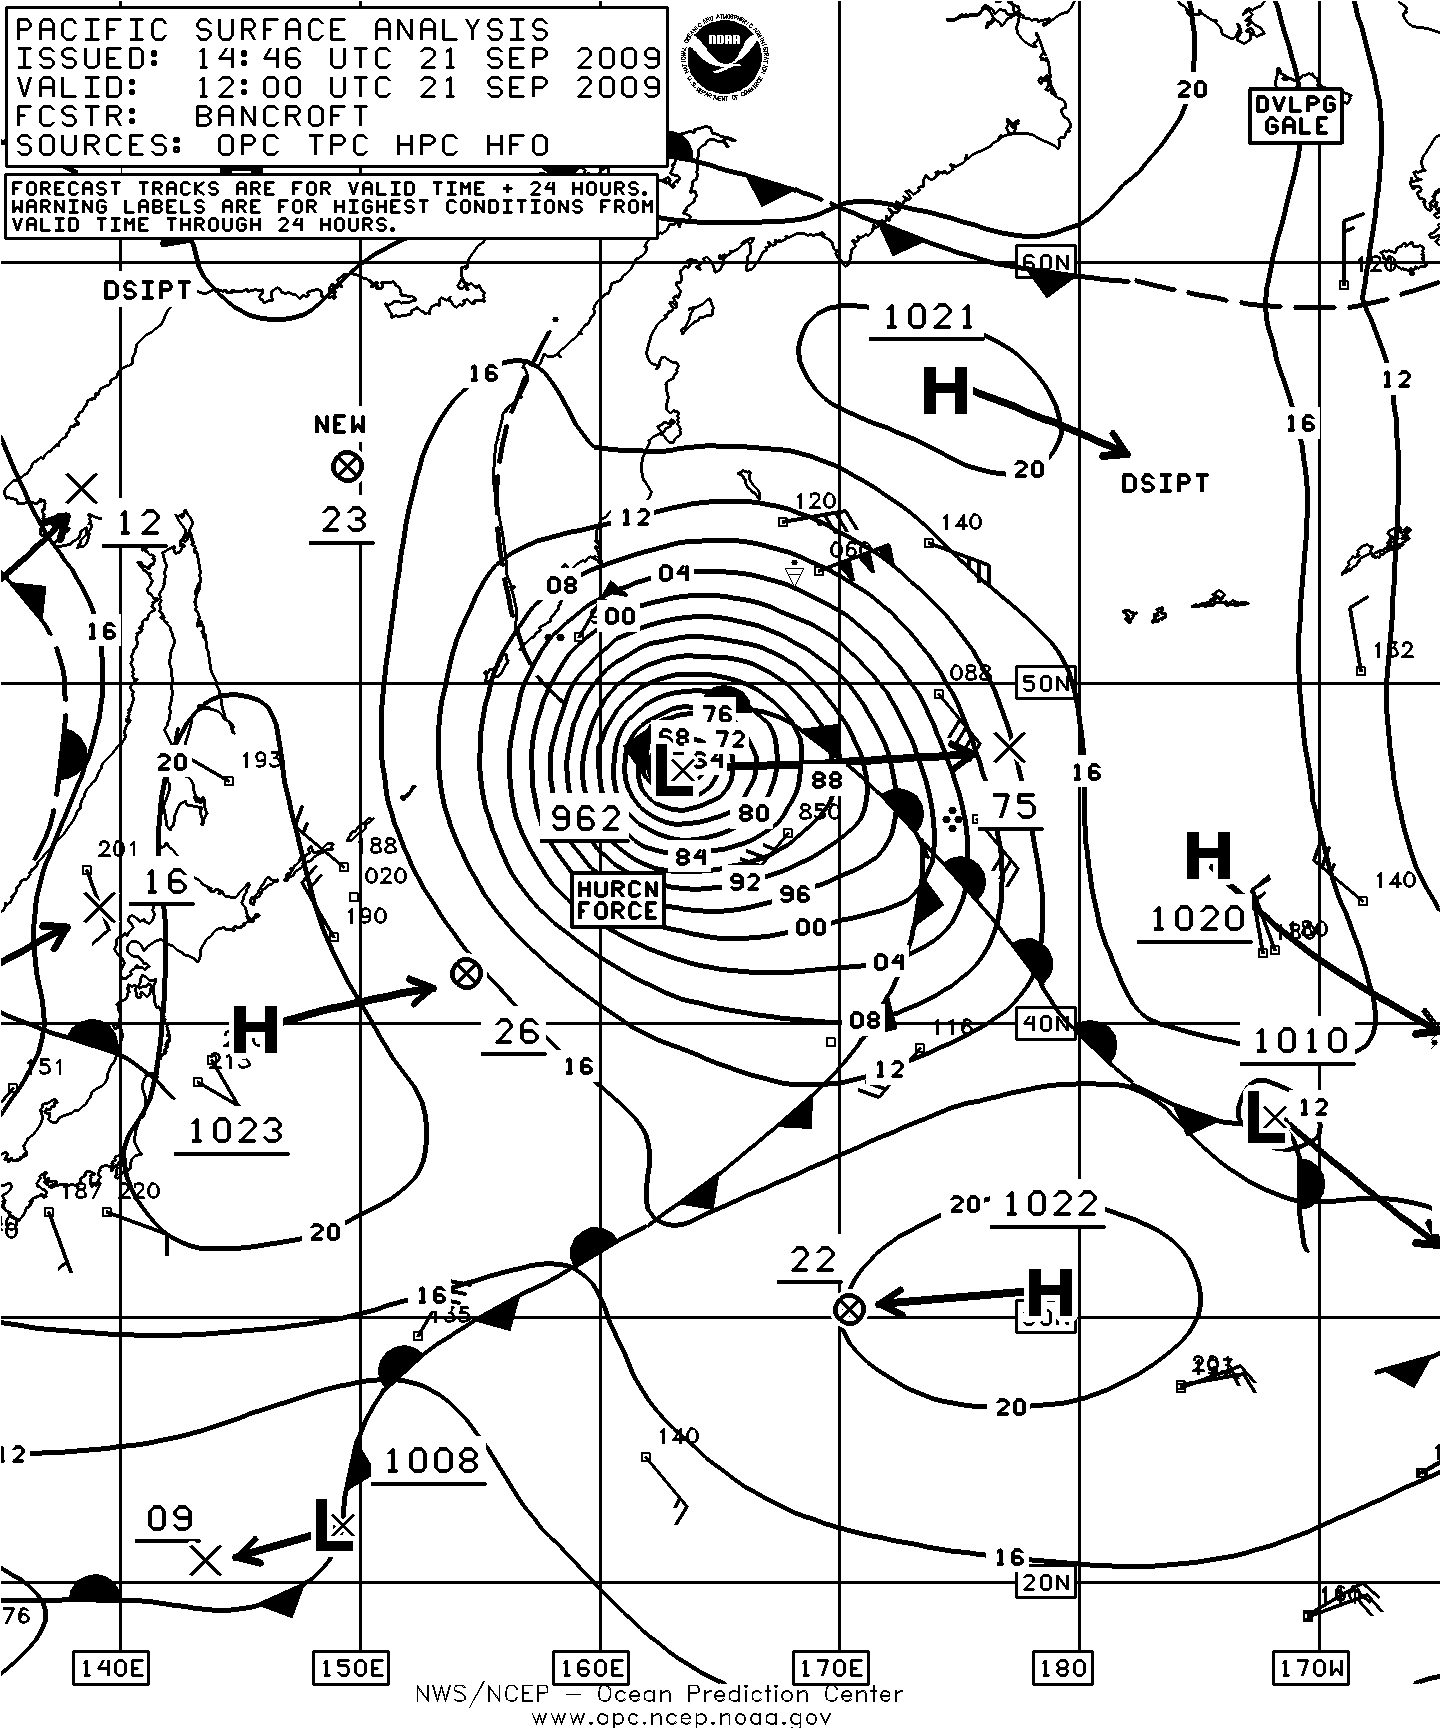
Figure 1. OPC North Pacific Surface Analysis charts (Part 2 - west) valid 0000 UTC September 20 and 1200 UTC September 21, 2009. Twenty-four hour forecast tracks are shown with the forecast central pressures given as the last two whole digits in millibars.
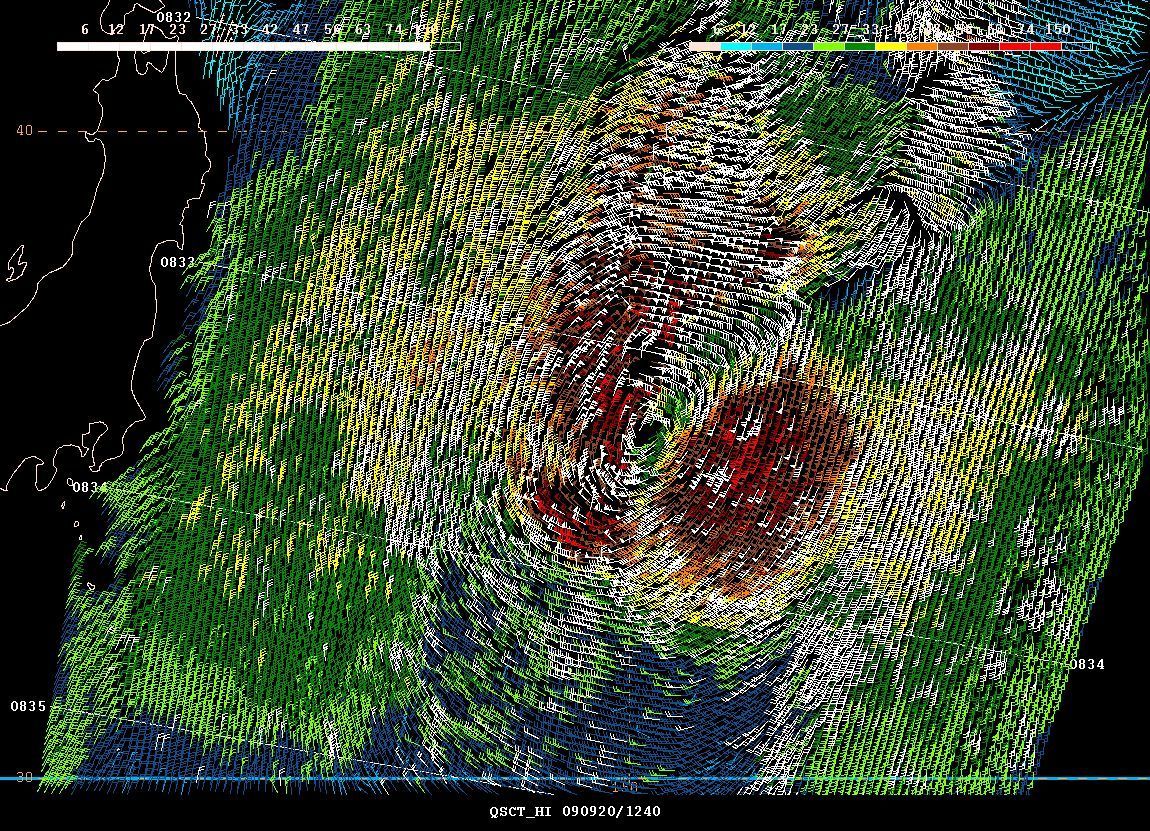
Figure 2. High-resolution QuikSCAT scatterometer image of satellite-sensed winds around an extratropical hurricane-force low, former tropical cyclone Choi-Wan (Figure 1). The resolution is 12.5 km, versus 25 km in the coarser-resolution version of QuikSCAT imagery. The valid time of the pass is approximately 0833 UTC September 20, 2009, or about eight and one-half hours later than the valid time of the first part of Figure 1 when the Joint Typhoon Warning Center last classified this cyclone as tropical. The center of the cyclone appears near the center of the image at 35N 150E. This version of the imagery, adapted for OPC operational use, included numbered cross-track time lines of the satellite.
Super Typhoon Melor: Typhoon Melor moved northwest into OPCs radiofacsimile chart area near 16N 147E at 0600 UTC October 3 with maximum sustained winds of 115 KT with gusts to 140 KT. At 0000 UTC on the 4th Melor attained maximum intensity as a super typhoon near 17N 142E with maximum sustained winds of 145 KT with gusts to 175 KT. Gradual weakening followed as Melor moved west of the area before turning northeast to near 36N 138E as a tropical storm 0000 UTC October 8 with maximum sustained winds of 55 KT with gusts to 70 KT. Six hours later Melor became extratropical and attained peak intensity as an extratropical storm near 44N 153E with a 976 hPa central pressure at 1200 UTC on the 9th. Weakening followed, with the cyclone dissipating south of the Aleutians near the dateline late on the 10th.
Tropical Storm Nepartak: Nepartak began as a tropical depression (21W) near 17N 143W at 1200 UTC October 8 drifting north with maximum sustained winds of 25 KT with gusts to 35 KT. It became Tropical Storm Nepartak at 0600 UTC on the 10th, a minimal tropical storm near 22N 142E and then thirty-six hours attained maximum intensity near 23N 144E with maximum sustained winds of 55 KT with gusts to 70 KT. Nepartak then weakened and turned toward the northeast, becoming extratropical at 1200 UTC on the 13th near 32N 155E. After briefly intensifying to a storm-force low late on the 13th extratropical Nepartak then tracked east near 43N and dissipated near the northern California coast on the 19th.
Super Typhoon Lupit: Super Typhoon Lupit moved northeast and approached OPCs oceanic chart area near 18N 135E at maximum intensity at 1800 UTC October 18 with maximum sustained winds of 135 KT with gusts to 165 KT before turning northwest away from the area and beginning a weakening trend. Later Lupit returned, accelerating northeast near 29N 136E at 0600 UTC on the 26th as a strong tropical storm (Figure 3) approaching a frontal zone and the 998-hPa storm to the north. The two merged as a rapidly deepening extratropical cyclone twelve hours later and developed hurricane-force winds later that day. Figure 4 is an infrared satellite image of Lupit undergoing extratropical transition south of Japan. It is developing a more asymmetric cloud pattern found in an extratropical low with developing frontal features while still showing a partial eye-like structure with some convection near 31N 139E. The central pressure of the extratropical storm (998 hPa) north of Lupit in the first part of Figure 3 fell 32 hPa in the following twenty-four hour period as it absorbed Lupit. The second part of Figure 3 shows the combined system near maximum intensity. The center attained a lowest central pressure of 952 hPa six hours later. The high-resolution QuikSCAT image in Figure 5 reveals storm force or greater winds almost surrounding the center and there appear to be some 80-KT wind retrievals. Some ship and buoy observations taken during passage of Lupit before and after extratropical transition are listed in Table 1. Hurricane-force winds in this event lasted from 0000 UTC on the 27th to 1800 UTC on the 28th, almost two days. The cyclone subsequently moved northeast toward the western Aleutians then turned north into the western Bering Sea as a weakening gale on the 29th before becoming absorbed by another cyclone passing to the southeast.
| Observation | Position | Date/Time (UTC) | Wind | Seas (m/ft) |
|---|---|---|---|---|
| SHIP | 31N 132E | 26/0000 | N 45 | 5.5/18 |
| SHIP | 37N 142E | 26/1700 | N 50 | |
| Westwood Rainier (C6SI3) | 46N 149E | 27/1800 | NW 45 | |
| HPa Leer (DPBJ) | 52N 160E | 28/0800 | N 50 | 7.3/24 |
| 51N 158E | 28/1600 | NW 55 | ||
| Aida (SBLI) | 51N 159E | 28/1800 | NW 50 | |
| Star Atlantic | 51N 158E | 29/0000 | NW 60 | 3.7/12 |
| SHIP | 57N 172E | 29/0600 | SE 60 | 8.5/28 |
| Buoy 21210 | 38.2N 146.6E | 27/0300 | W 45 | |
| Buoy 46071 | 51.2N 178.9E | 28/1900 | SE 35 | 5.5/18 |
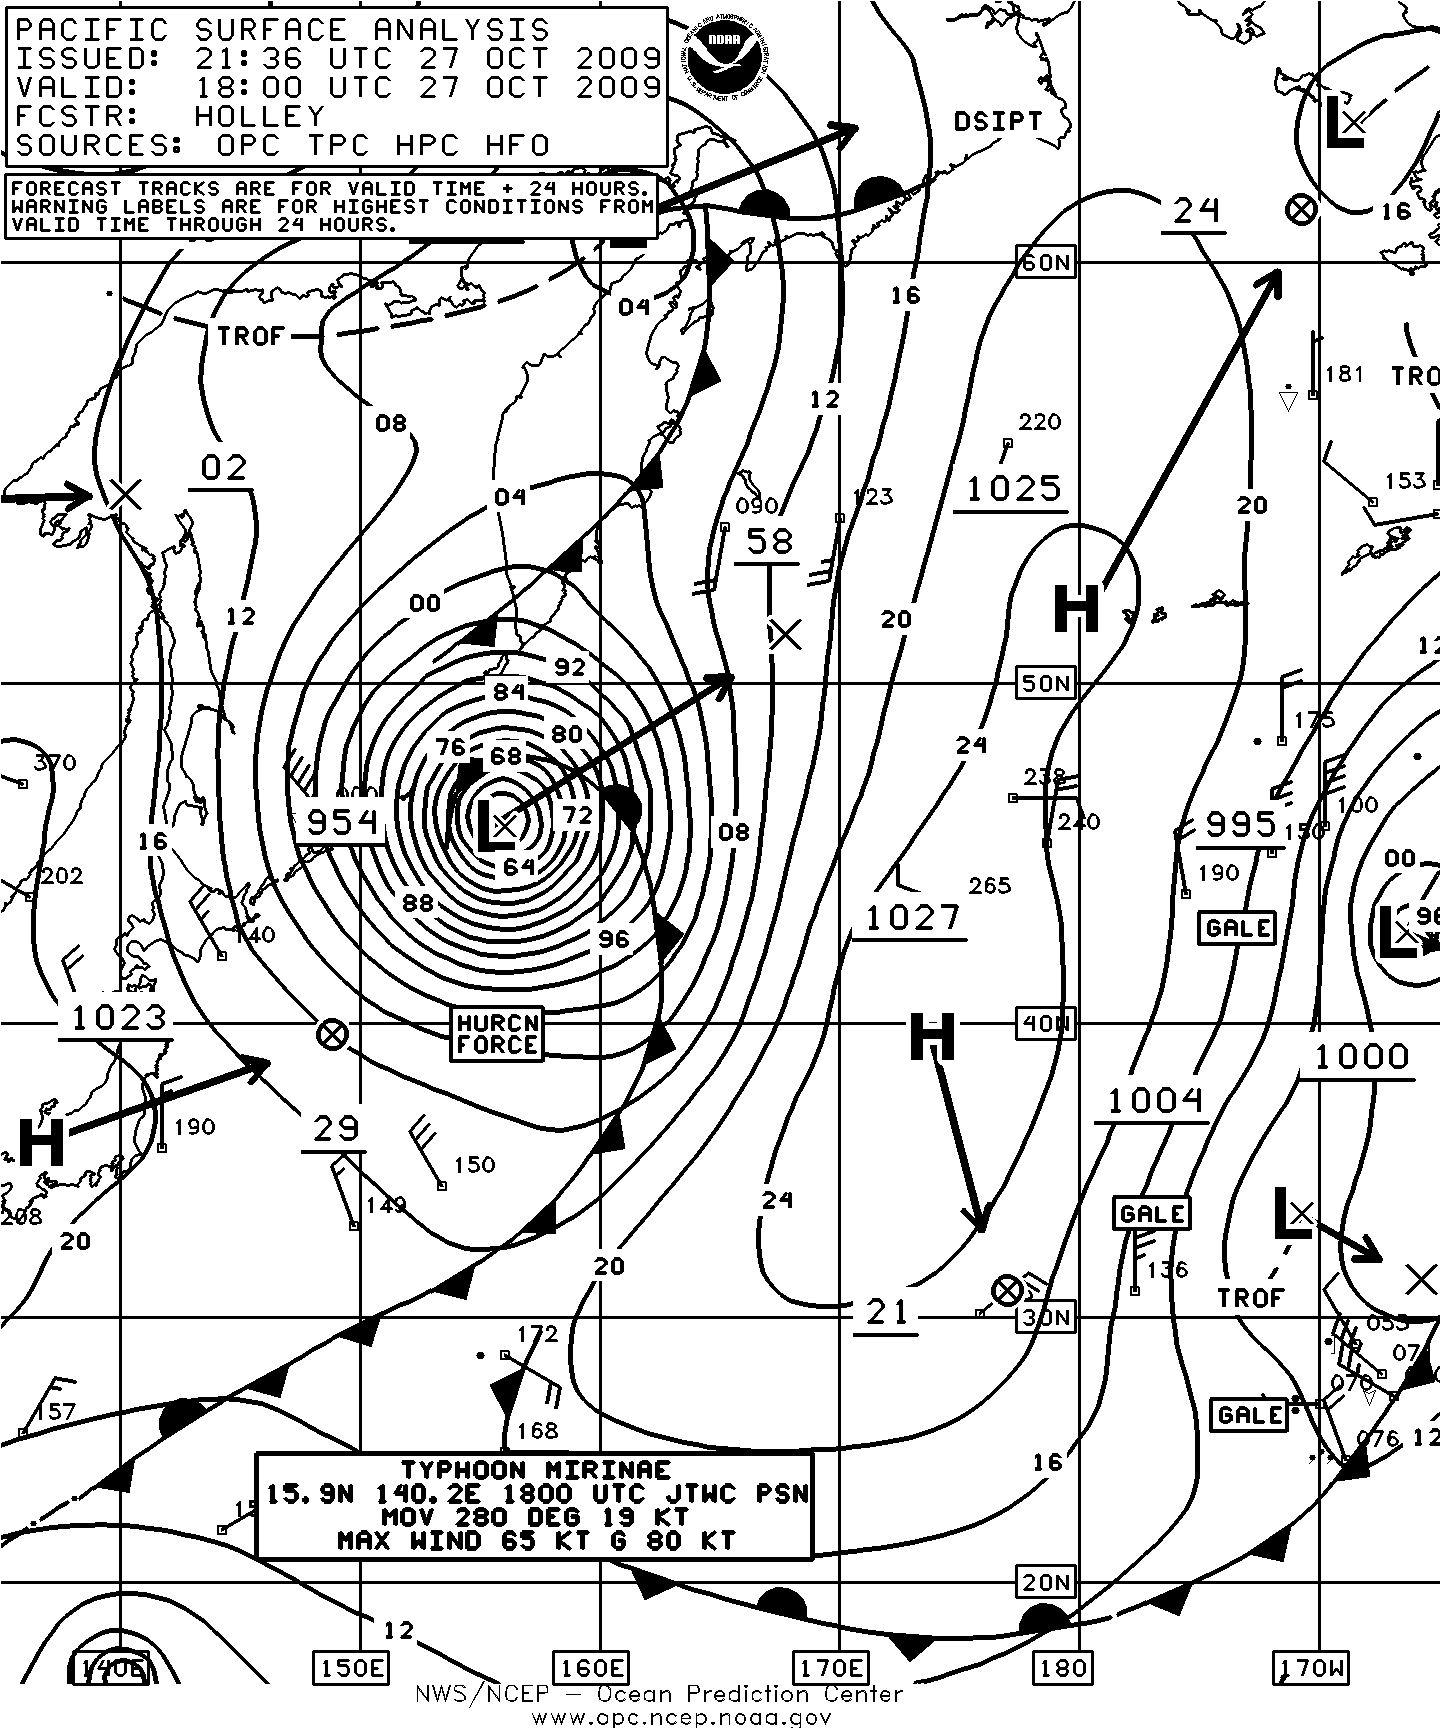
Figure 3. OPC North Pacific Surface Analysis charts (Part 2) valid 0600 UTC October 26 and 1800 UTC October 27, 2009.
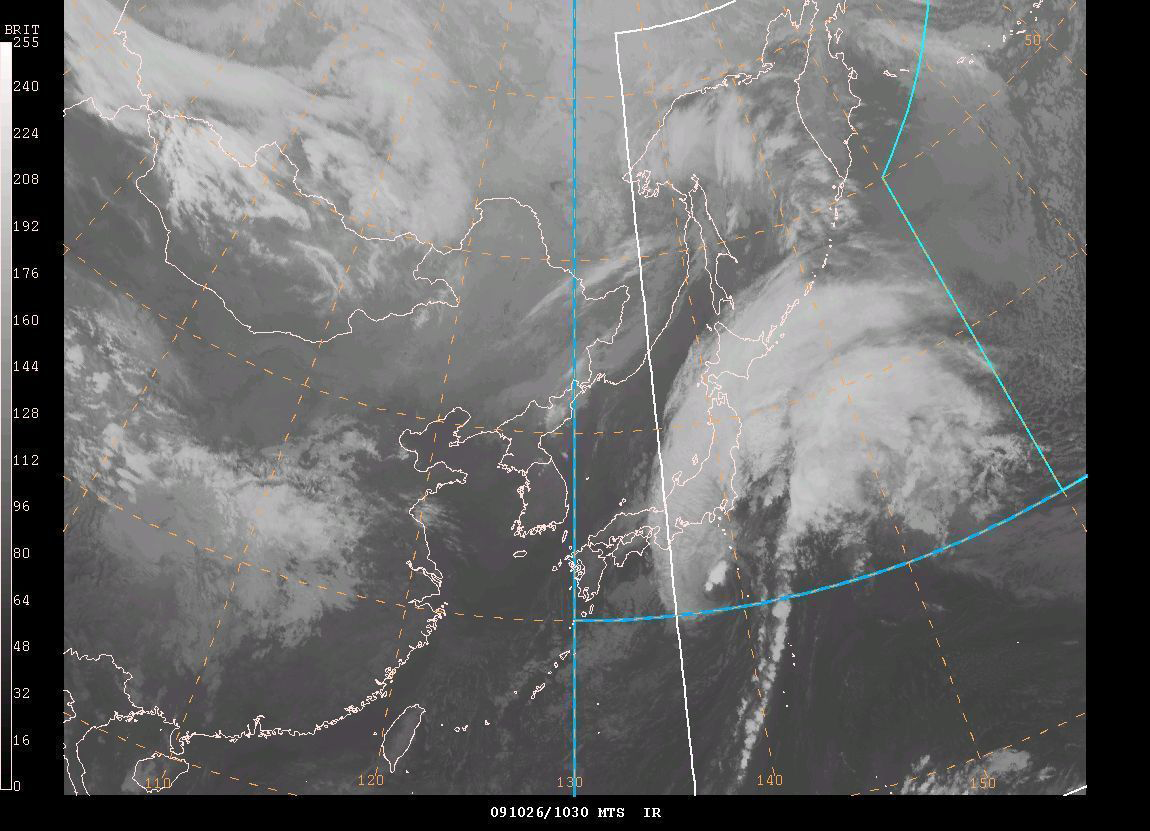
Figure 4. MTS infrared satellite image valid 1030 UTC October 26, 2009. Satellite senses temperature on a gray scale from black (warm) to white (cold) in this type of imagery. The valid time of the image is four and one-half hours later than the valid time of the first part of Figure 3
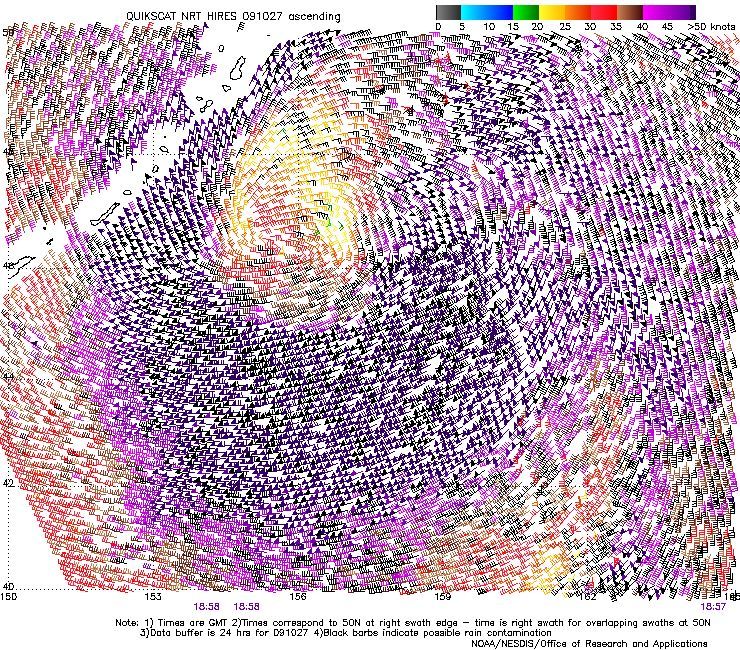
Figure 5. High-resolution QuikSCAT scatterometer image of satellite-sensed winds around the hurricane-force low, former Tropical Cyclone Lupit, shown in the second part of Figure 3. The valid time of the pass is 1858 UTC October 27, 2009, or about one hour later than the valid time of the second part of Figure 3. The center of the cyclone appears near 46N 156E. Image is courtesy of NOAA/NESDIS/ Office of Research and Applications.
Typhoon Mirinae: Typhoon Mirinae moved into the waters south of Japan near 16N 140E on October 18 and drifted west, with maximum sustained winds of 65 KT with gusts to 80 KT (Figure 3). The typhoon intensified over the next twelve hours, developing maximum sustained winds of 85 KT with gusts to 105 KT as it tracked west of the area.
Tropical Storm 25W: This tropical storm formed near 21N 157E at 1800 UTC November 7 and drifted northeast, with maximum sustained winds of 35 KT with gusts to 45 KT. As it drifted northeast for the next eighteen hours it developed a maximum intensity of 45 KT for sustained winds with gusts to 55 KT, near 22N 160E. Rapid weakening followed, with the cyclone dissipating as a remnant low early on the 9th.
Super Typhoon Nida: Nida was the strongest tropical system of the period, drifting north into the area near 16N 139E early on November 26 with maximum sustained winds of 145 KT with gusts to 175 KT. Earlier, when Nida was near 14N 141E at 1800 UTC on the 25th the maximum sustained winds were 160 KT and gusts were up to 195 KT. The cyclone continued to drift north over the next two days while remaining a super typhoon. Weakening began late on the 28th . By 0000 UTC December 2 Nida was a minimal typhoon near 21N 136E with maximum sustained winds of 65 KT with gusts to 80 KT. The cyclone weakened rapidly to a depression within twenty-four hours and then dissipating as a remnant low south of Japan near 27N late on the 2nd without ever getting picked up by the mid-latitude westerlies.
Other Significant Events
Northwestern Pacific Storm, September 2-4: The month started with a gale-force low, former Tropical Storm Krovanh in late August, passing to the east of northern Japan. After initially weakening, it re-intensified to a storm-force low with the central pressure falling from 1004 hPa on the 1st to 985 hPa by 0000 UTC September 4 with the center passing near 49N 171E. At 0000 UTC September 4 the Sevillia (A8OO9) near 51N 166E reported north winds of 55 KT and 8.5-meter seas (28 feet). The APL China (WDB3161) encountered east winds of 45 KT and 6.0-meter seas (20 feet) near 53N 172E six hours later. The cyclone subsequently weakened to a gale on the 4th while passing just south of the western Aleutians, and then continued to track south of the Aleutians before moving north into the Gulf of Alaska on the 8th and dissipating near Kodiak Island on the 9th.
North Pacific Storm, September 6-11: The nontropical low near 29N 152E in Figure 6 moved north in the next twelve hours and merged with the front to the north and moved off to the northeast and intensified rapidly, becoming the first hurricane-force event of the period as depicted in Figure 6. The circulation, rather compact at first, expanded in size with time as the cyclone intensified. The lowest central pressure was 967 hPa when the cyclone passed near 54N 148W at 1800 UTC on the 10th. Hurricane-force winds lasted fir much of the time from 1200 UTC on the 7th to 0000 UTC on the 10th. The high-resolution QuikSCAT image from 1631 UTC September 9 in Figure 7 reveals storm force and some hurricane force winds in the west semicircle although some of the wind retrievals look contaminated. The cyclone then weakened rapidly in the northern Gulf of Alaska on the 11th with dissipation following on the 12th. Selected ship and buoy observations taken in this storm are listed in Table 2.
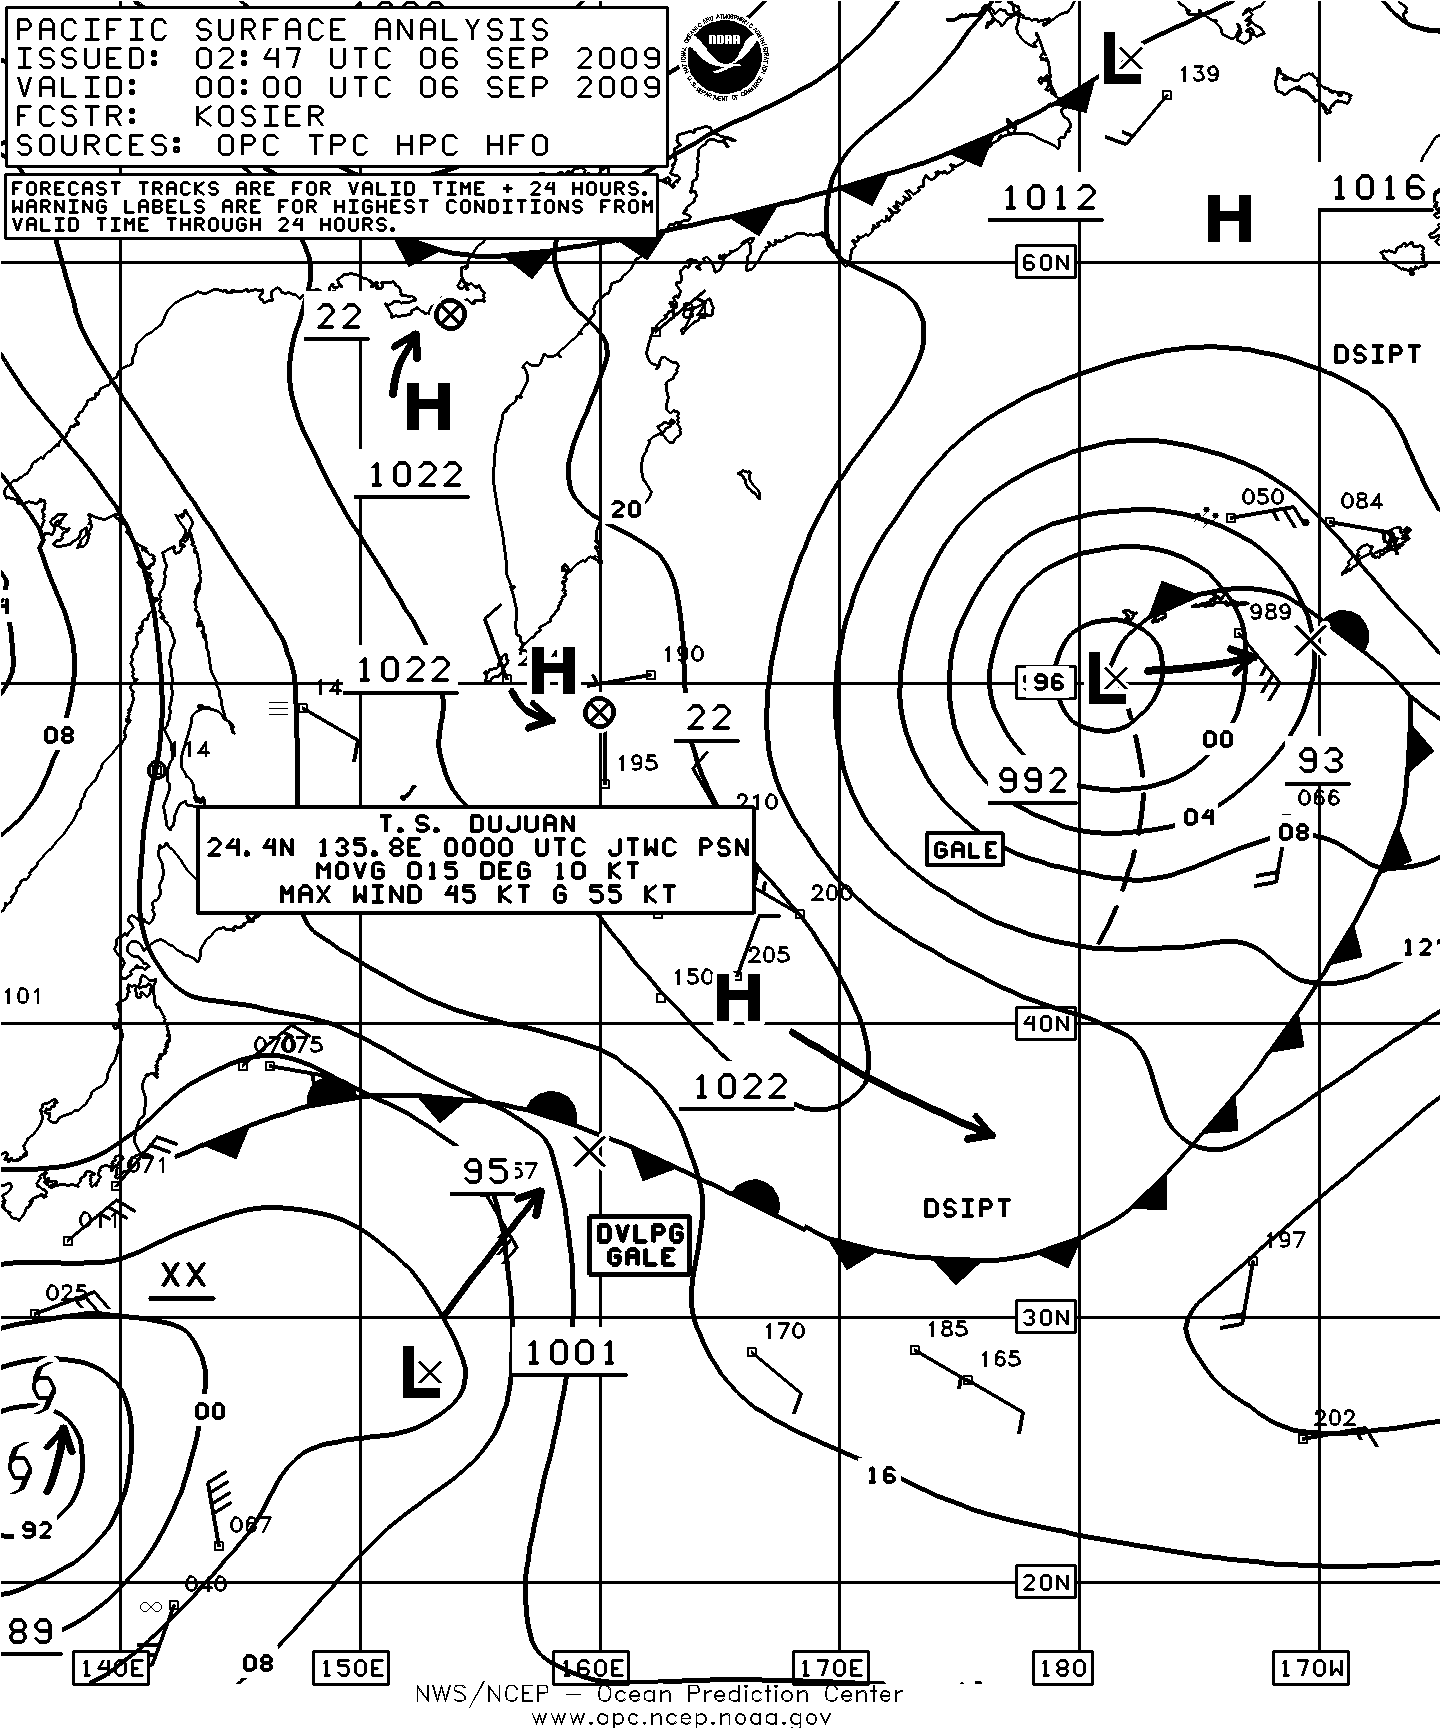
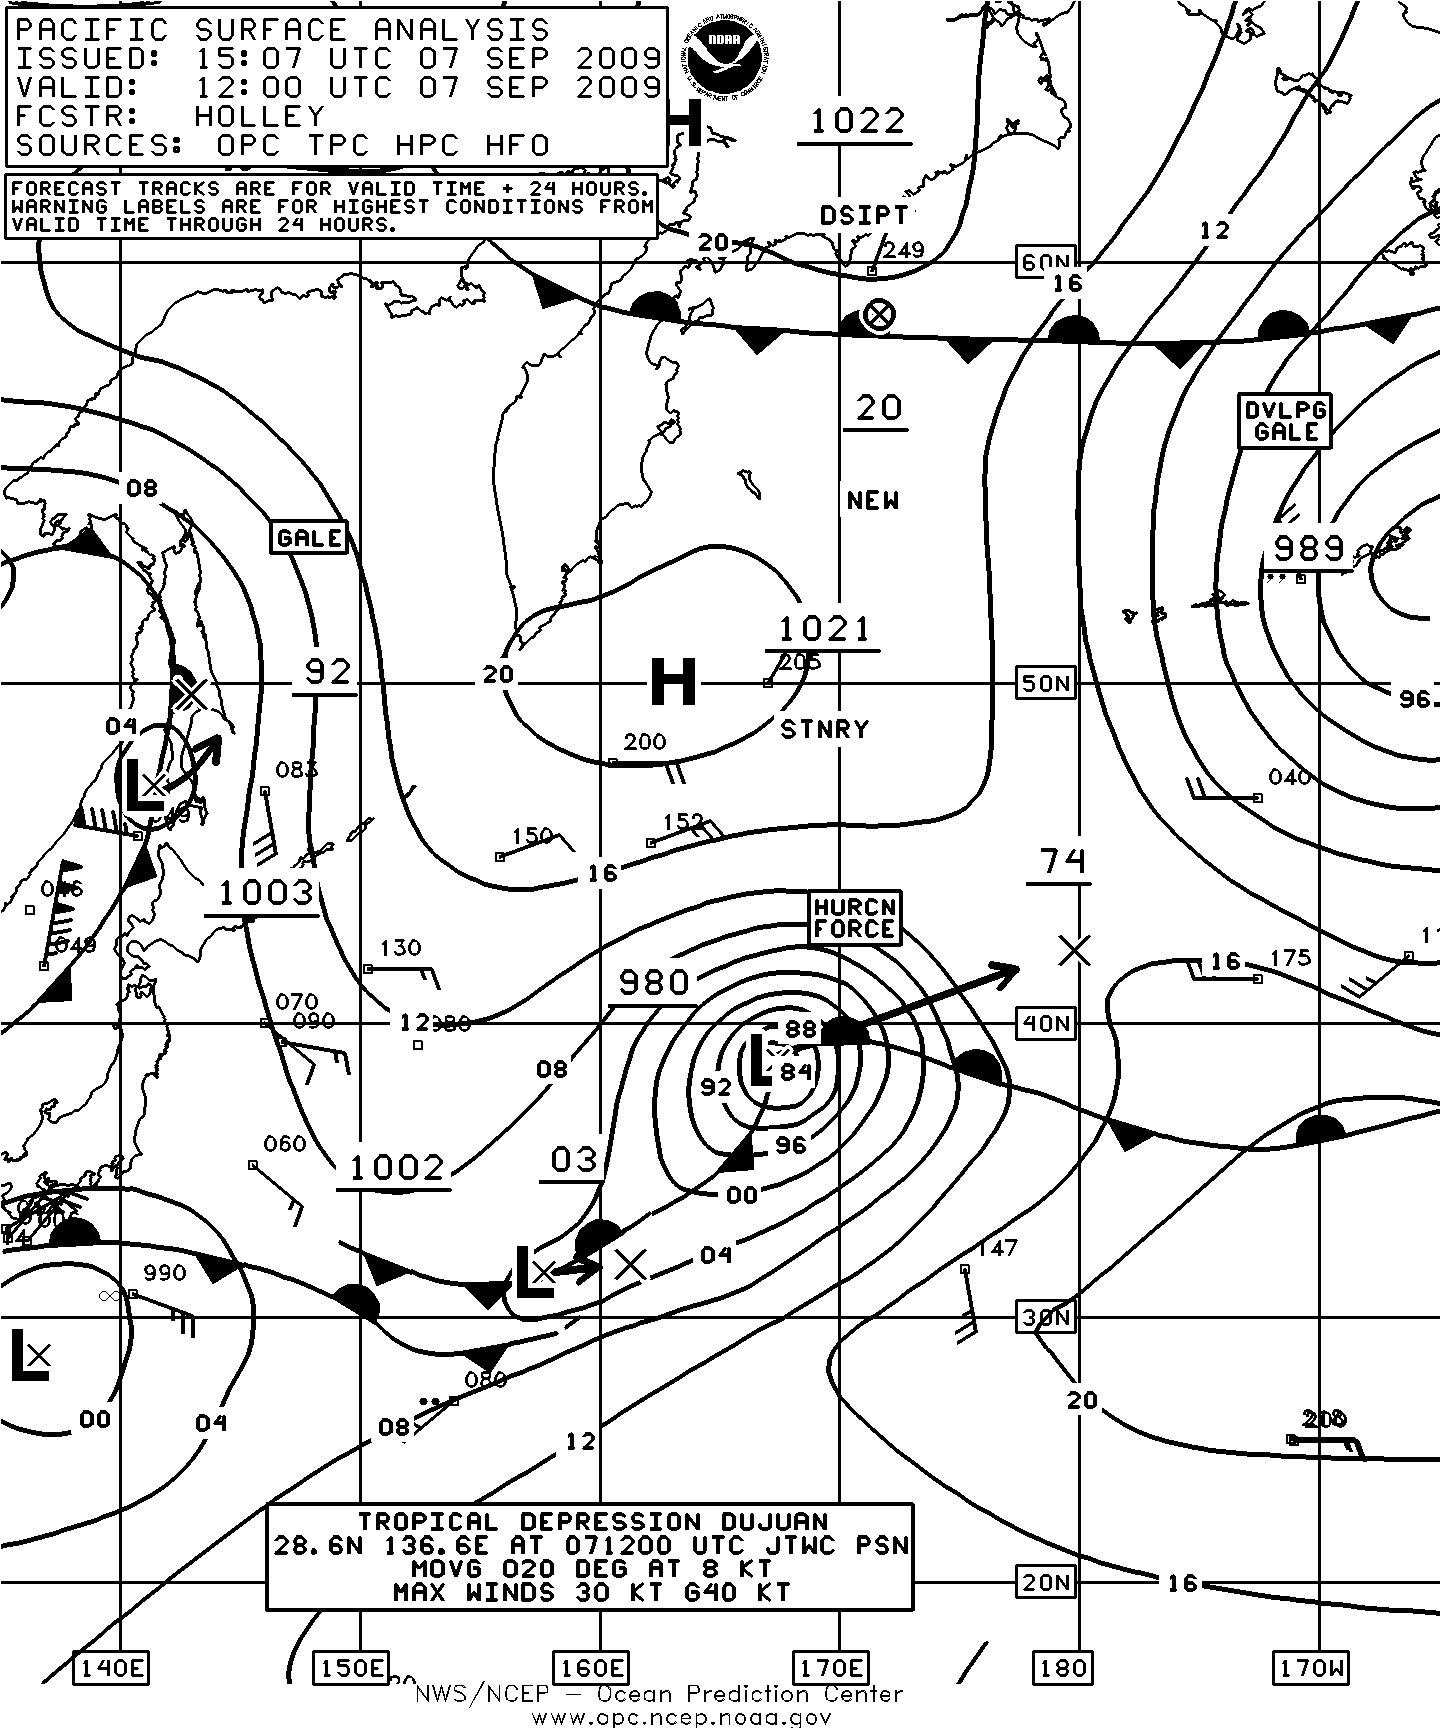
Figure 6. OPC North Pacific Surface Analysis charts (Part 2) valid 0000 UTC September 6 and 1200 UTC September 7, 2009.
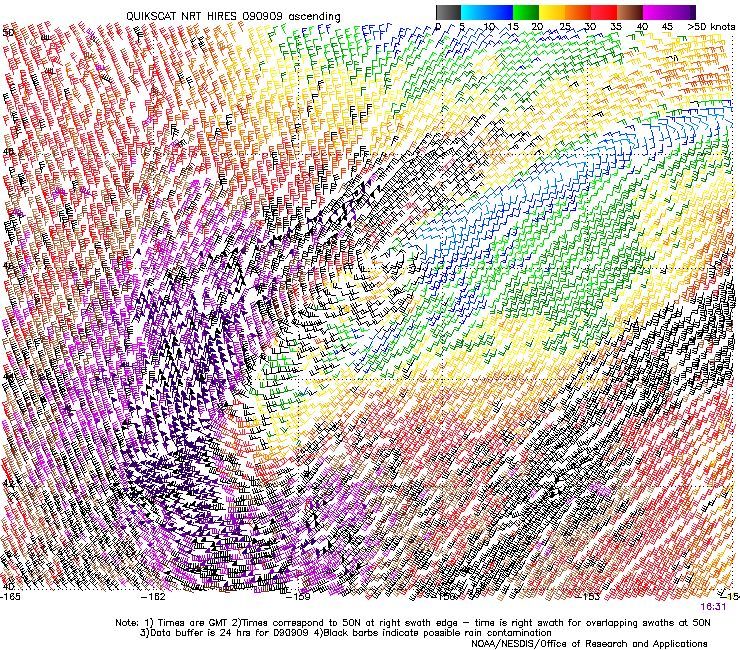
Figure 7. High-resolution QuikSCAT scatterometer image of satellite-sensed winds around the hurricane-force low referred to in the second part of Figure 6 . The valid time of the pass is 1631 UTC September 9, 2009, or more than two days later than the valid time of the second part of Figure 6 as the cyclone moved off to the northeast and increased in size and intensity. The center of the cyclone appears near 46N 157W near the center of the image. Image is courtesy of NOAA/NESDIS/ Office of Research and Applications.
North Pacific Storm, October 8-11: A frontal wave of low pressure just east of Japan formed early on October 6 and tracked east past the dateline over the next two days and then began to turn more northeast and rapidly intensify. The central pressure fell 34 hPa in the twenty-four hour period ending at 0600 UTC on the 9th, when the cyclone briefly developed hurricane-force winds early on the 9th with the low passing near 43N 157W with a 969 hPa central pressure. A QuikSCAT pass available from near that time reveals winds to 70 KT on the south side of the center and is similar to Figure 16 for the November 22-24 storm. The cyclone turned northwest into the Bering Sea early on October 10 where the cyclone developed a lowest central pressure of 962 hPa near 58N 172W at 0000 UTC on the 11th. The system started weakening on the 11th while heading northwest and moved inland over eastern Russia on the 12th. The Capricorn Voyager (C6UZ5) near 36N 171W reported northwest winds of 35 KT and 8.5-meter seas (28 feet) at 0100 UTC on the 9th. The buoy 46066 (52.8N 154.9W) at 0600 UTC on the 10th reported southwest winds of 35 KT and 8.2-meter seas (27 feet) and a maximum of 8.8 meters (29 feet) at 0200 UTC on the 10th
| Observation | Position | Date/Time (UTC) | Wind | Seas (m/ft) |
|---|---|---|---|---|
| United Spirit (ELYB2) | 42N 172W | 08/2000 | SW 50 | 12.8/42 |
| Sofie Maersk | 42N 149W | 09/2100 | SW 45 | 5.0/16 |
| Sierra (WSNB) | 52N 137W | 10/1800 | S 50 | 10.4/34 |
| North Star (KIYI) | 52N 133W | 10/1800 | S 50 | |
| Rainier (Aws) (NWS0011) | 58N 137W | 10/2200 | NE 50 | |
| Buoy 46083 | 58.2N 138W | 10/1700 | SE 41 G54 | 5.0/16 |
| 11/2000 | maximum | 8.5/ 28 | ||
| Buoy 46082 | 59.7N 143.4W | 10/2000 | E 41 G52 | 6.5/21 |
| 10/2100 | Peak gust | 58 | ||
| 11/1900 | maximum | 8.5/28 | ||
| Buoy 46085 | 55.9N 142.6W | 11/0600 | SE 37 G49 | 8.0/27 |
| 11/0700 | S 41 G54 | 8.5/28 | ||
| 11/0900 | maximum | 10.5/35 |
North Pacific Storm of October 17-21: The development of this cyclone is shown in Figure 8. The track of this system originated just southeast of Japan and followed close to the track of the preceding cyclone and the central pressure was about 10 hPa deeper with the center in the northeastern Pacific waters. The central pressure fell 32 hPa in the twenty-four hour period ending at 1800 UTC on the 19th. The second part of Figure 8 shows the cyclone at maximum intensity with a 953-hPa central pressure. The high-resolution scatterometer pass in Figure 9 reveals a tight and well-defined circulation with storm-force winds surrounding the center and indication of wind retrievals as high as 65 KT on the south side. OPC analyzed this system as a hurricane-force low for the twenty-four hour period beginning from 0000 UTC on the 20th. The subsequent track of this cyclone was to the east of the previous system, into the central Gulf of Alaska with a weakening trend by the 21st followed by a northwestward turn. The weakening low was then absorbed by a large gale to the southwest early on October 22. The ship 3FGC9 (38N 161W) reported southeast winds of 45 KT and 7.6-meter seas (25 feet) at 1800 UTC October 18. At 0000 UTC on the 20th the Green Point (WCY4148) near 40N 163W reported northwest winds 45 KT and 7.0-meter seas (23 feet), followed six hours later by a report west winds 35 KT and 7.9-meter seas (26 feet). The APL Thailand (WCX8882) encountered southeast winds of 35 KT and 10.1-meter seas (33 feet) near 51N 151w at 0600 UTC on the 20th. The buoy 46085 (55.9N 142.6W) reported at 0100 UTC on the 21st east winds 35 KT with gusts to 43 KT and seas 6.0 meters (20 feet) followed two hours later by a peak gust of 45 KT. Reported seas reached 7.5 meters (25 feet) at 0400 UTC on the 21st at this buoy.
| Observation | Position | Date/Time (UTC) | Wind | Seas (m/ft) |
|---|---|---|---|---|
| CL Germany (ELZX2) | 51N 175E | 04/1800 | W 50 | 8.0/26 |
| Polar Discovery (WACW) | 54N 144W | 05/0300 | SE 35 | 9.4/31 |
| APL Belgium (9VKQ3) | 44N 138W | 05/0600 | SW 50 | 5.8/19 |
| Polar Resolution (WDJK) | 52N 136W | 05/0800 | S 45 | 7.6/25 |
| Buoy 46066 | 52.6N 154.8W | 05/2300 | NW 40 | 10.0/33 |
| Buoy 46071 | 51.2N 179E | 04/1500 | W 35 | 7.0/23 |
| 04/1800 | Maximum | 8.2/27 | ||
| Buoy 46036 | 48.5N 133.9W | 05/0500 | S 35 | 6.0/20 |
| 06/0800 | Maximum | 9.8/32 | ||
| Buoy 46004 | 51N 136.2W | 05/0500 | S 35 | 4.6/15 |
| 06/0500 | Maximum | 8.8/29 | ||
| Buoy 46082 | 59.7N 143.4W | 05/0100 | E 45 | 6.0/20 |
| 05/0800 | Maximum | 8.8/29 | ||
| Buoy 46075 | 53.8N 159.8W | 05/2000 | NW 40 | 7.6/25 |
| 06/0100 | Maximum | 9.0/30 |
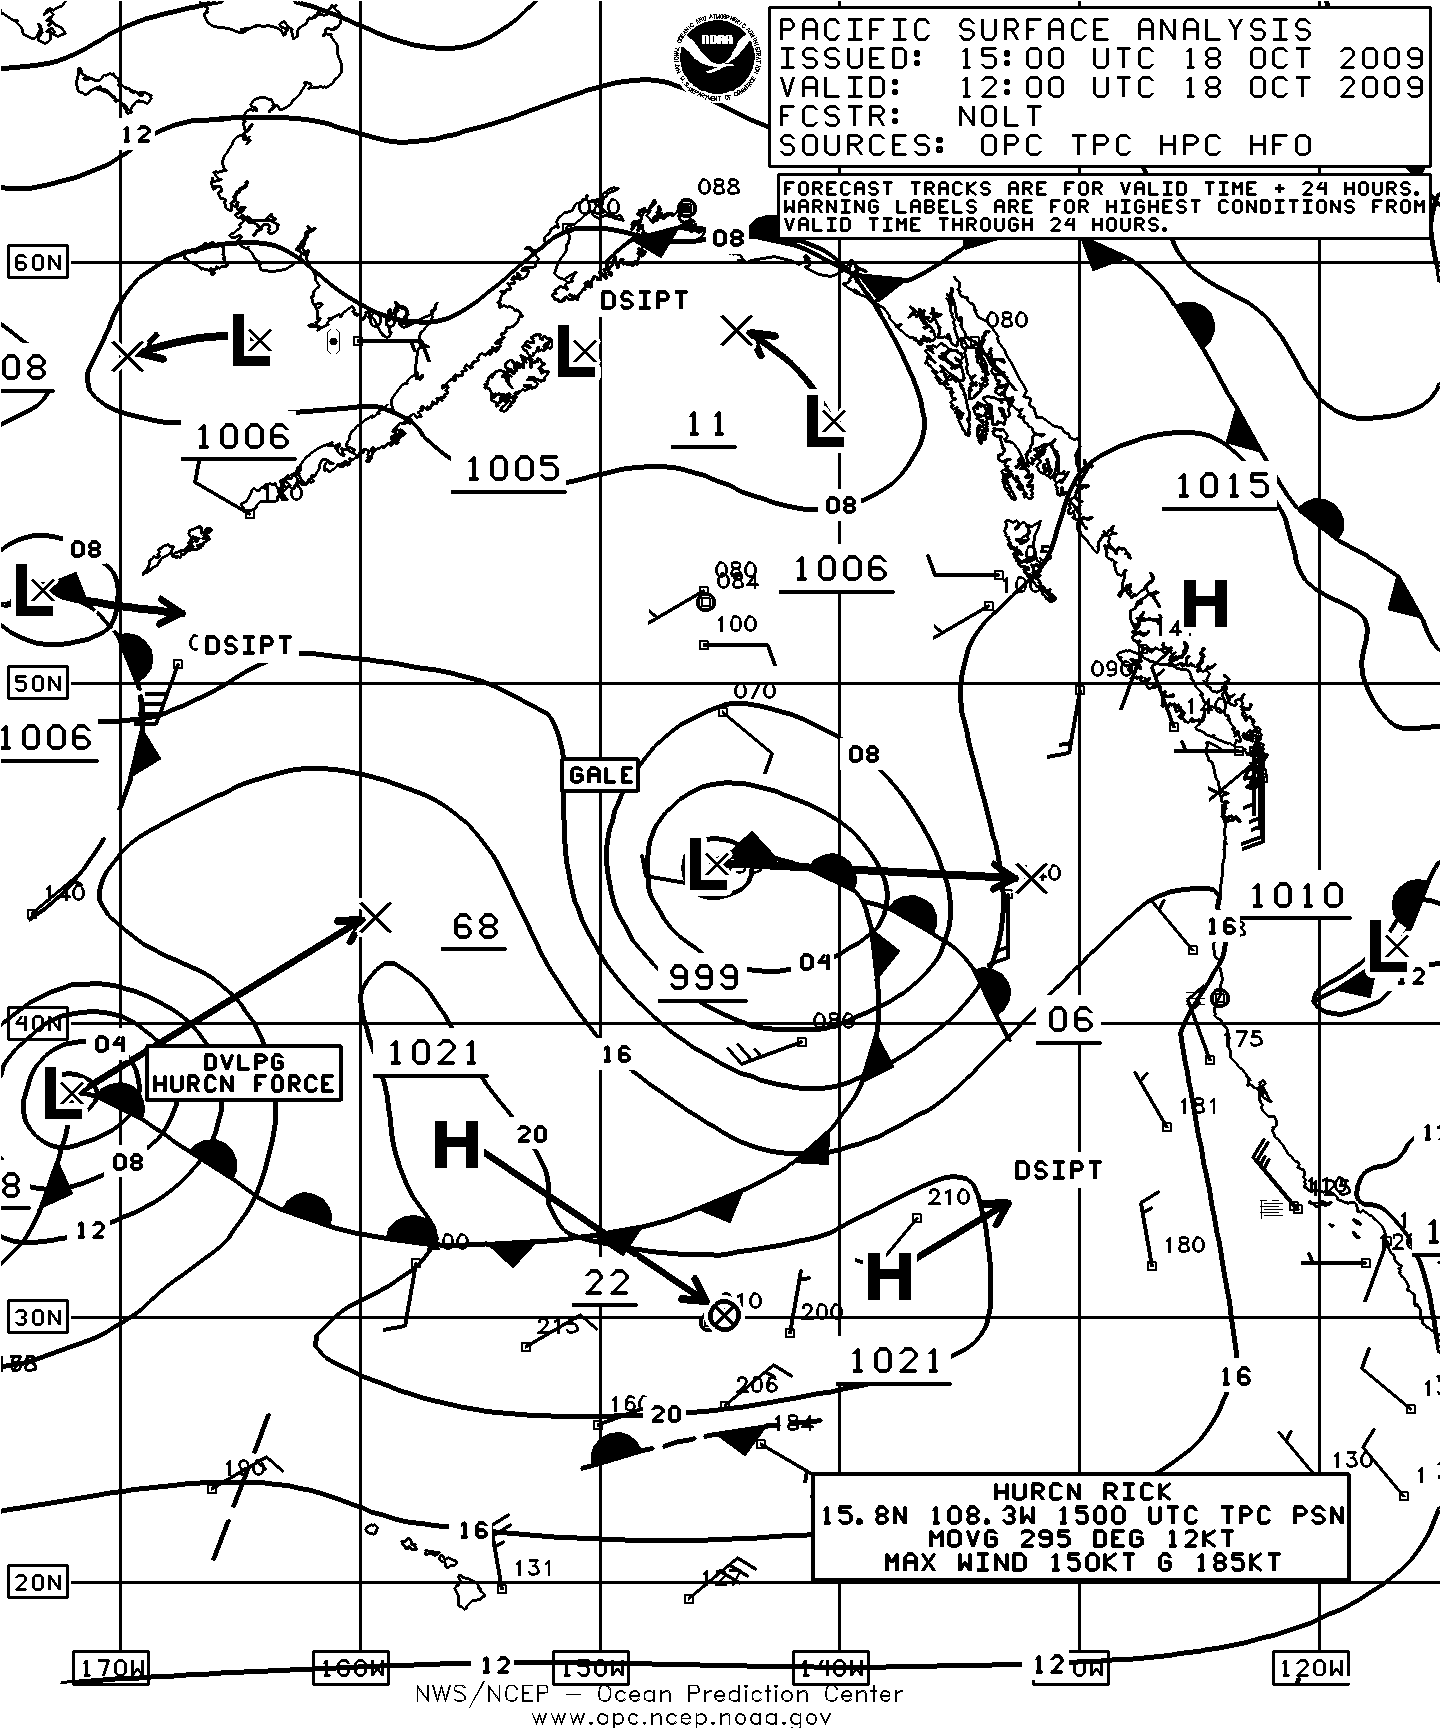
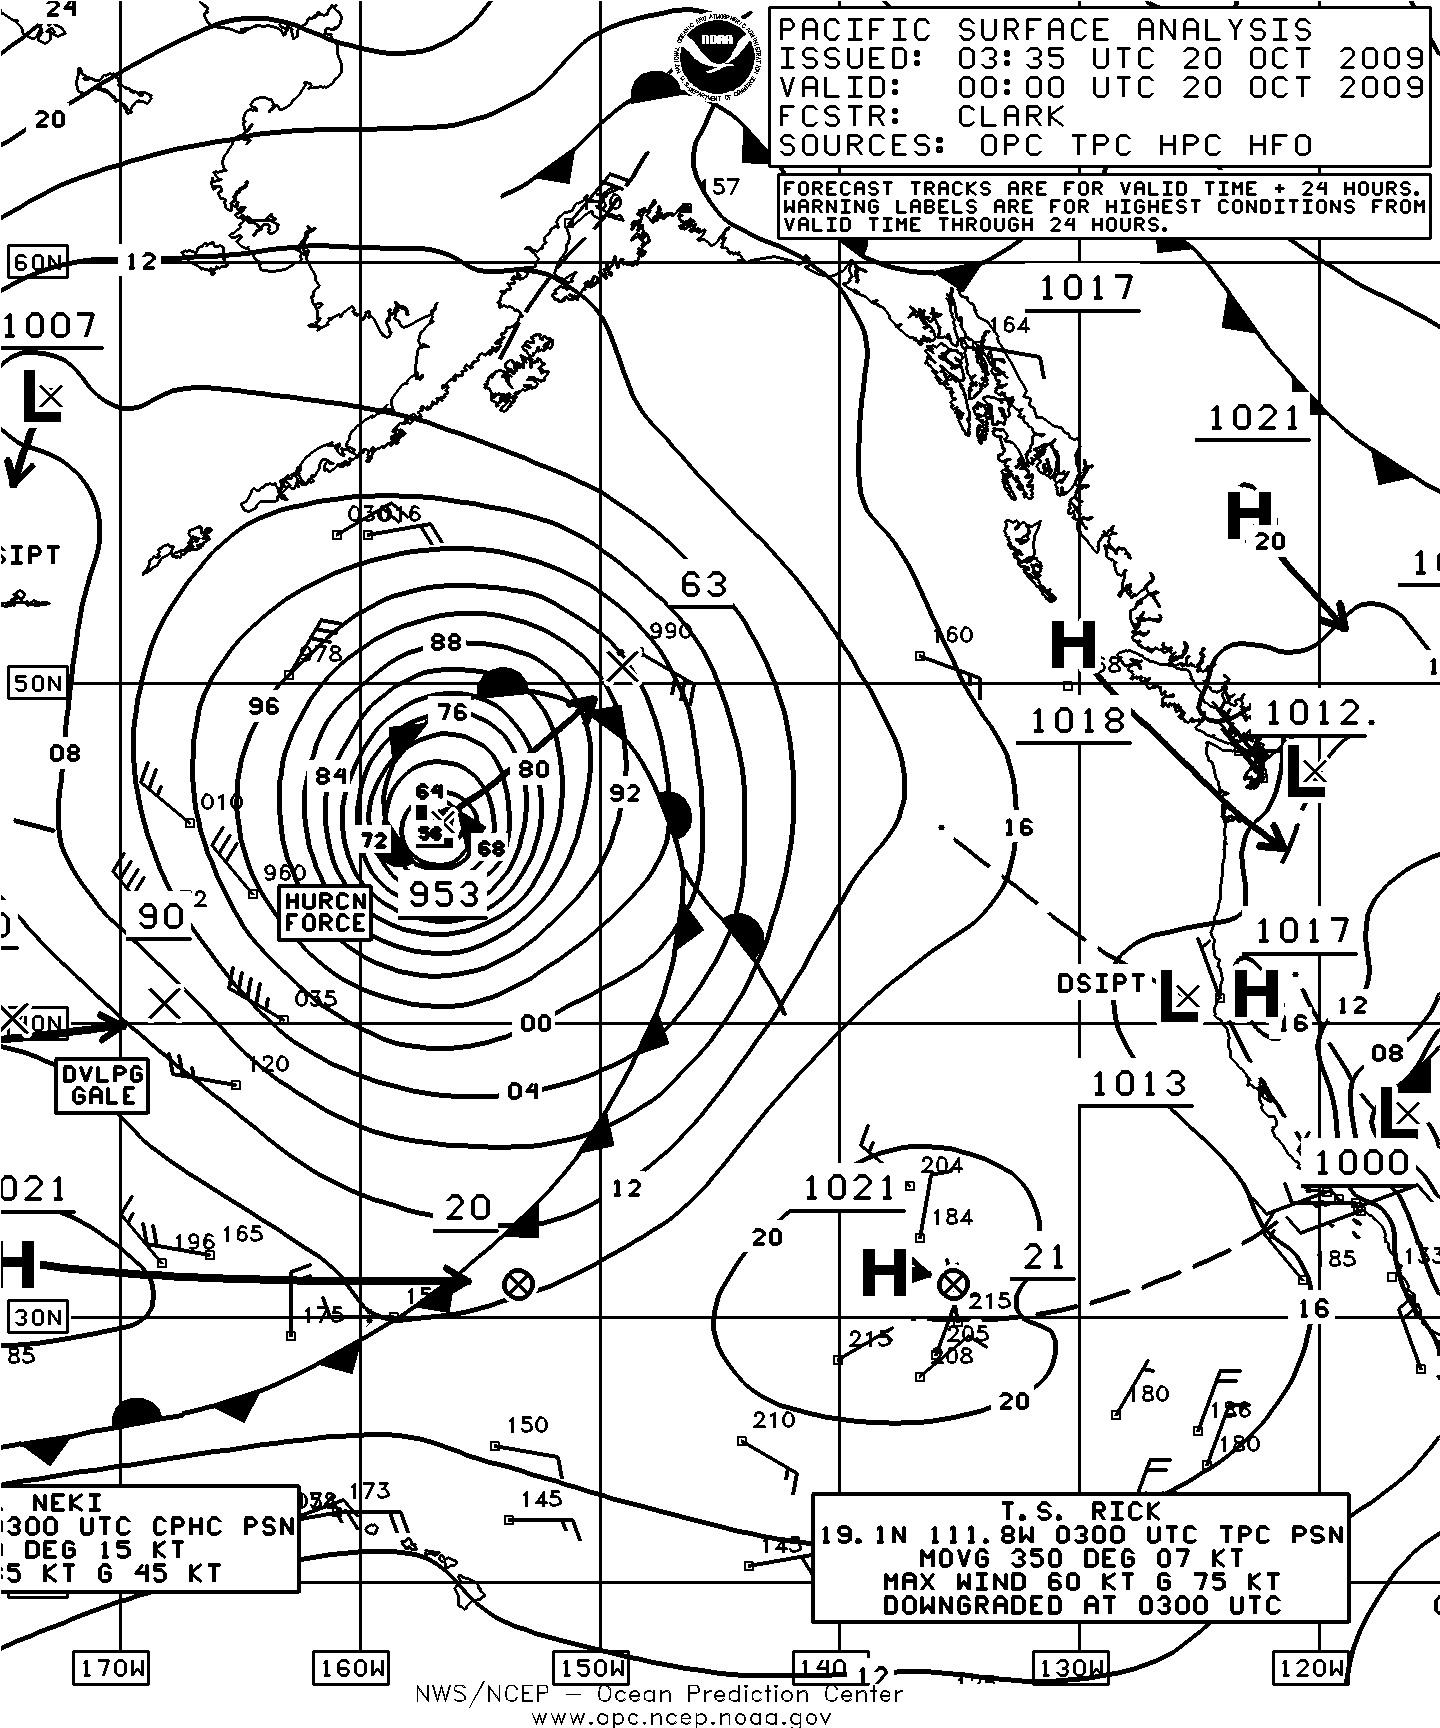
Figure 8. OPC North Pacific Surface Analysis charts (Part 1 - east) valid 1200 UTC October 18 and 0000 UTC October 20, 2009.
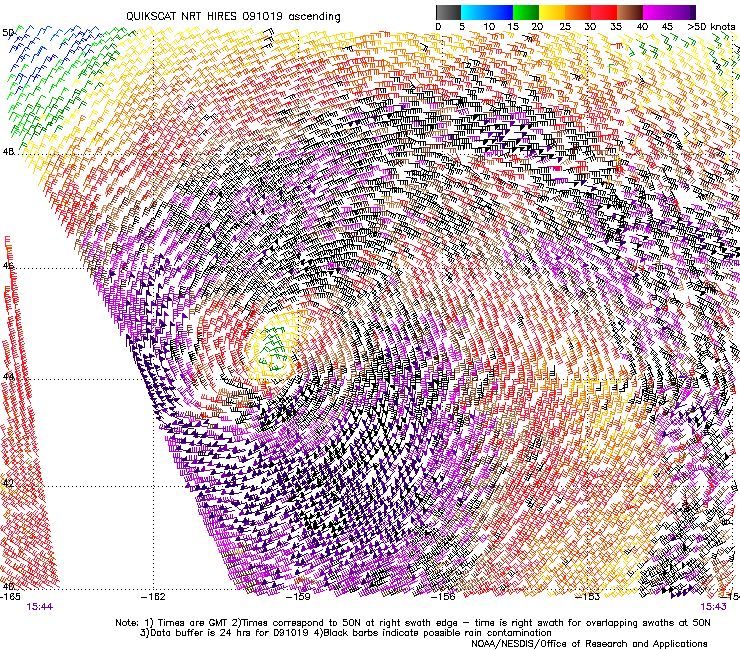
Figure 9. High-resolution QuikSCAT scatterometer image of satellite-sensed winds around the hurricane-force low depicted in the second part of Figure 8. The valid time of the pass is 1543 UTC October 19, 2009, or about eight and one-quarter hours prior to the valid time of the second part of Figure 8. The well-defined center of the cyclone appears near 44N 160W in the left-center portion of the image. Image is courtesy of NOAA/NESDIS/ Office of Research and Applications.
North Pacific Storm, November 2-7: This developing storm originated near Japan early on November 2 and Figure 10 depicts the subsequent rapid intensification of this cyclone over a thirty-six hour period. The central pressure dropped 38 hPa in the twenty-four hour period following 1800 UTC November 3 and the second part of Figure 10 shows the cyclone near maximum intensity. The lowest central pressure reached was 945 hPa twelve hours later when the center passed near 56N 143W. The high-resolution QuikSCAT imagery in Figure 11 for a valid time close to that of the second part of Figure 10 reveals that the main focus of strongest winds is with the front in the northern Gulf of Alaska and on the south and southwest sides of the storm center. The highest winds appearing in this image is 60 KT but there were some hurricane force winds of 65 KT a bit off the area of the image to the southwest. Table 3 lists some ships and buoy observations taken in this event. The cyclone subsequently stalled in the northeastern Gulf of Alaska on the 6th with its maximum winds weakening to gale force late on the 6th. The slowly weakening cyclone then drifted west on the 8th and 9th before accelerating southeastward November 10th and 11th and dissipating near the Oregon coast on the 12th
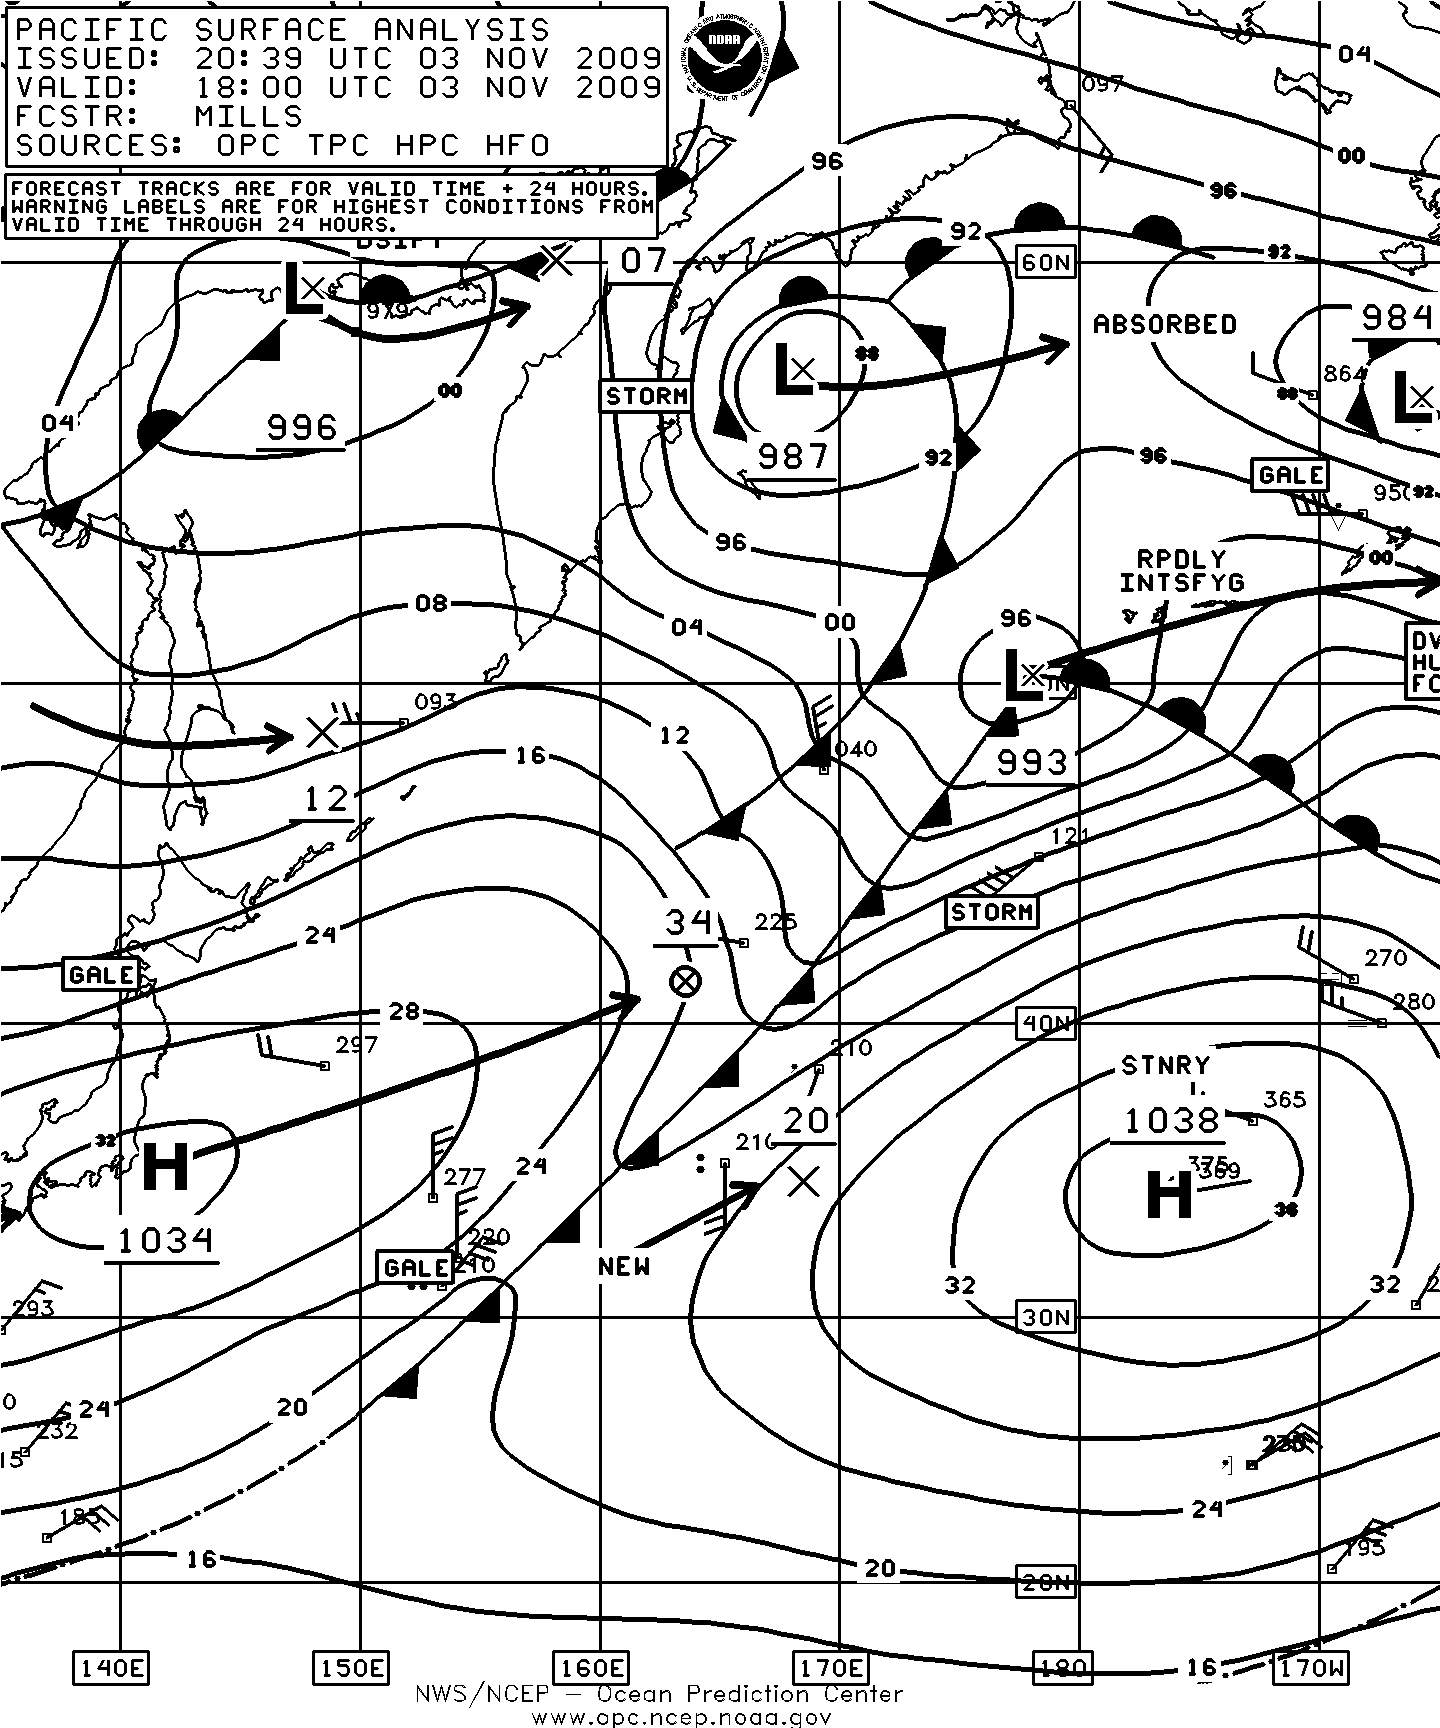
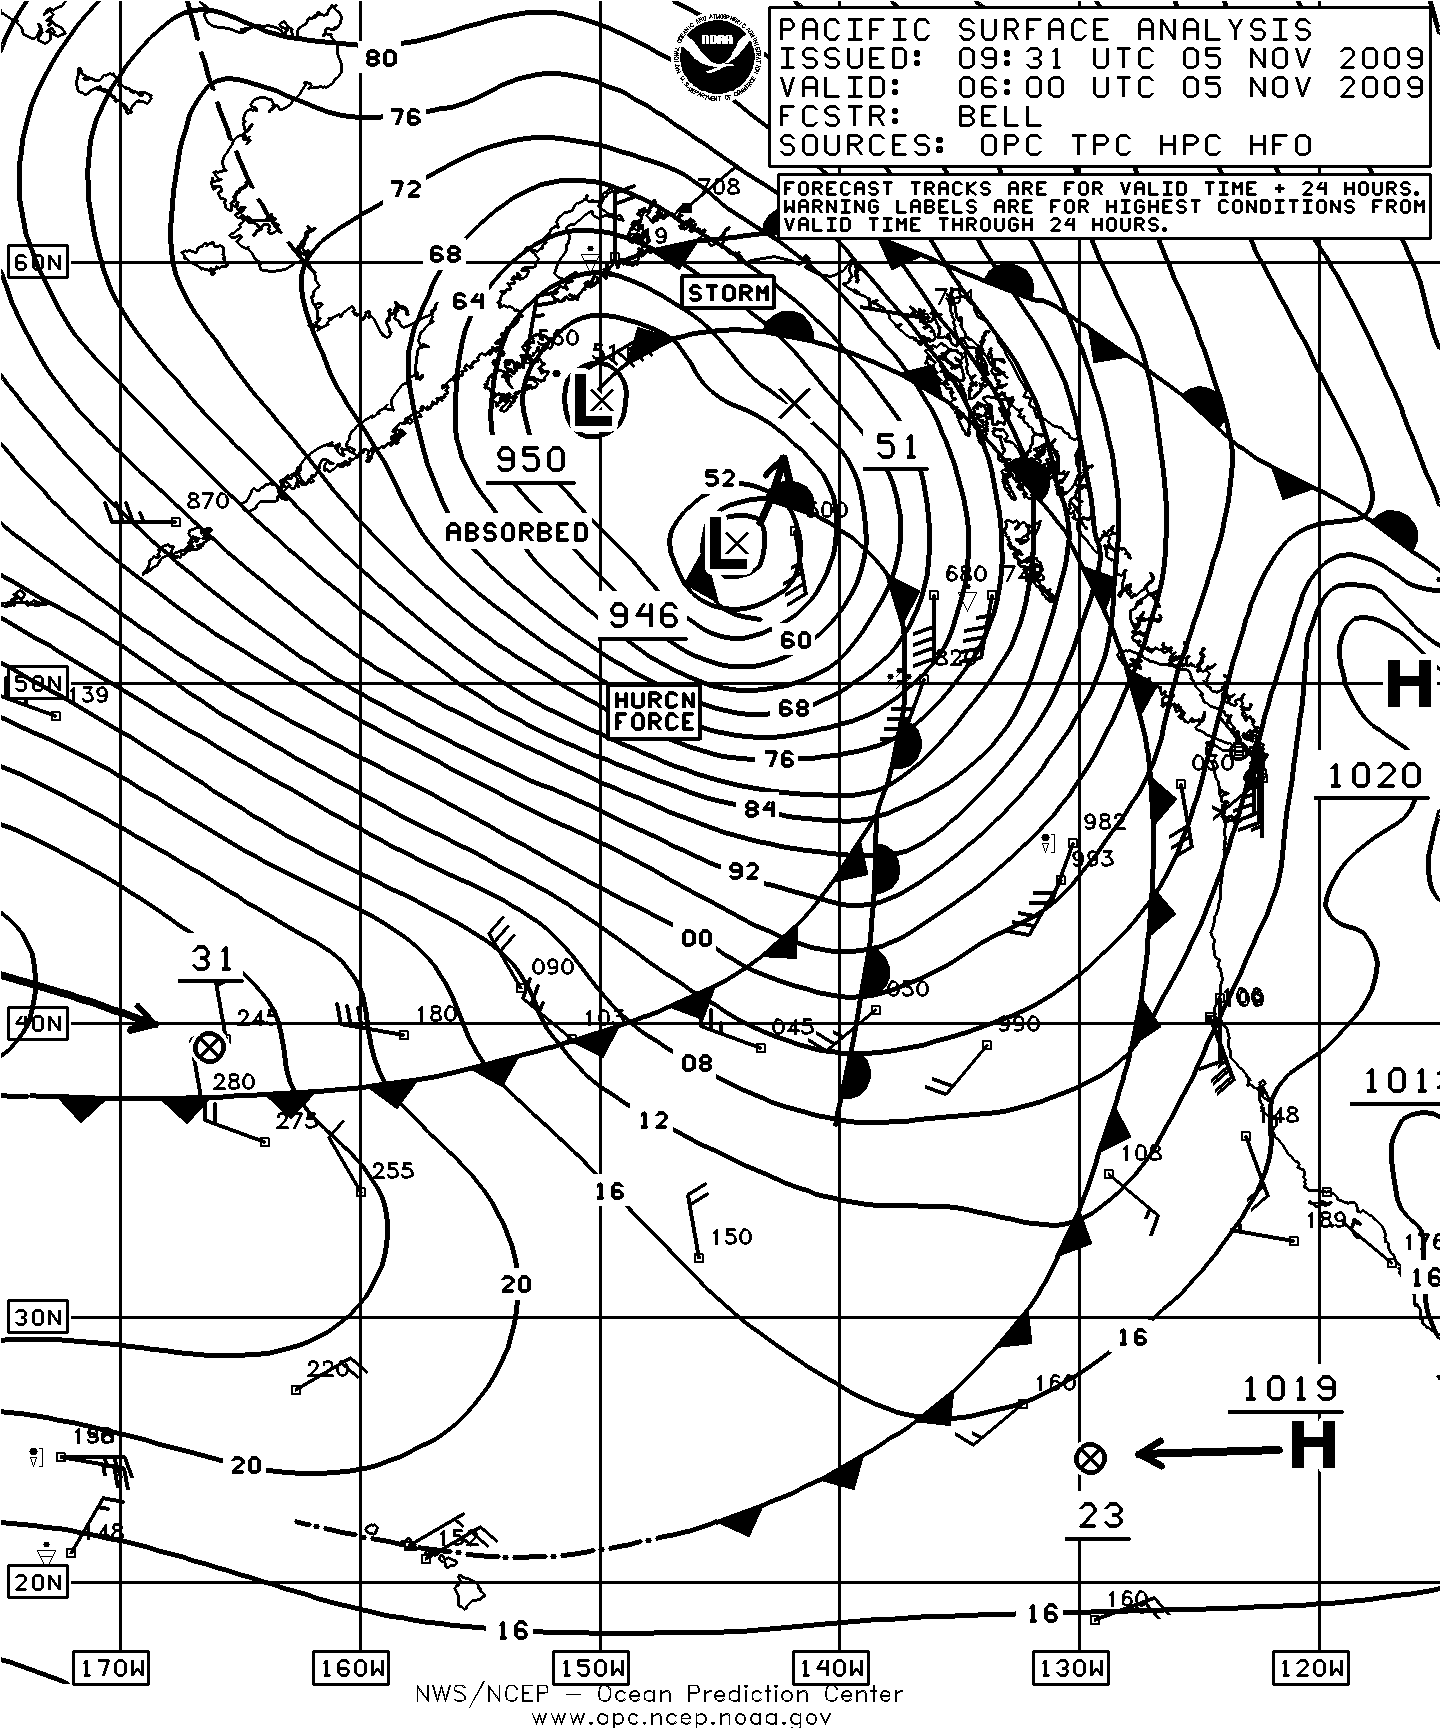
Figure 10. OPC North Pacific Surface Analysis charts (Part 1) valid 1800 UTC November 3 and 0600 UTC November 5, 2009.
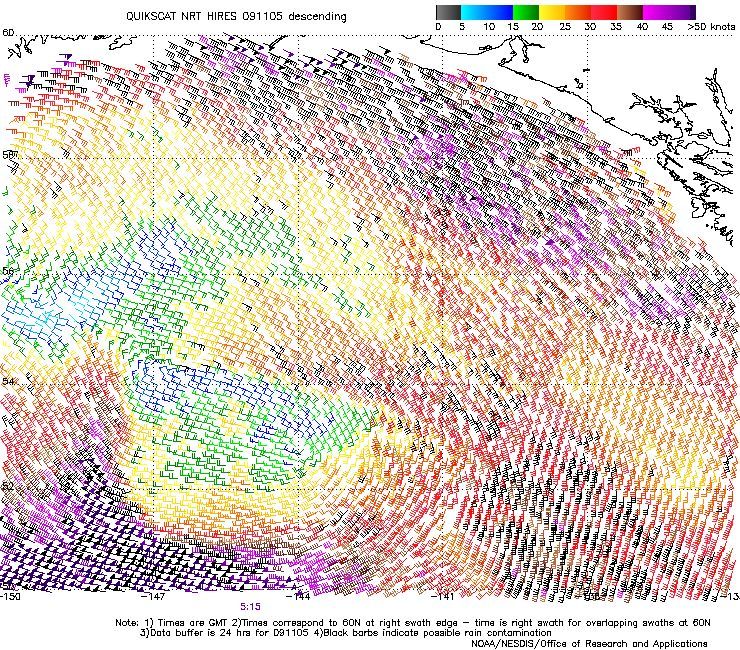
Figure 11. High-resolution QuikSCAT scatterometer image of satellite-sensed winds around the intense cyclone shown in the second part of Figure 10. The valid time of the pass is 0515 UTC November 5, 2009, or less than one hour prior to the valid time of the second part of Figure 10. The center of the cyclone appears near 53N 144W in the lower-left portion of the image. Image is courtesy of NOAA/NESDIS/Office of Research and Applications.
Northeastern Pacific Storm, November 13-15: The rapid development of this second deepest cyclone of the period from a complex of lows near the southern Alaska coast is shown in Figure 12. The main low center near 54N 161W in the first part of Figure 12 originated near Japan late on November 10 and in the following twenty-four hour period absorbed the other two lows to the north. The central pressure fell 38 hPa in the twenty-four hour period ending at 1200 UTC on the 14th. The second part of Figure 12 shows the cyclone at maximum intensity near the Alaskan coast with a central pressure of 947 hPa, the second cyclone to develop central pressures below 950 hPa in the four-month period in the North Pacific. Figure 13 is a high-resolution QuikSCAT pass near the time of maximum intensity revealing a swath of winds 50 to 70 KT on the south side of the cyclone in Figure 12 and there appears to be even an 80-KT wind retrieval near 56N 144W. Table 4 lists some observations from ships and buoys during this storm. The cyclone subsequently stalled and weakened in the northern Gulf of Alaska with its maximum winds diminishing to gale force early on the 15th and to below gale force on the 17th and dissipation followed late on the 17th.
| Observation | Position | Date/Time (UTC) | Wind | Seas (m/ft) |
|---|---|---|---|---|
| Midnight Sun (WAHG) | 57N 146W | 14/1400 | W 60 | 5.2/17 |
| Horizon Anchorage (KGTX) | 56N 141W | 14/1500 | SW 50 | 10.7/35 |
| 56N 141W | 14/1800 | W 50 | 17.1/56 | |
| 57N 142W | 15/0000 | W 50 | 10.4/34 | |
| Polar Discovery (WACW) | 59N 146W | 15/0000 | W 40 | 8.5/28 |
| Buoy 46001 | 56.3N 147.9W | 14/1100 | NW 49 G 64 | 4.0/13 |
| 14/1500 | Maximum | 7.6/25 | ||
| Buoy 46083 | 58.2N 138.1W | 14/1900 | SW 45 | 7.6/25 |
| 14/1900 | Maximum | 10.1/33 | ||
| Buoy 46085 | 55.9N 142.6W | 14/1500 | W 45 | 10.1/33 |
| Buoy 46066 | 52.7N 155W | 14/1400 | W 35 | 6.1/20 |
| Buoy 46183 | 53.6N 131.1W | 14/1600 | SE 45 G62 | 5.5/18 |
| 14/1900 | Maximum | 7.0/23 | ||
| Buoy 46185 | 52.4N 129.8W | 14/1900 | SE 43 G54 | 8.0/26 |
| 14/2100 | Maximum | 8.5/28 |
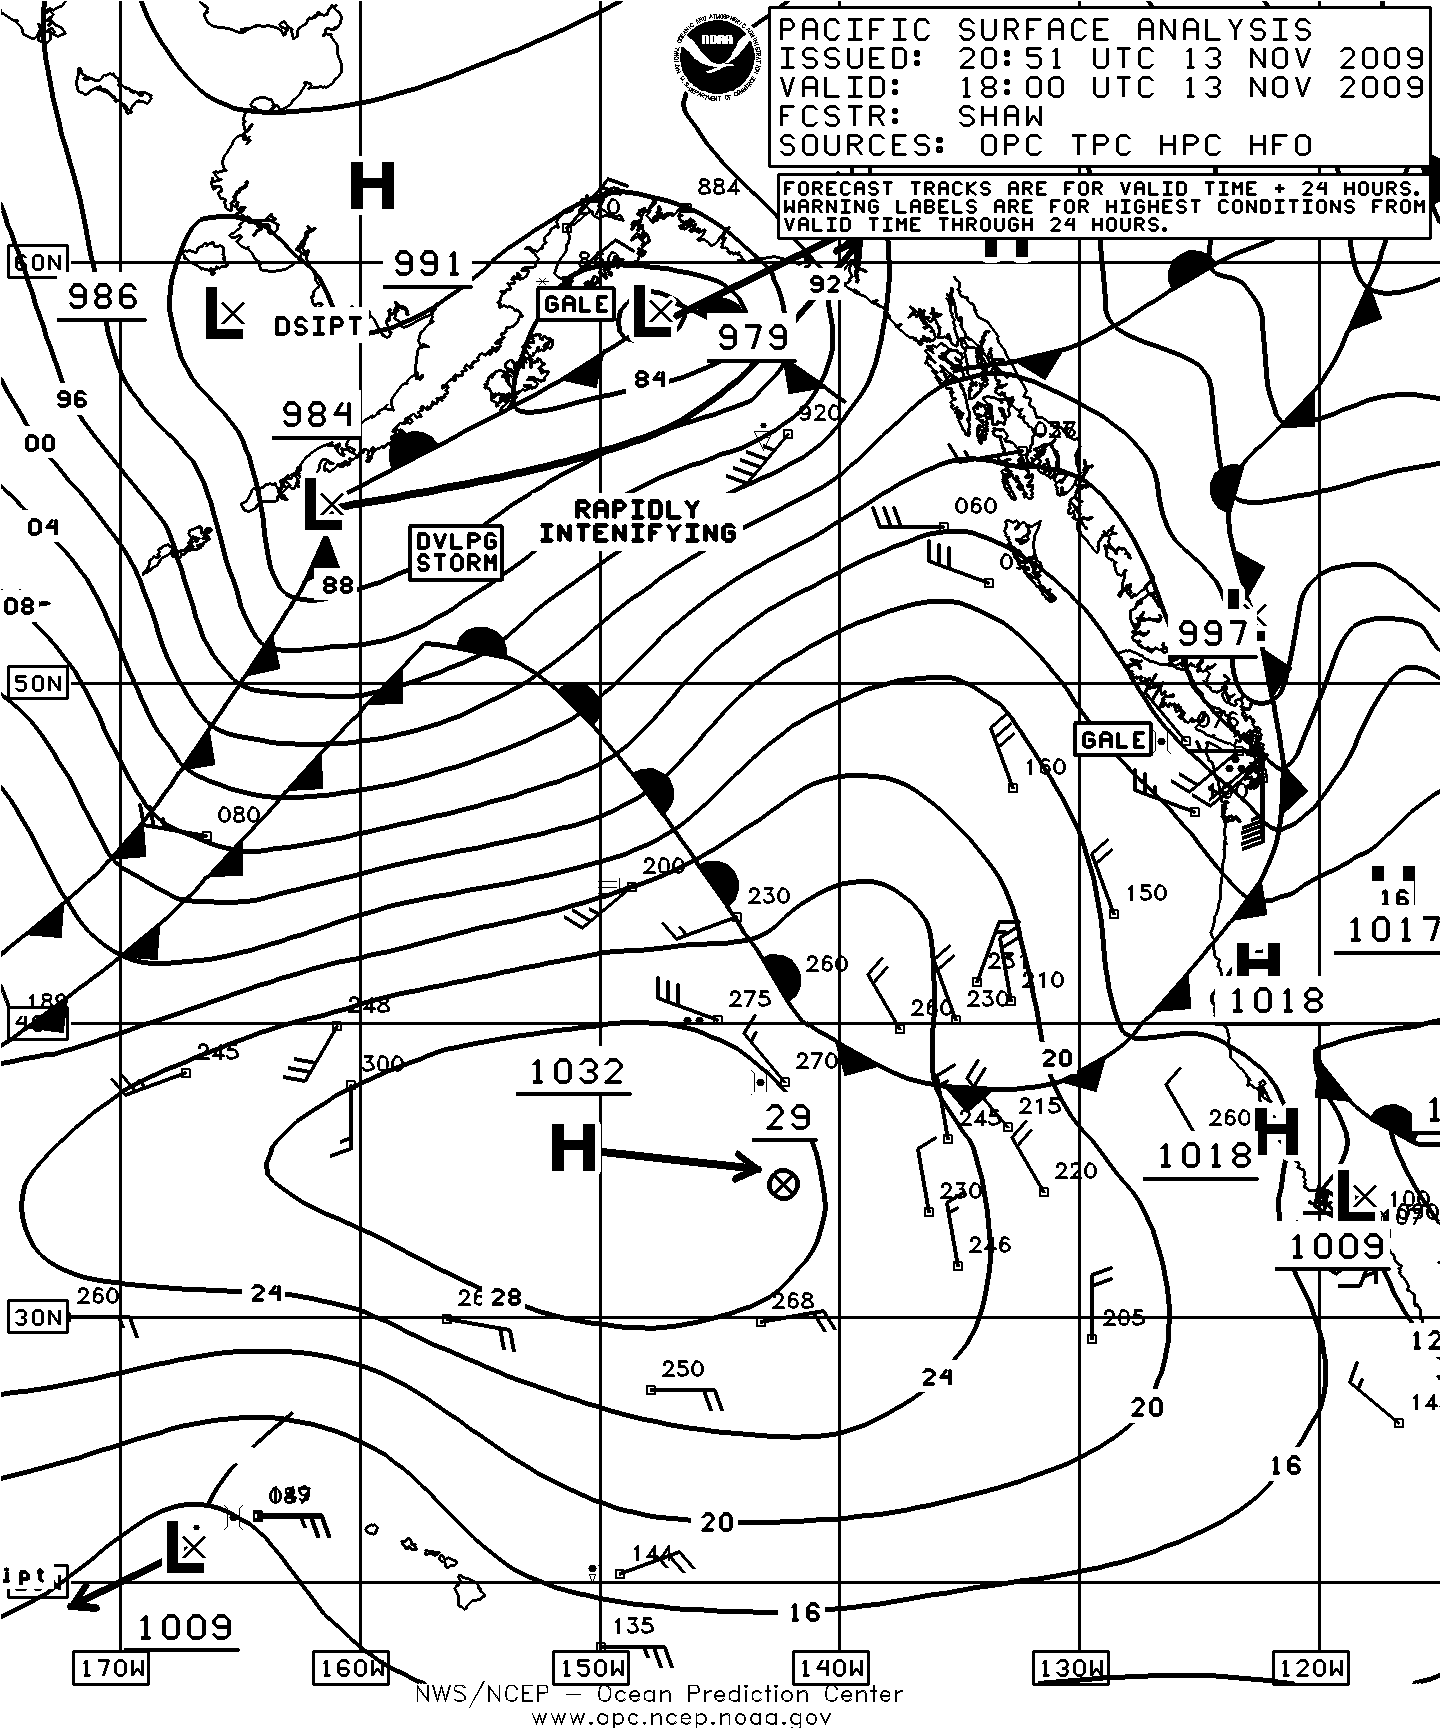
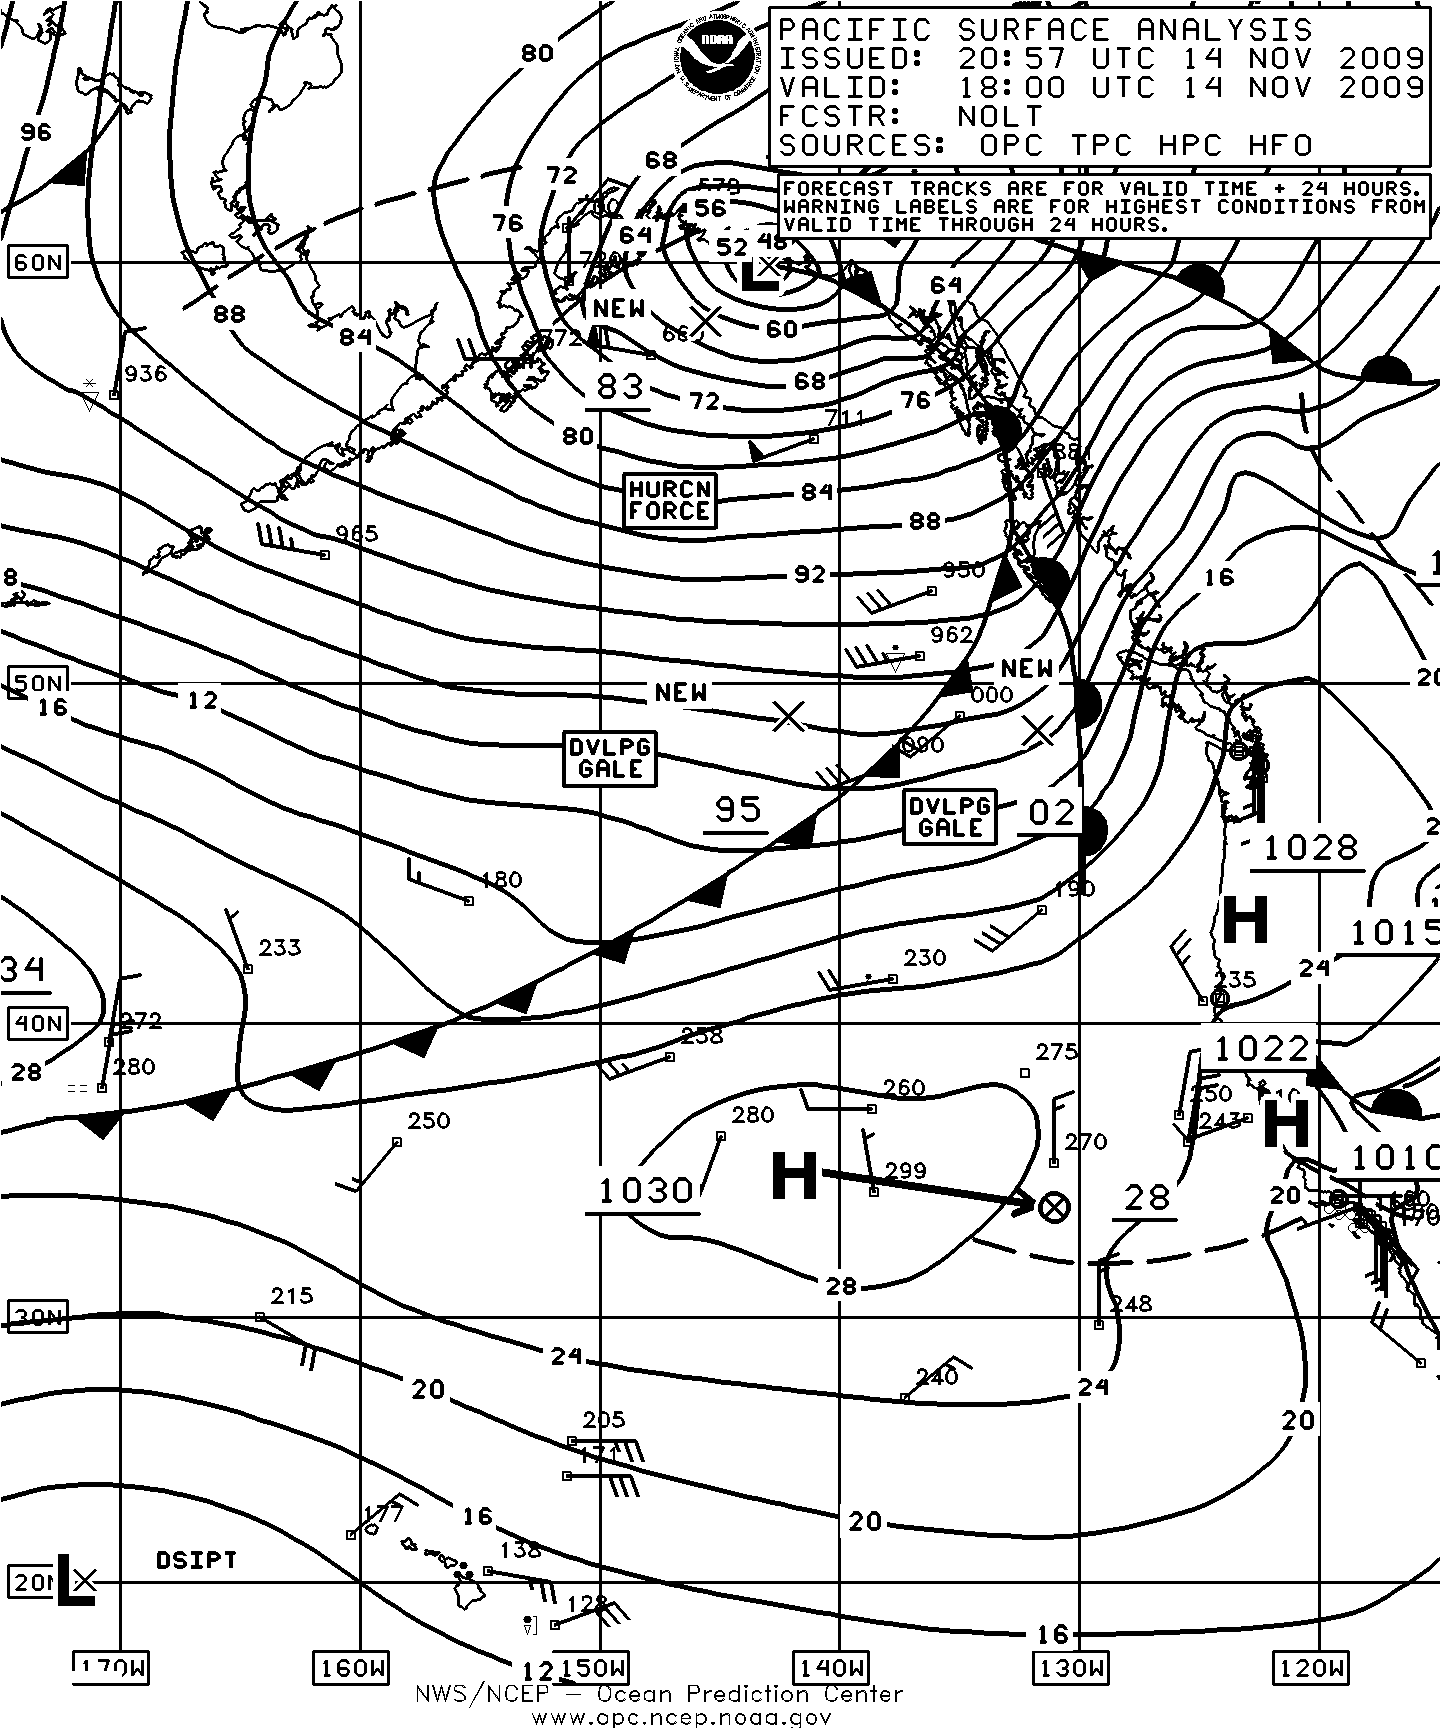
Figure 12. OPC North Pacific Surface Analysis charts (Part 1) valid 1800 UTC November 13 and 14, 2009.
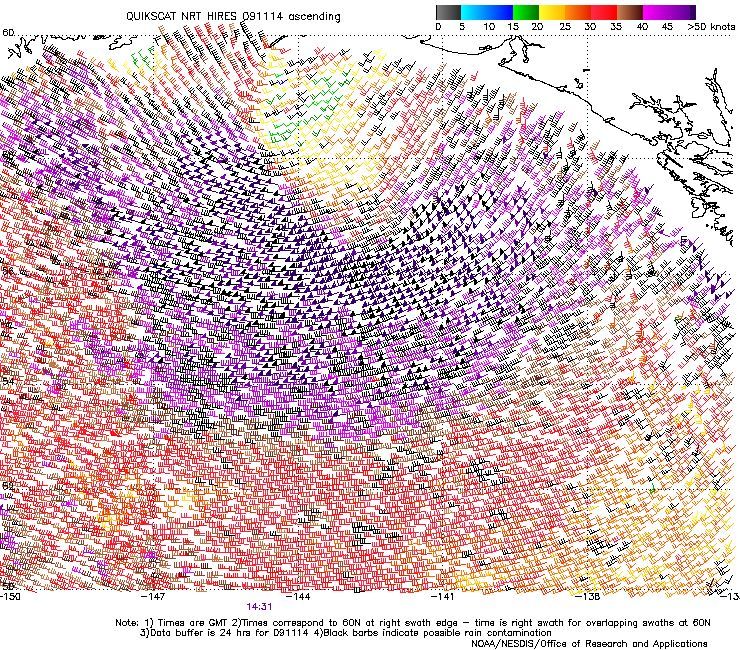
Figure 13. High-resolution QuikSCAT scatterometer image of satellite-sensed winds around the south side of the hurricane-force low shown in the second part of Figure 12. The valid time of the pass is 1431 UTC November 14, 2009, or about three and one-half hours prior to the valid time of the second part of Figure 12. The center of the storm is near the top of the image but is not visible due to coastal masking of QuikSCAT winds. Image is courtesy of NOAA/NESDIS/ Office of Research and Applications.
Northwestern Pacific and Bering Sea Storm, November 17-21: The development of the deepest cyclone of the period to move into the Bering Sea is depicted in Figure 14. During the twenty-four hour period of most rapid intensification beginning at 1800 UTC November 17 the central pressure fell 37 hPa. The second part of Figure 14 shows the cyclone at maximum intensity. The Chirikana (3EKU3) near 32N 134E at 0600 UTC on the 17th reported north winds of 50 KT. The Polar Spirit (C6WL6) near 41N 145E at 0600 UTC on the 18th encountered west winds of 50 KT. The buoy 46035 (57.1N 177.9W) at 0800 UTC November 19 reported east winds of 45 KT and 4.3-meter seas (14 feet) and highest seas ten hours later of 8.5 meters (28 feet). The buoy 46071 (51.2N 179.0E) reported southwest winds of 35 KT and 13.7-meter seas (45 feet) at 1900 UTC on the 19th. QuikSCAT imagery (25 km resolution) from 0910 UTC November 19 revealed a swath of west to southwest winds of 50 to 65 KT on the south side of the cyclone. The time of this pass was just three hours later than the valid time of the second part of Figure 14. The cyclone subsequently drifted east in the southern Bering Sea and weakened with its top winds diminishing to storm force late on the 19th and to gale force late on the 21st. Dissipation followed on the 22nd near the central Aleutians.
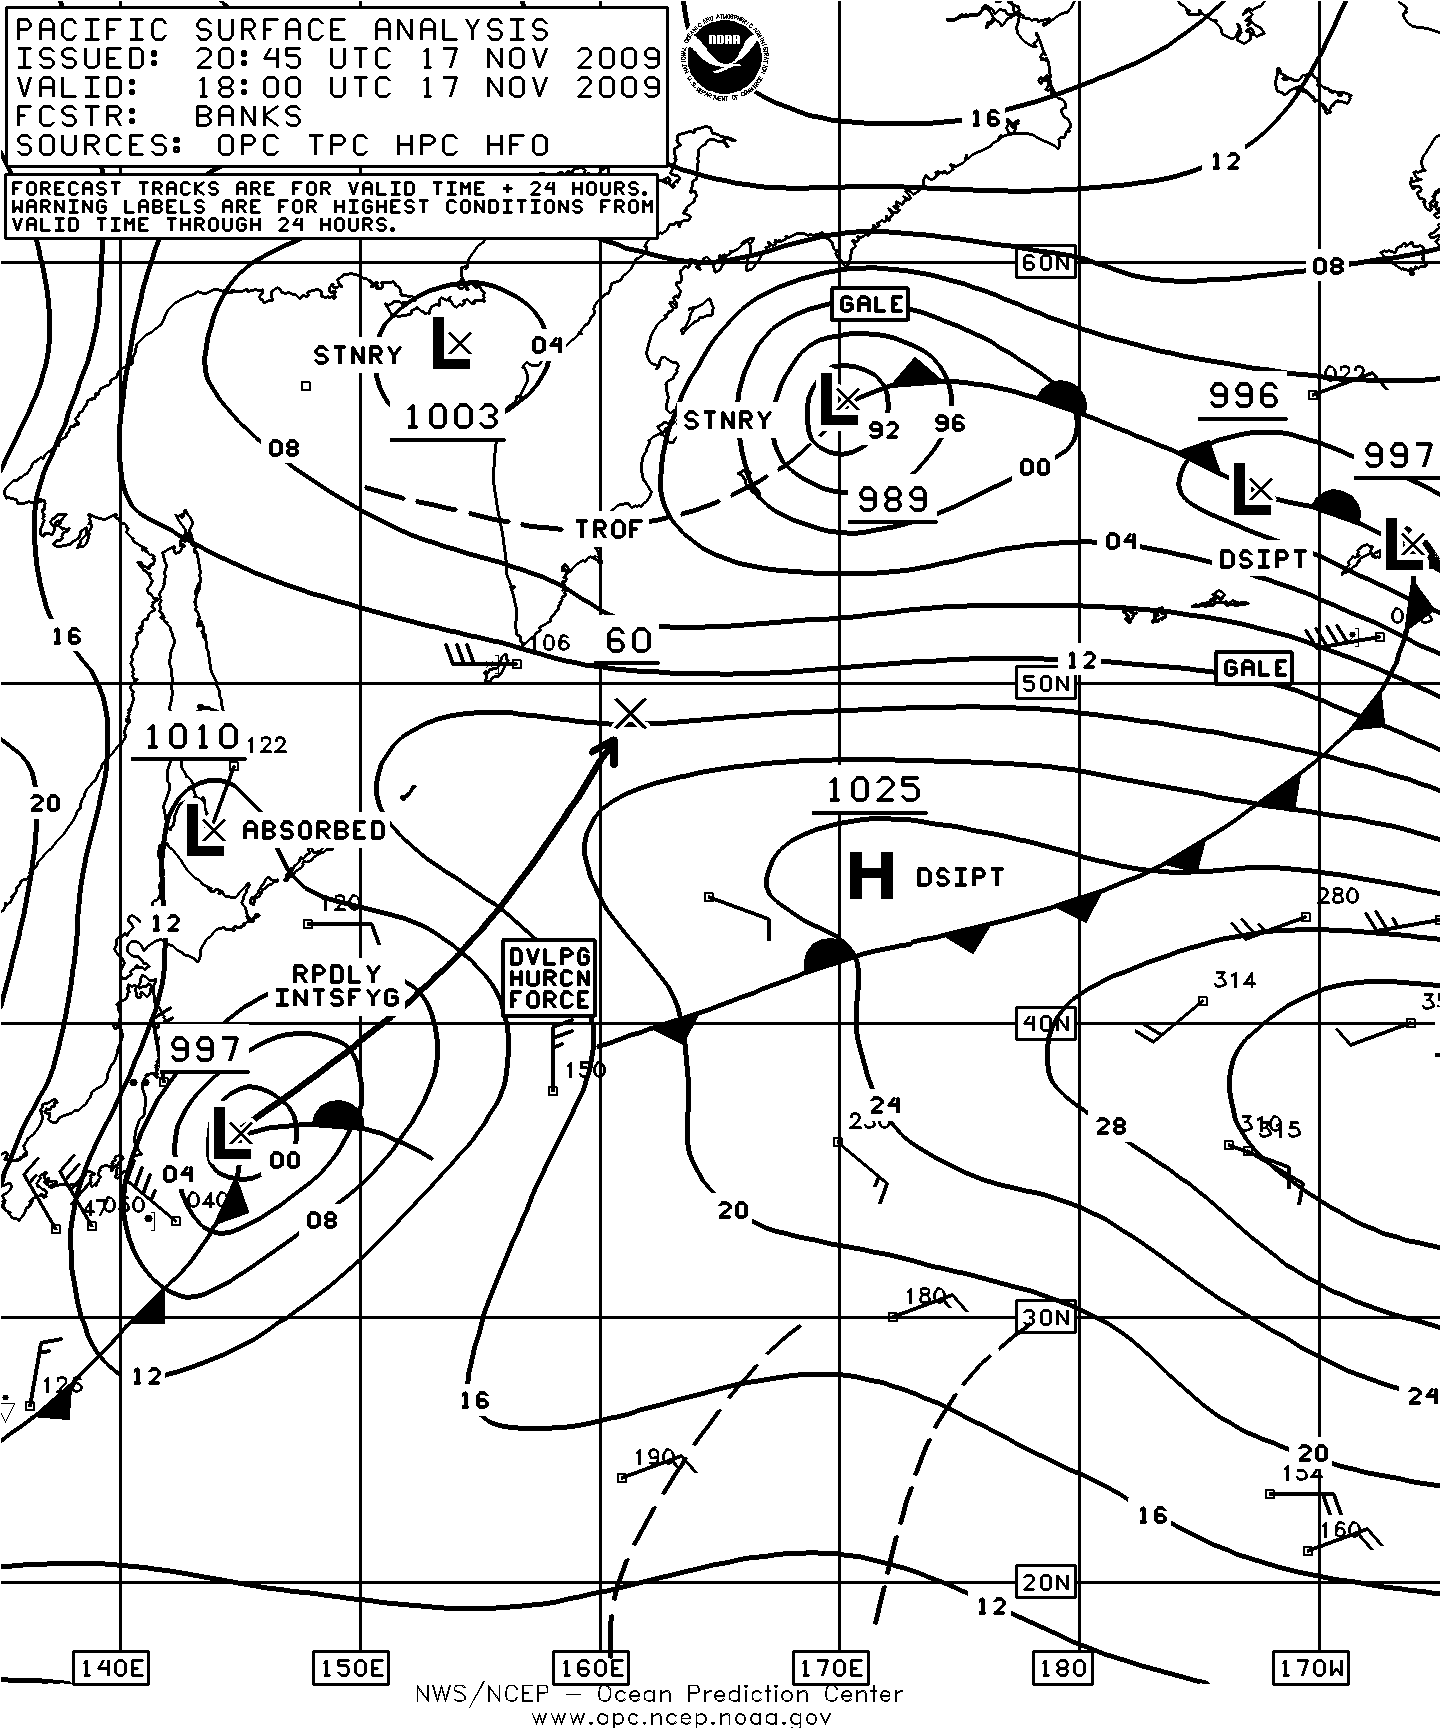
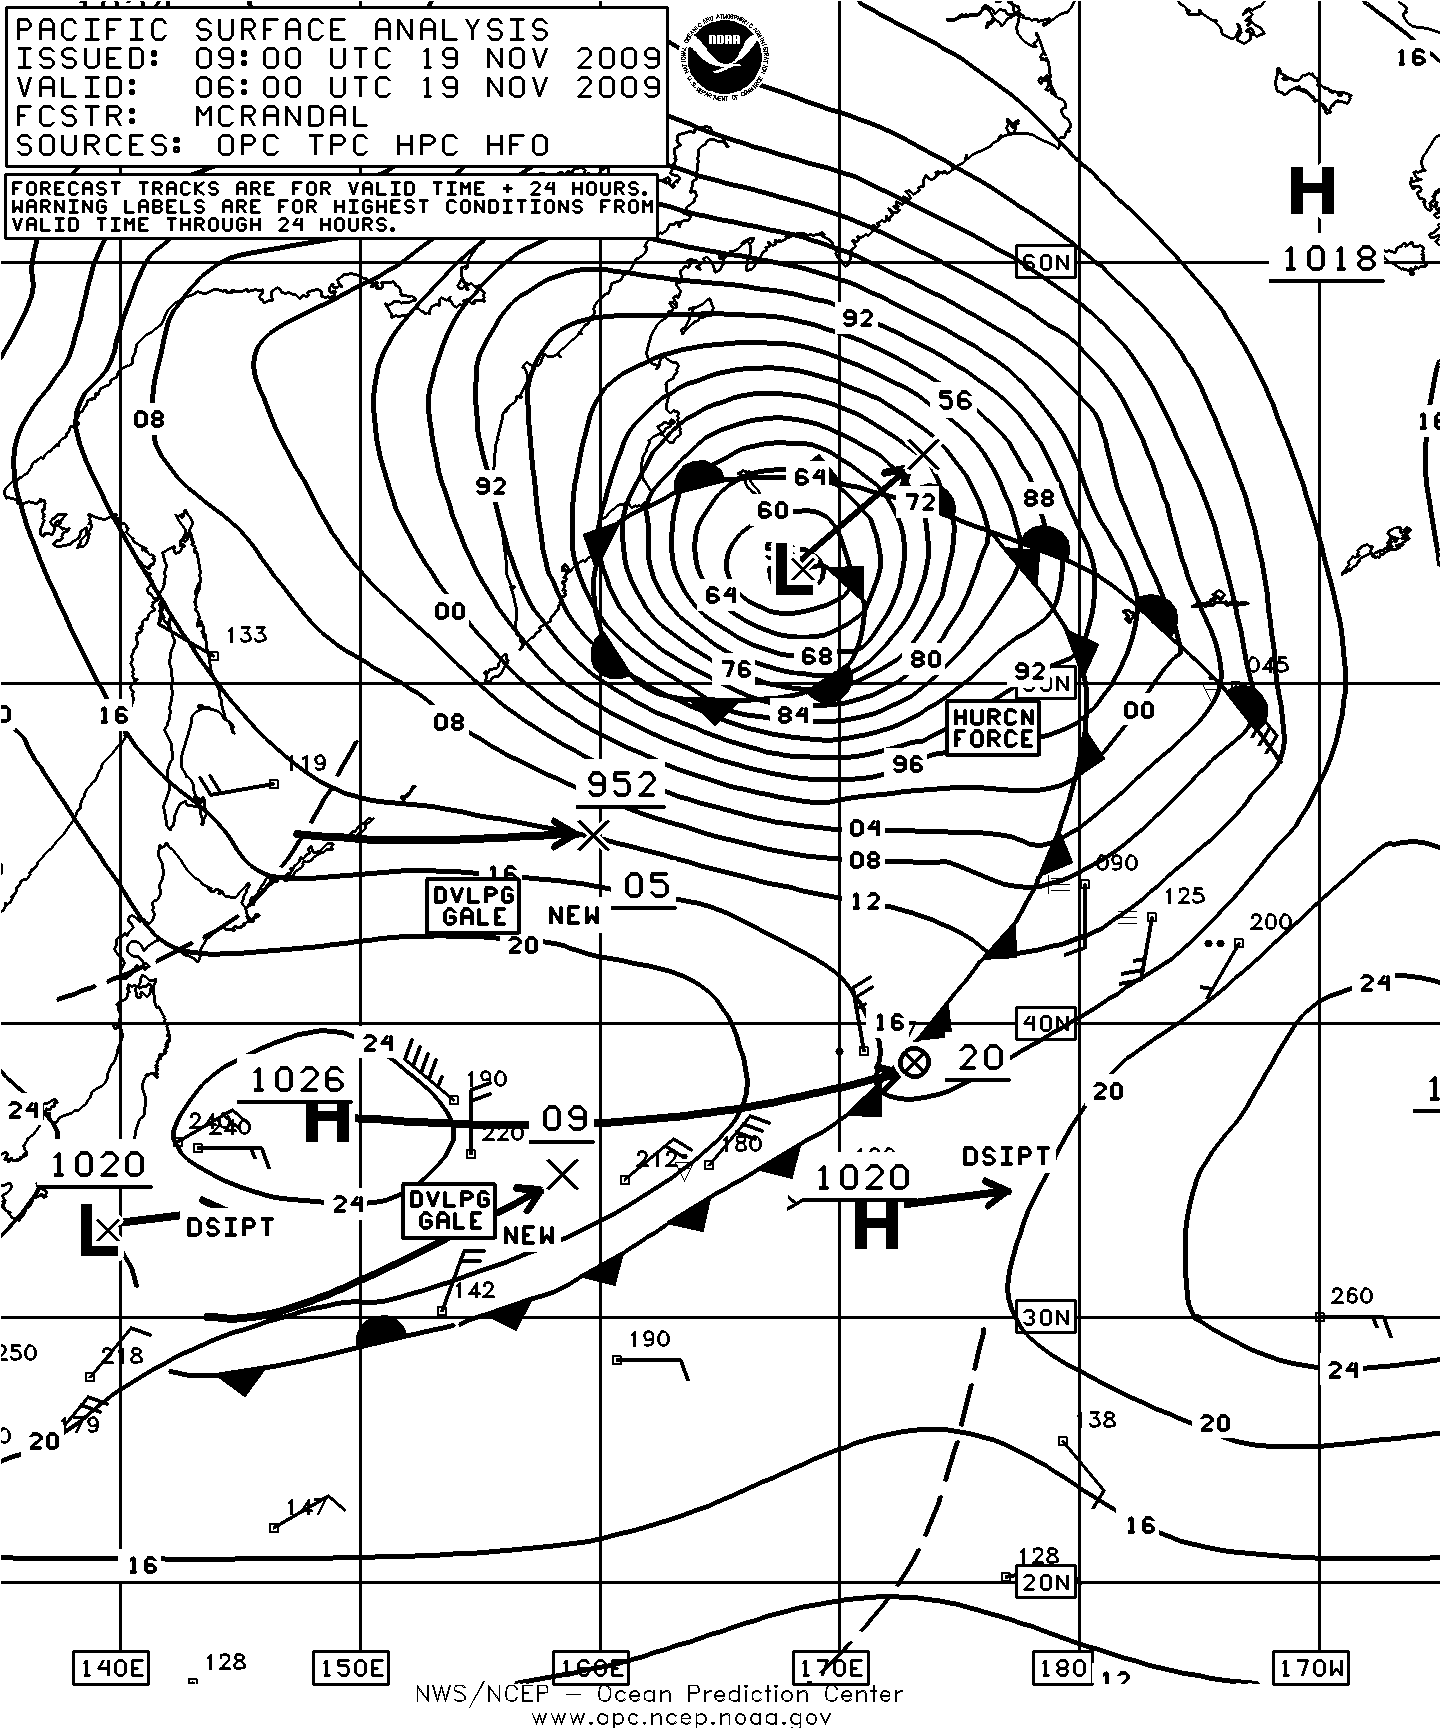
Figure 14. OPC North Pacific Surface Analysis charts (Part 2) valid 1800 UTC November 17 and 0600 UTC November 19, 2009.
North Pacific Storm, November 22-25: This developing cyclone originated like many during the period near Japan late on November 20 and tracked east-northeast over the next several days with rapid intensification beginning on the 22nd as the cyclone developed hurricane-force winds by the 23rd (Figure 15). The central pressure fell 37 hPa during the twenty-four hour period covered by Figure 15. In the last QuikSCAT image before failure of the instrument (Figure 16) the main rather compact circulation of stronger winds, to 70 KT around the center, is apparent in the lower right. A swath of west to northwest winds extends to the west associated with the second storm center to the northwest appearing in the second part of Figure 15. The cyclone developed a lowest central pressure of 961 hPa near 44N 159W at 0000 UTC on the 24th. The highest winds in the cyclone weakened to storm force on the 24th and to gale force early on the 25th as the center turned northeast and weakened. Dissipation inland over Southeast Alaska occurred early on the 26th.
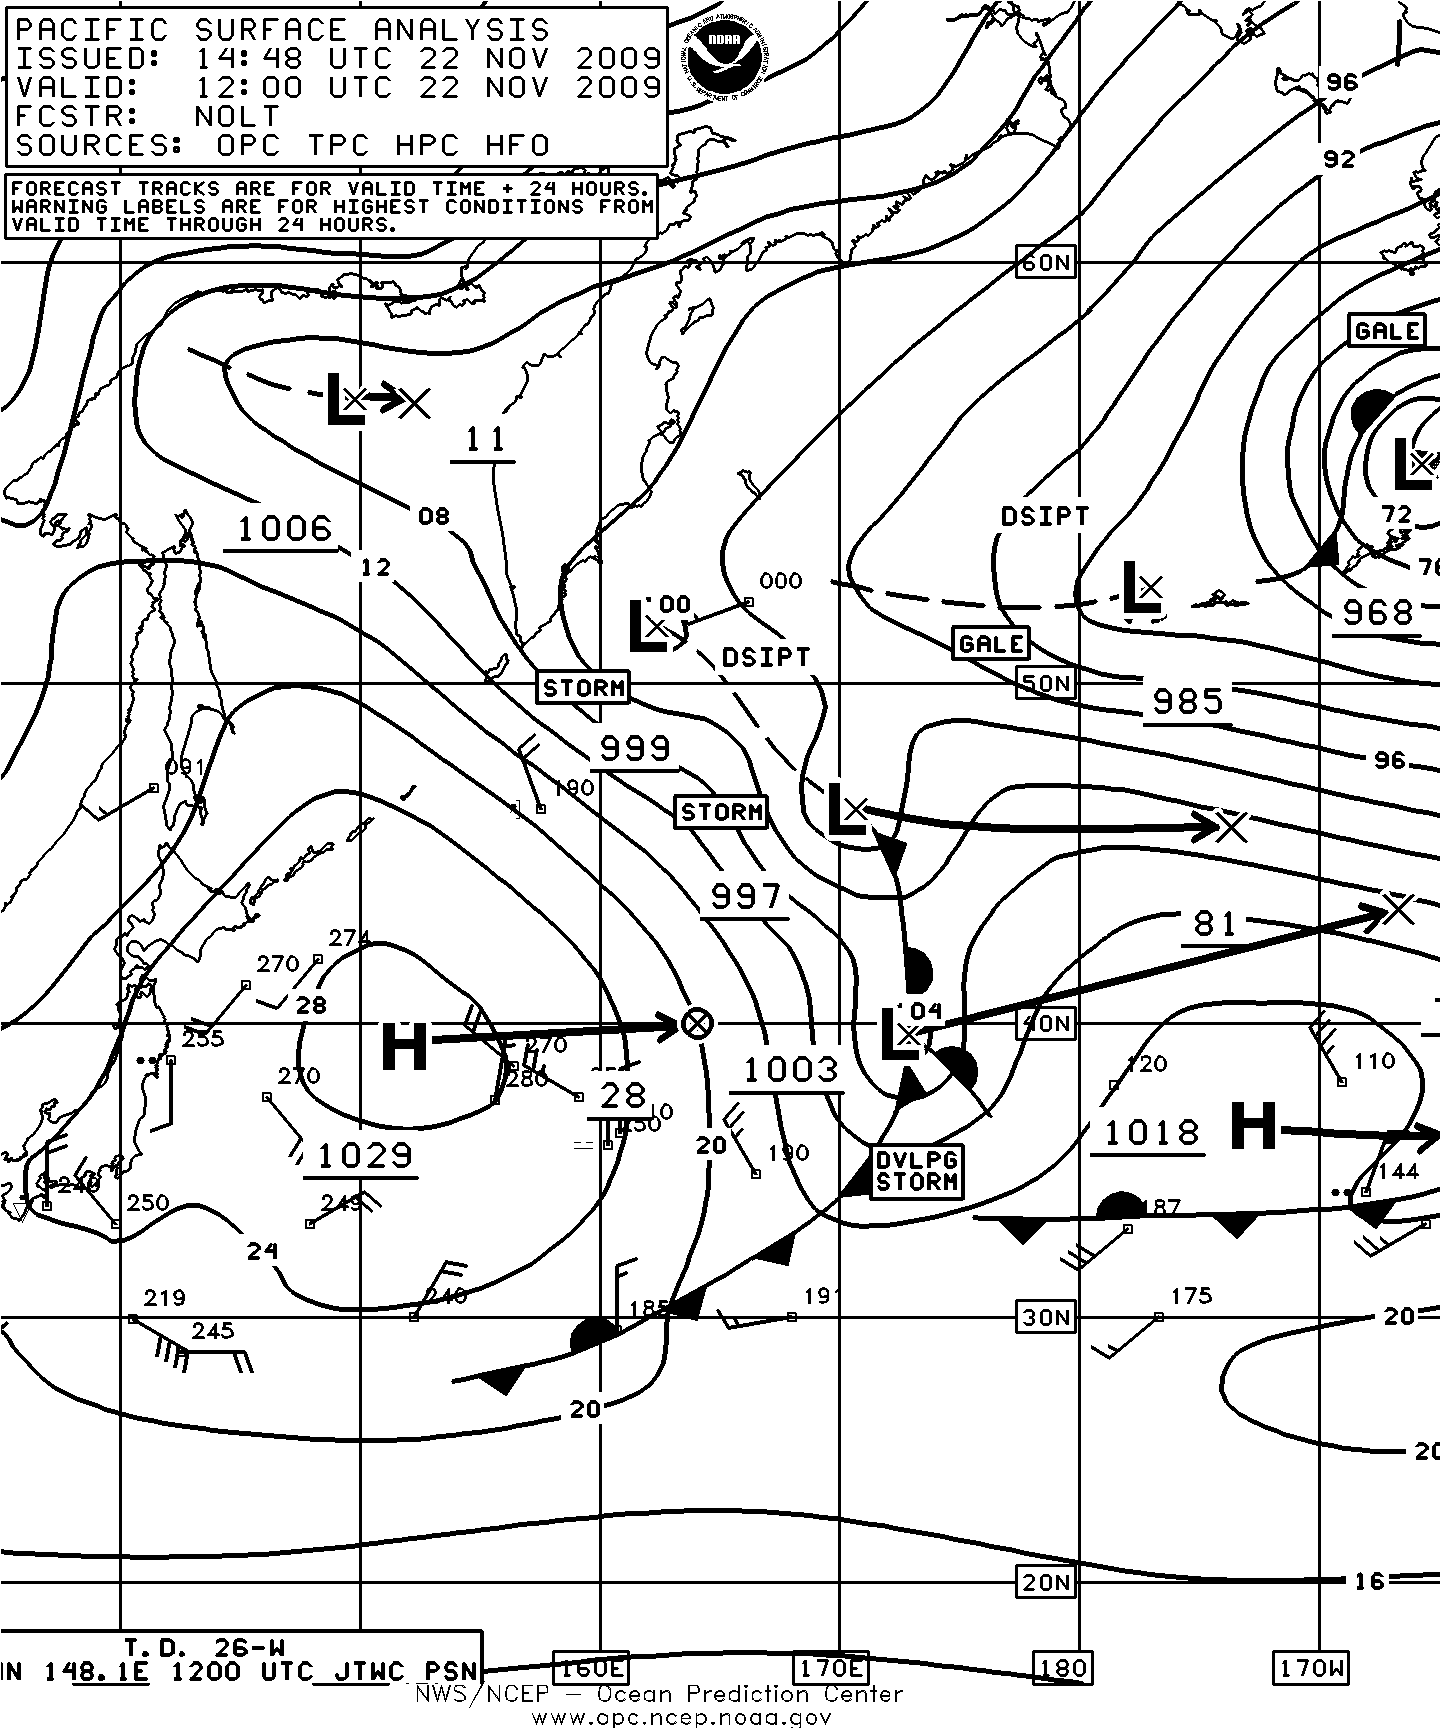
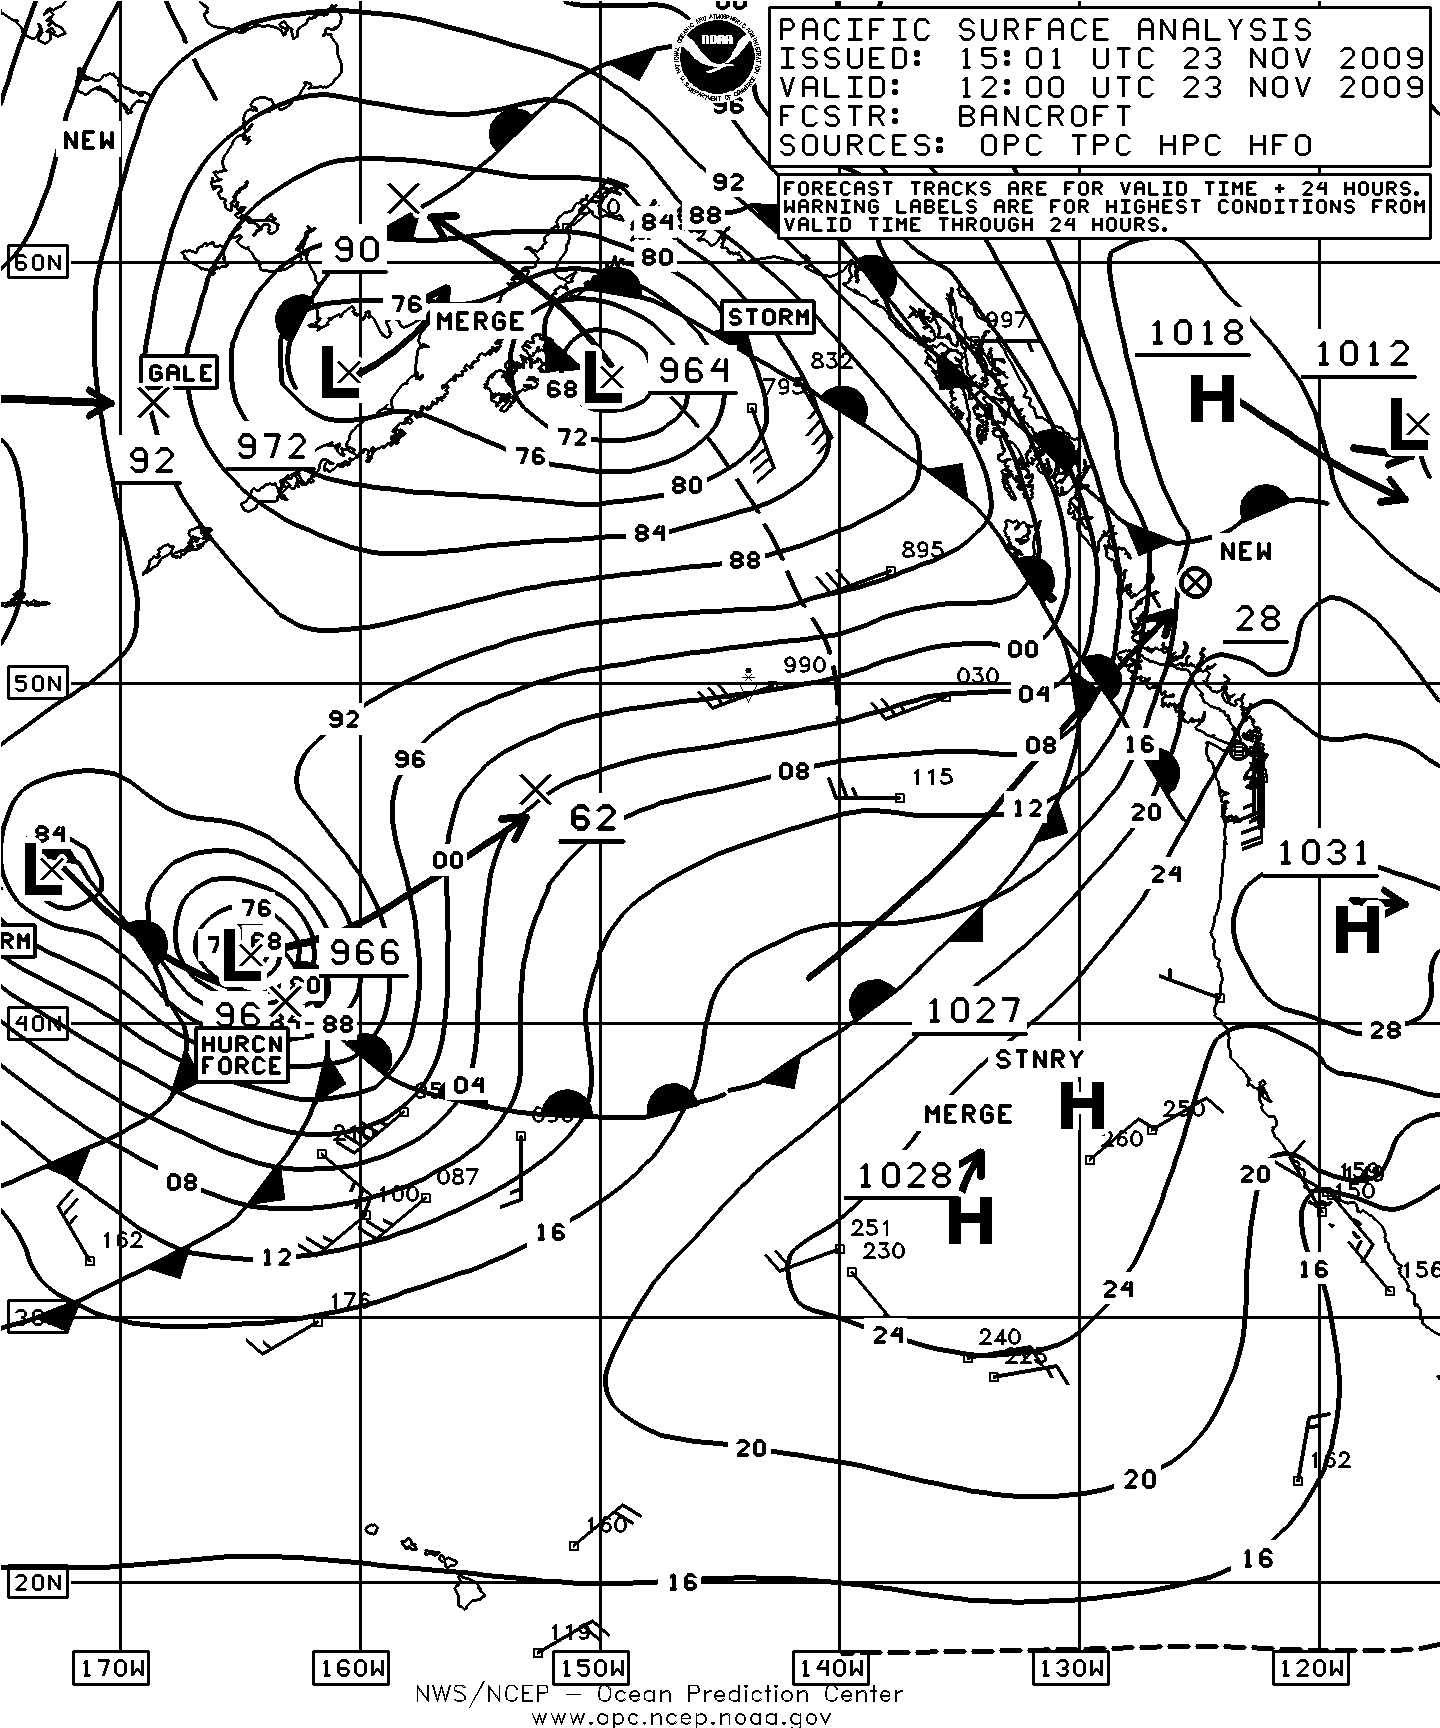
Figure 15. OPC North Pacific Surface Analysis charts valid 1200 UTC November 22 (Part 2) and 1200 UTC November 23, 2009.
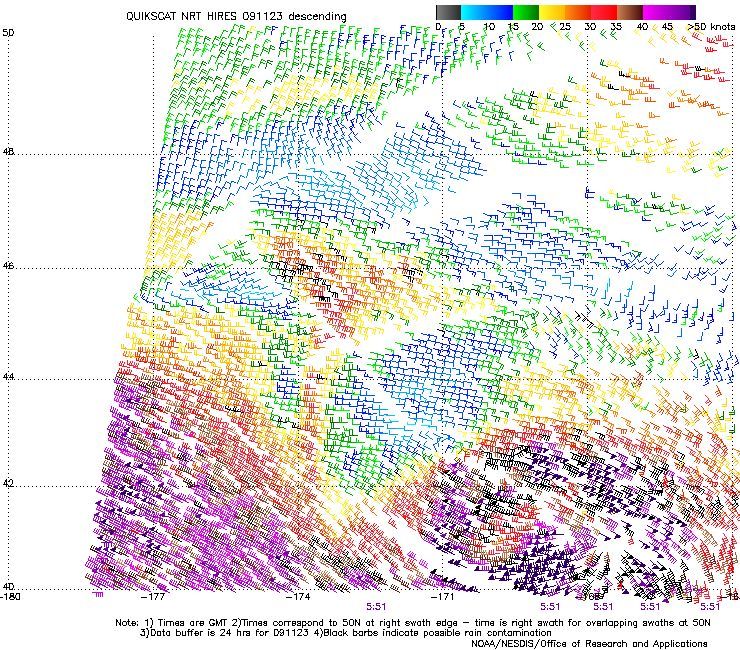
Figure 16. High-resolution QuikSCAT scatterometer image of satellite-sensed winds around the storm shown in the second part of Figure 15. The valid time of the pass is 0551 UTC November 23, 2009, or about six hours prior to the valid time of the second part of Figure 15. The center of the cyclone is on the lower right side of the image but is not well defined due to missing wind barbs. Image is courtesy of NOAA/NESDIS/ Office of Research and Applications.
North Pacific Storm, November 26-29: This cyclone originated near the southeast coast of Japan on November 24 and moved east-northeast over the next two days before turning northeast and rapidly intensifying into a hurricane-force low while passing 400 nmi south of the eastern Aleutian Islands early on the 27th. A pass from the European scatterometer ASCAT from near 0600 UTC on the 28th revealed an area of southwest winds to 55 KT on the south side of the cyclone which, due to low biases of ASCAT at such high wind speeds can mean hurricane force winds. Selected ship and buoy reports from this storm are listed in Table 5. The cyclone developed a maximum intensity of 965 hPa near 49N 158W at 0000 UTC on the 28th. The system then weakened and moved inland over south-central Alaska where it dissipated late on the 29th
| Observation | Position | Date/Time (UTC) | Wind | Seas (m/ft) |
|---|---|---|---|---|
| UHBN | 38N 174W | 26/0000 | SW 45 | 4.9/16 |
| Overseas Alcmar (V7HP3) | 44N 180W | 27/0600 | NW 35 | 9.8/32 |
| APL Philippines (WCX8884) | 41N 154W | 28/0000 | SW 40 | 9.4/31 |
| Buoy 46001 | 56.2N 148.3W | 28/1100 | E 35 | 3.7/12 |
| 28/2200 | Maximum | 7.9/ 26 | ||
| Buoy 46085 | 55.9N 142.6W | 28/2200 | S 40 | 7.6/25 |
| 29/0300 | Maximum | 11.0/36 | ||
| Buoy 46184 | 53.9N 138.9W | 29/0500 | SW 35 | 11.0/36 |
| Buoy 46083 | 58.2N 138.1W | 29/0700 | S 35 | 8.8/29 |
| 29/0800 | Maximum | 9.4/31 |
North Pacific and Bering Sea Storm, November 27-December 1: The cyclone originated near northern Japan late on November 26 and subsequent rapid development is depicted in Figure 17 with the cyclone shown at maximum intensity with a central pressure of 960 hPa. The central pressure fell 24 hPa in the twenty-four hour period ending at 0000 UTC on the 29th. A 50-km ASCAT pass (Figure 18) from near the valid time of the second part of Figure 17 reveals winds to 55 KT both on the north side in the easterly flow and in the westerly flow on the south side of the cyclone near the western Aleutians. This could support hurricane force winds of 65 or 70 KT and the hurricane force label appearing in the second part of Figure 17. The Ice Star (OUJK2) near 38N 176E reported south winds of 45 KT and 6.4-meter seas (21 feet) at 0000 UTC on the 29th. The Busan Express (DCPX2) encountered east winds of 40 KT and 8.5-meter seas (28 feet) near 52N 168E at that time. The cyclone subsequently turned east and weakened, with its winds weakening to gale force when passing near the eastern Aleutians early on December 1, and then moved north along the Bering coast of Alaska. The low dissipated near the Bering Strait late on December 3.
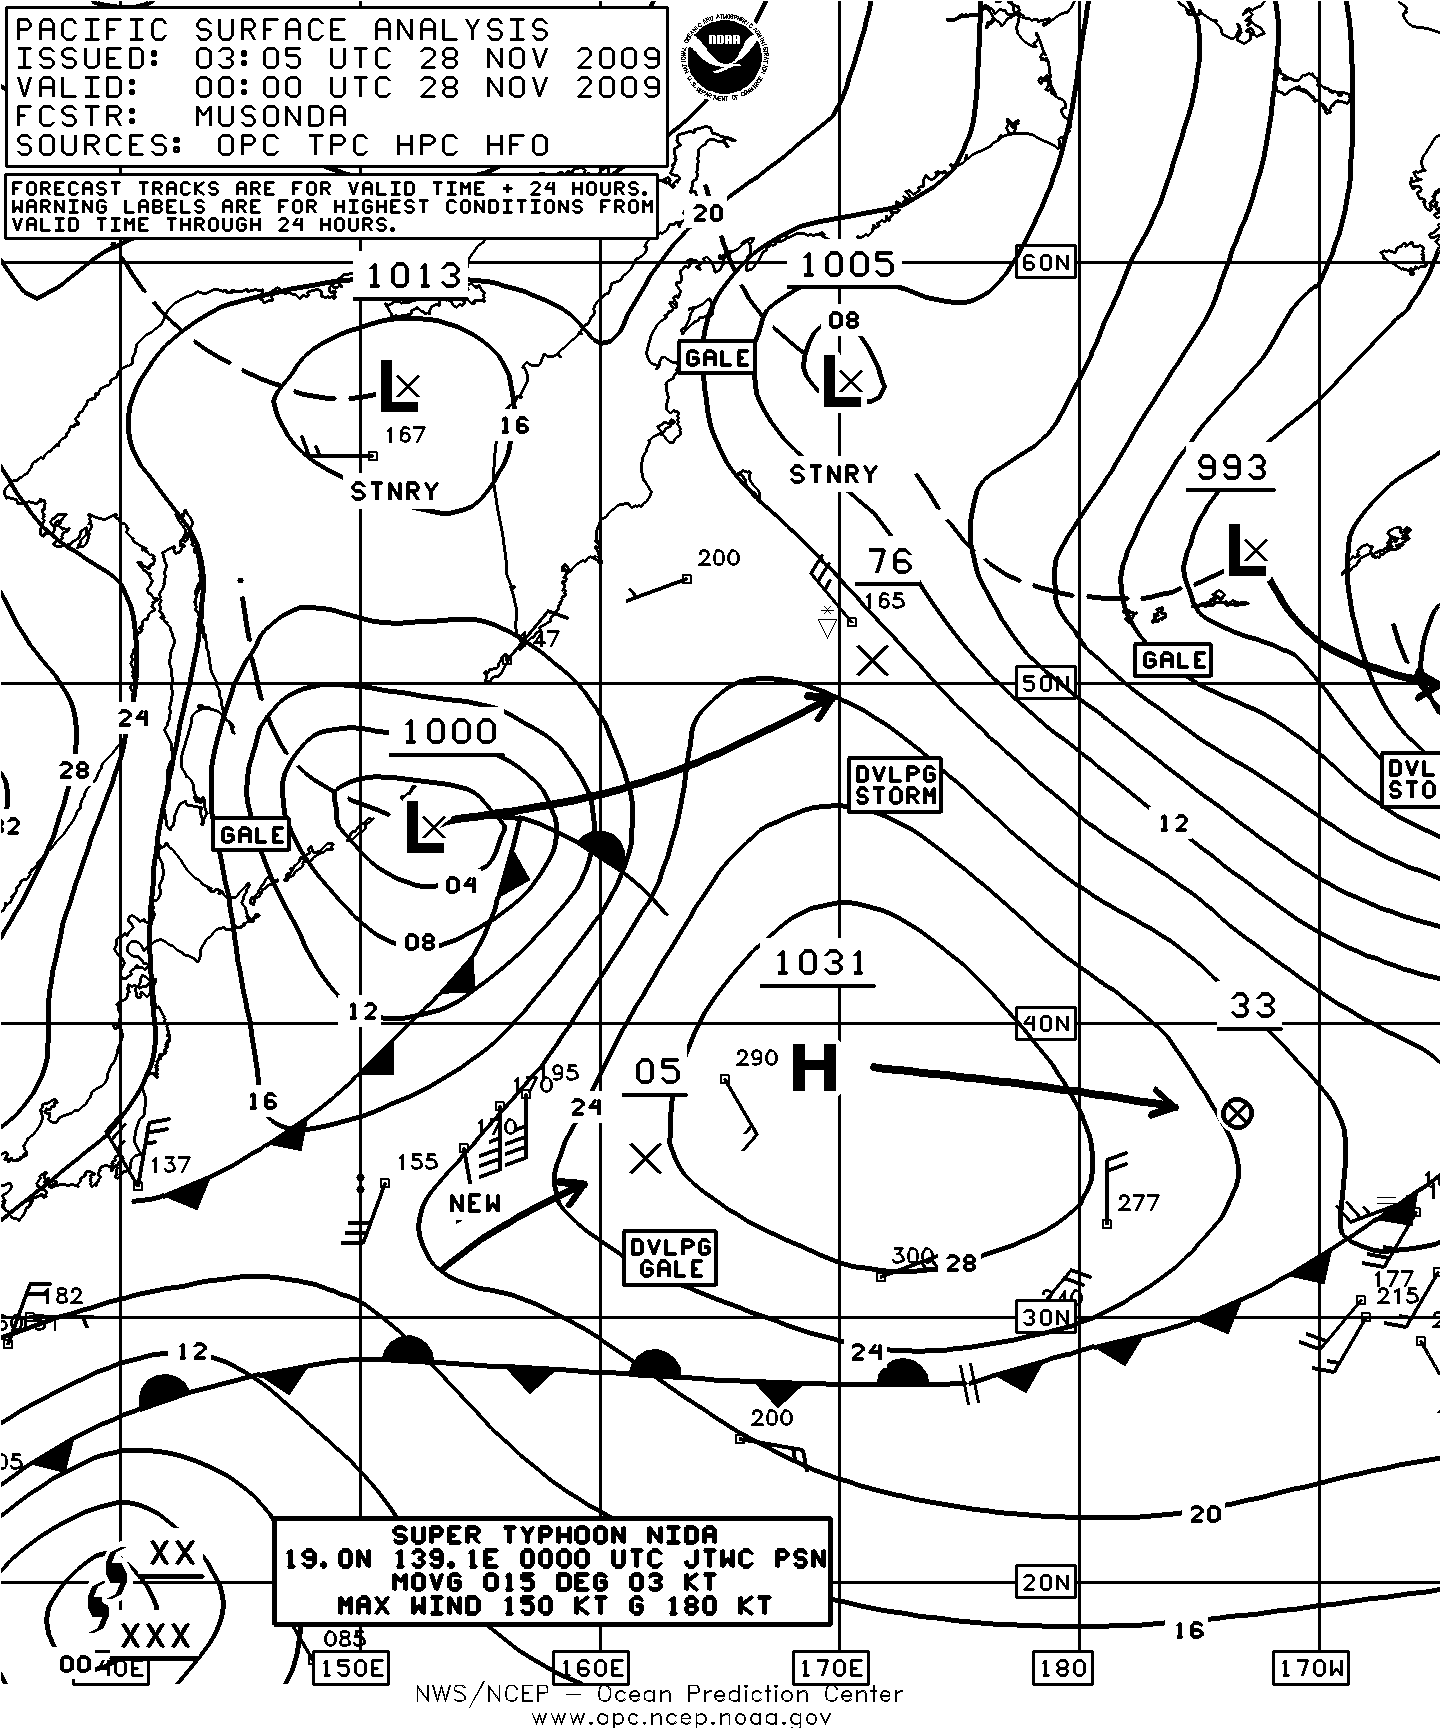

Figure 17. OPC North Pacific Surface Analysis charts (Part 2) valid 0000 UTC November 28 and 30, 2009.
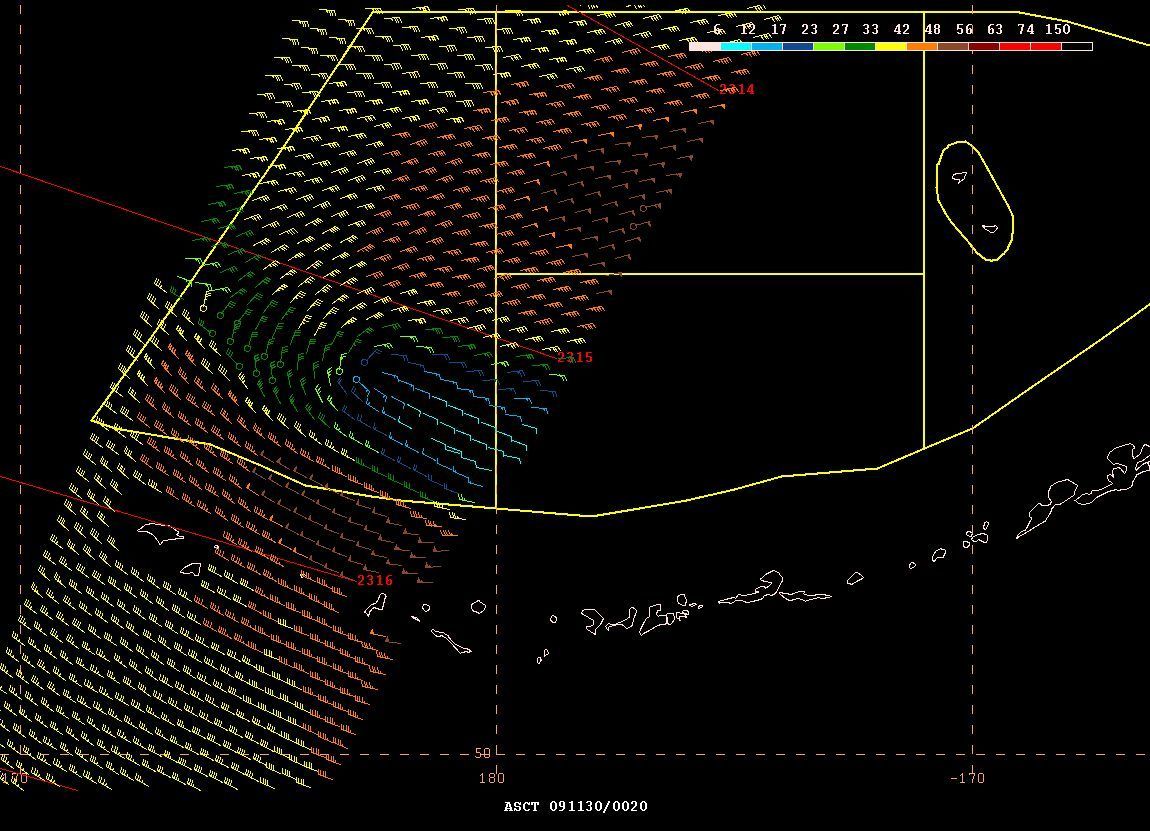
Figure 18. ASCAT (Advanced Scatterometer) image of satellite-sensed winds around primarily the north and west sides of the storm shown in the second part of Figure 17. The resolution is 50 km in this version. The valid time of the pass is approximately 2315 UTC November 29, 2009, or less than one hour prior to the valid time of the second part of Figure 17. The center of the cyclone at the time was in the data-free nadir swath to the east over which the satellite passes, north of the Aleutian Islands. This version of imagery, adapted for OPC operational use, includes numbered cross-track time lines of the satellite.
North Pacific and Bering Sea storms, December 2 to 6: Late November and early December was the most active period in the North Pacific, and Figures 19 and 20 show the development of three cyclones that produced hurricane force winds. The first one, the 960-hPa cyclone in the central waters (Figure 19) originated east of Japan near 154E late on November 30. The central pressure dropped 32 hPa in the twenty-four hour period ending at 0600 UTC on the 3rd. The cyclone maintained hurricane force winds until early on the 4th when the center approached the central Aleutians and began to weaken. The system then turned more westward in the southern Bering Sea and dissipated early on the 5th. Meanwhile a new low formed on the front trailing from the aforementioned cyclone, near 37N 162W at 1800 UTC December 3 and moved north then northwest while intensifying (Figure 20), with its winds increasing to storm force twelve hours later and to hurricane force in the southern Bering Sea near the central Aleutian Islands early on the 5th. The lowest central pressure was 952 hPa near 54N 180W at 1200 UTC on the 5th. The system then rapidly weakened while moving northwest in the Bering Sea with dissipation following on the 6th in the northwest Bering Sea. A third cyclone that formed about the same time just south of Japan is shown over the central waters in Figure 20. Figure 20 actually shows all three with the first drifting west in the Bering Sea, the second approaching the central Aleutians and the third moving east over the central waters. This third cyclone became the deepest of the three and developed the strongest winds. The lowest central pressure reached was 948 hPa with the center near 42N 174W at 1200 UTC on the 5th making it the third deepest of the period. Hurricane force winds lasted from early on the 4th until early on the 6th. The drifting buoy 21537 near 41.5N 174.9W reported a pressure of 949.0 hPa at 1200 UTC on the 5th. ASCAT imagery from early on the 5th with a wider view of the Pacific (Figure 21) shows the strongest winds with the southern cyclone with a large area of 42 to 56-KT winds. The swath of 42 to 50 KT south to southeast winds across the eastern Aleutians is associated with the second system approaching the central Aleutians in Figure 20. A Jason-1 satellite altimeter pass from 2200 UTC on the 5th (Figure 22) shows a swath through the southwest side of the southern hurricane-force low with the values along the track all 30 feet (9.0 meters) or above. The highest value is 41 feet (12.5 meters) in the upper part of the image. This system turned northeast and then northwest on the 6th with a weakening trend and dissipated in the southern Bering Sea late on the 7th. Other reports from ships and buoys are listed in Table 6.
| Observation | Position | Date/Time (UTC) | Wind | Seas (m/ft) |
|---|---|---|---|---|
| Polar Spirit (C6WL6) | 55N 169W | 05/1200 | SE 50 | |
| Chirikana (3EKU3) | 54N 163W | 06/0000 | SE 60 | |
| OOCL China (VRWE8) | 47N 156W | 04/0600 | SE 45 | |
| A8PW8 | 29N 176E | 05/0000 | SW 40 | 7.3/24 |
| CSCL Fos (V2OH6) | 28N 169W | 06/0000 | W 40 | 8.5/28 |
| San Francisco Express (DCPP2) | 54N 157W | 07/1200 | SE 50 | |
| Buoy 46066 | 52.7N 155W | 04/2100 | SE 35 G47 | 8.0/26 |
| 06/2300 | SE 35 G47 | 8.5/28 | ||
| 07/1000 | Maximum | 9.5/31 | ||
| Buoy 46075 | 53.9N 160.8W | 05/0000 | SE 45 G54 | 9.5/31 |
| 05/0100 | Maximum | 10.0/33 | ||
| 06/2100 | SE 41 G54 | 9.0 | ||
| 07/0300 | Maximum | 10.5/34 | ||
| Buoy 46073 | 55.0N 172.0W | 04/0500 | NE 47 G58 | 5.5/18 |
| Maximum | 6.5/21 | |||
| Buoy 46035 | 57.1N 177.8W | 04/1600 | NE 43 G52 | 6.5/21 |
| 04/1800 | Peak gust 56 | 9.0/30 |
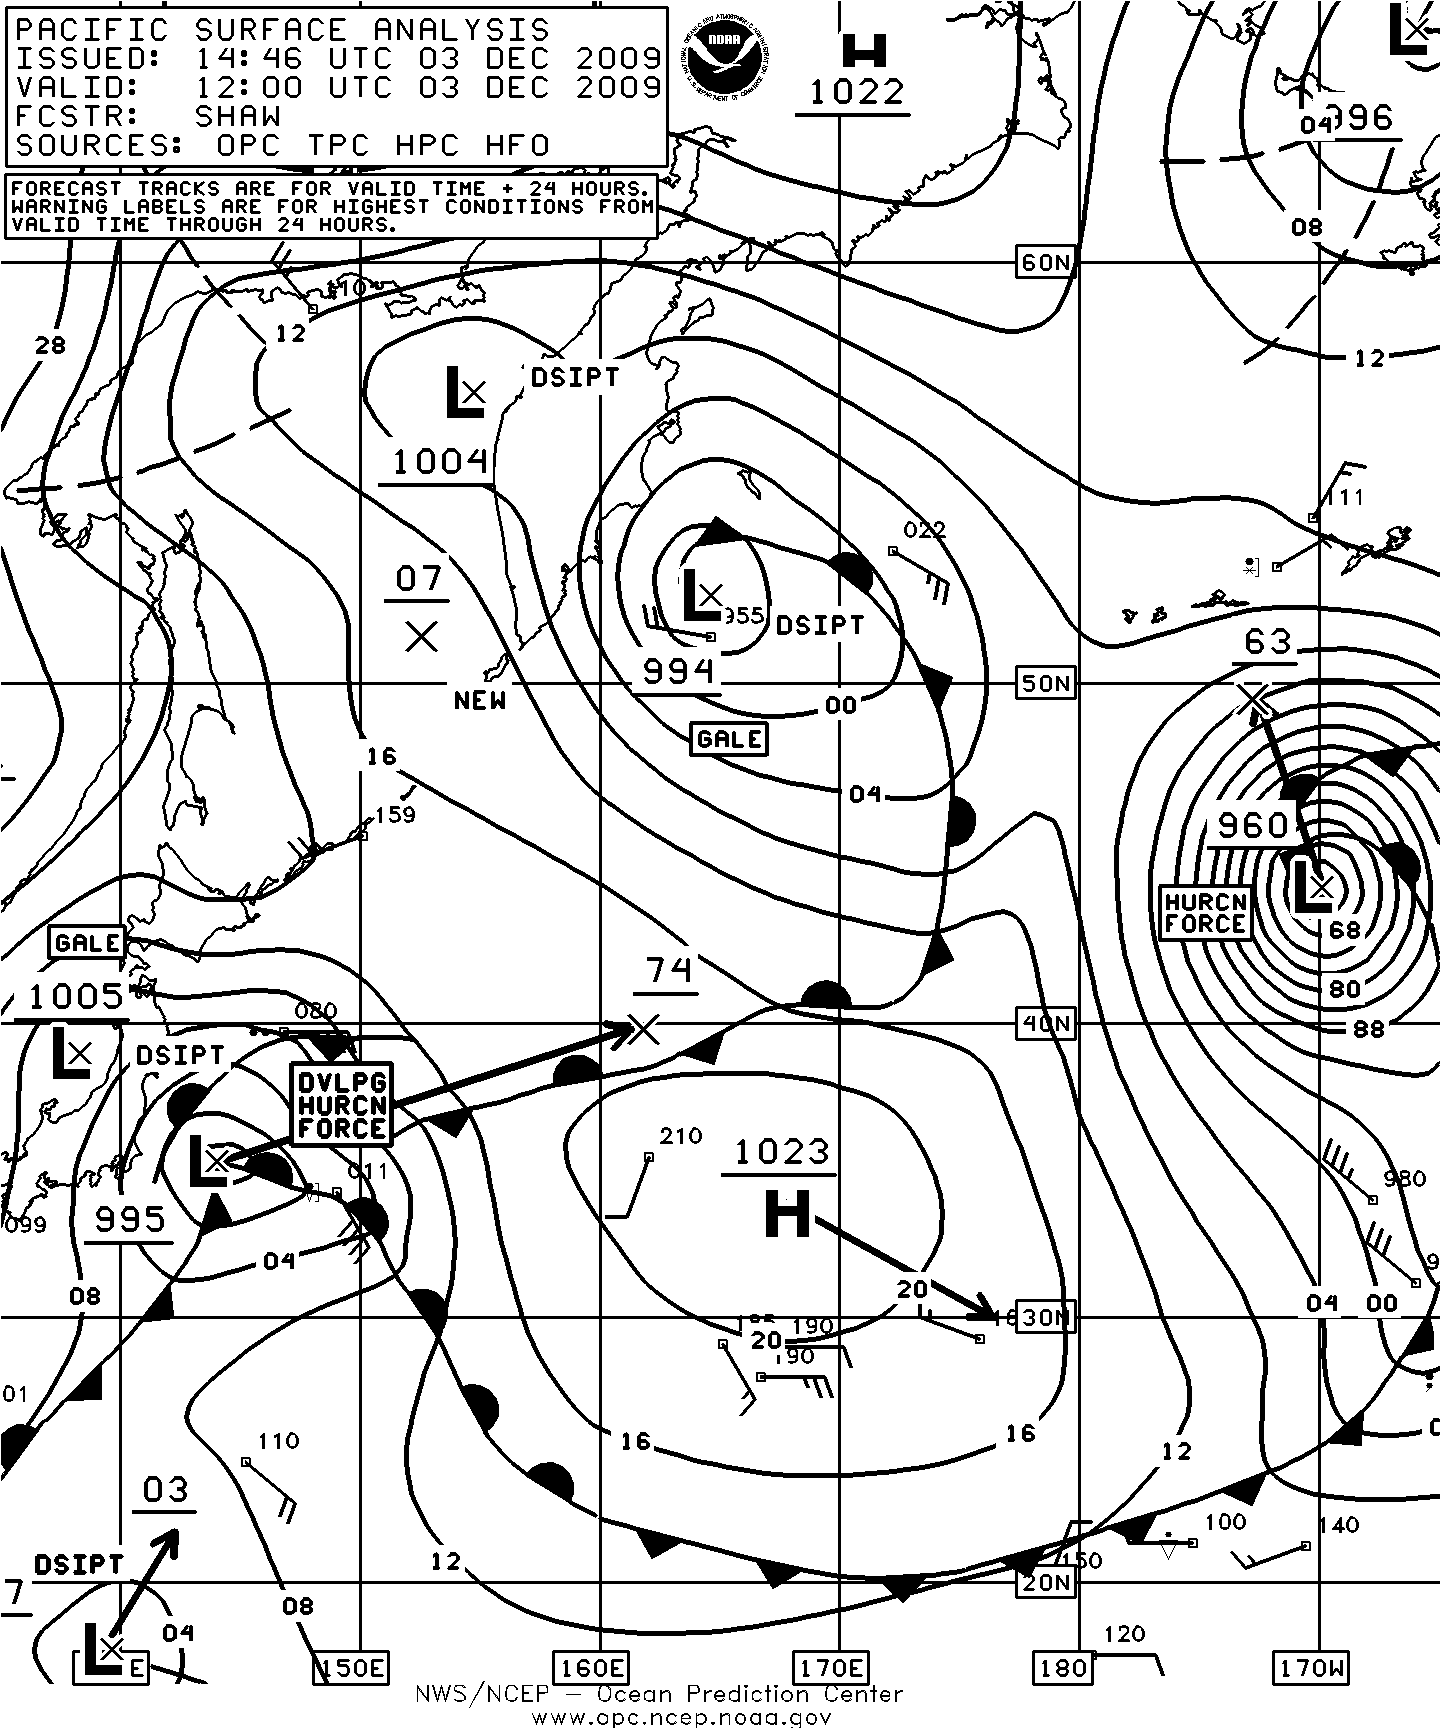
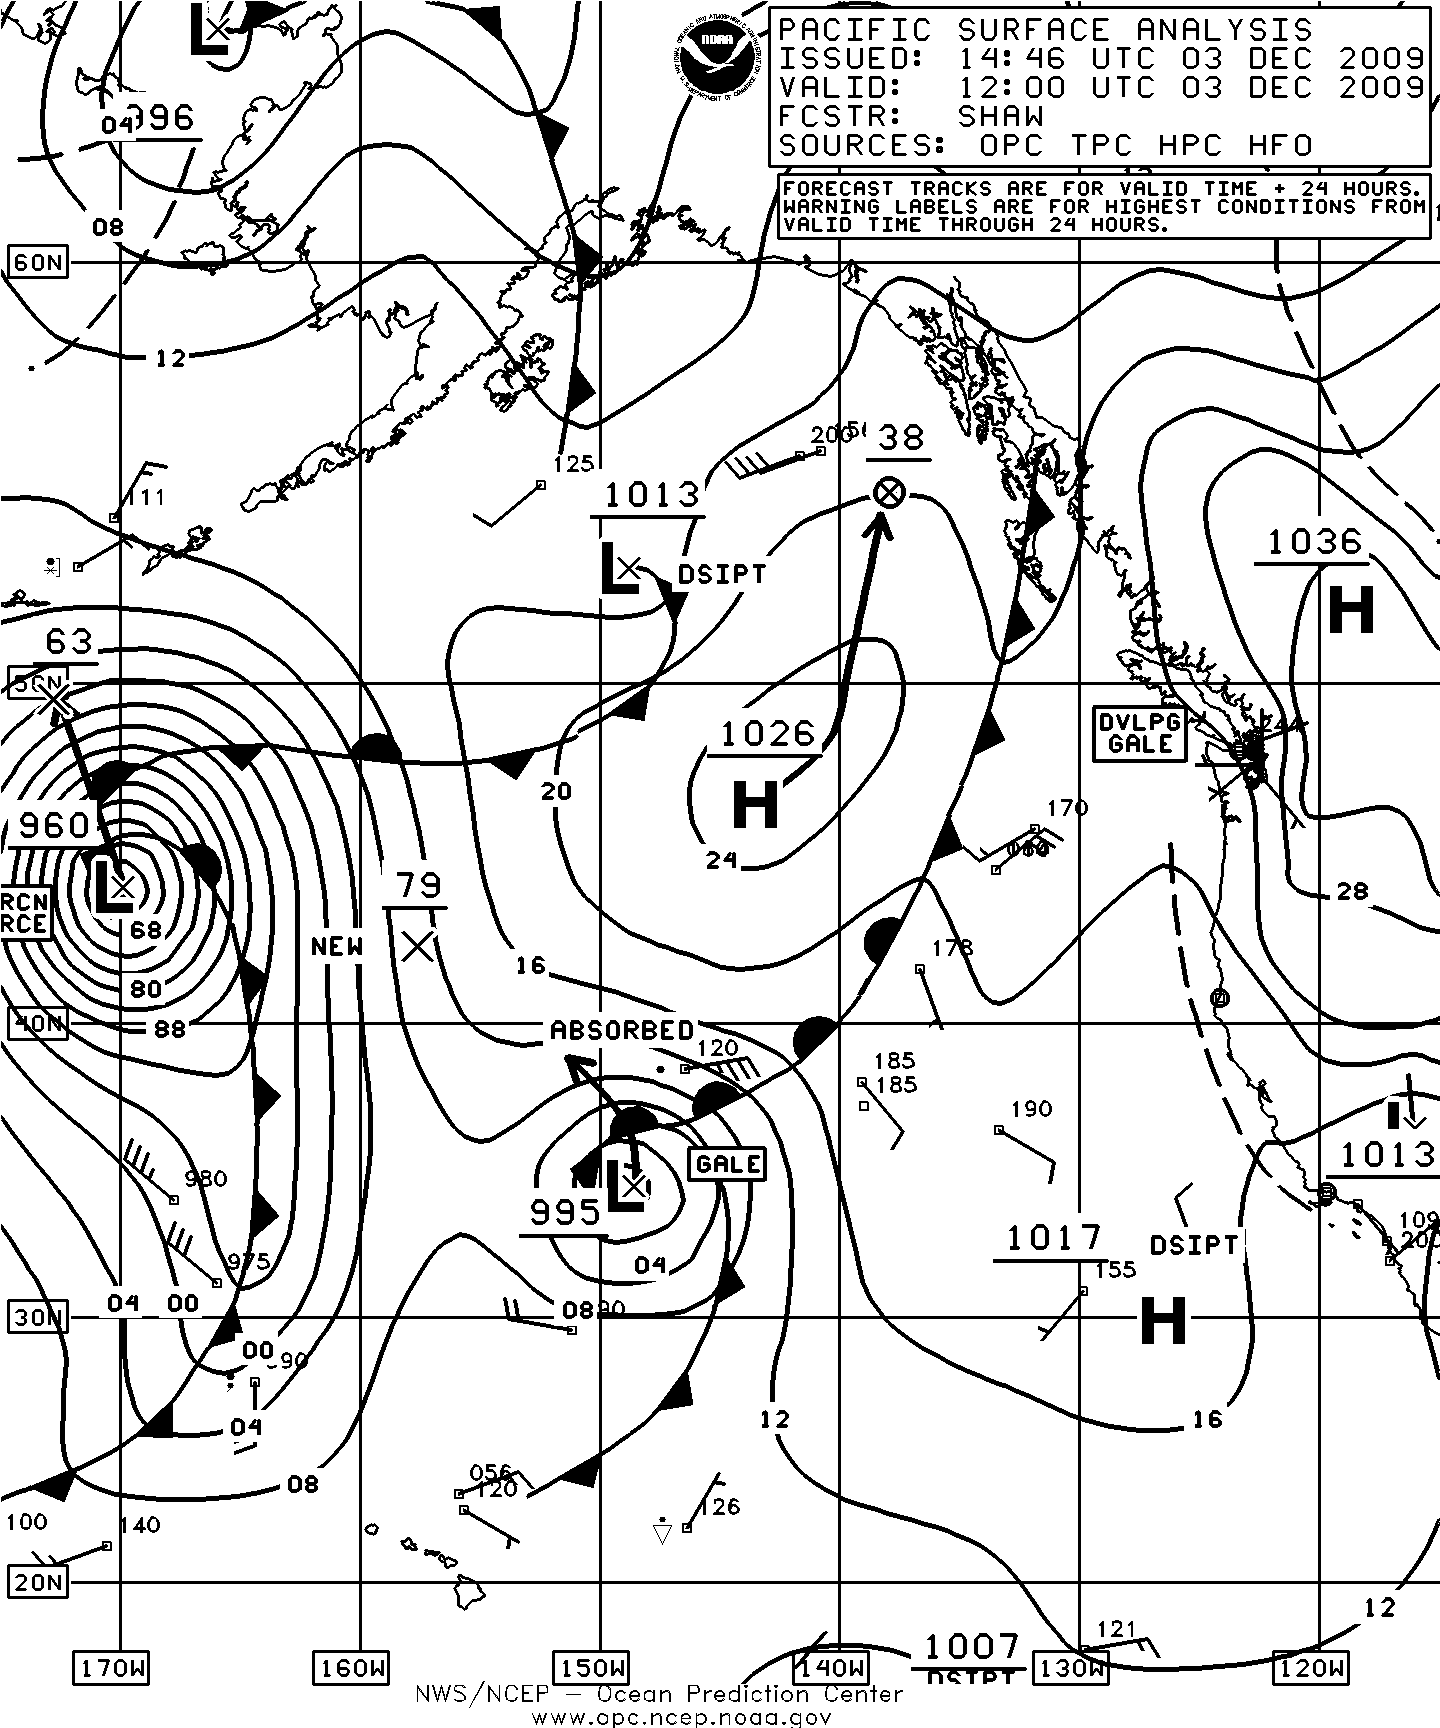
Figure 19. OPC North Pacific Surface Analysis charts (Parts 1 and 2) valid 1200 UTC December 3, 2009. The two parts include an overlap area between 165W and 175W.
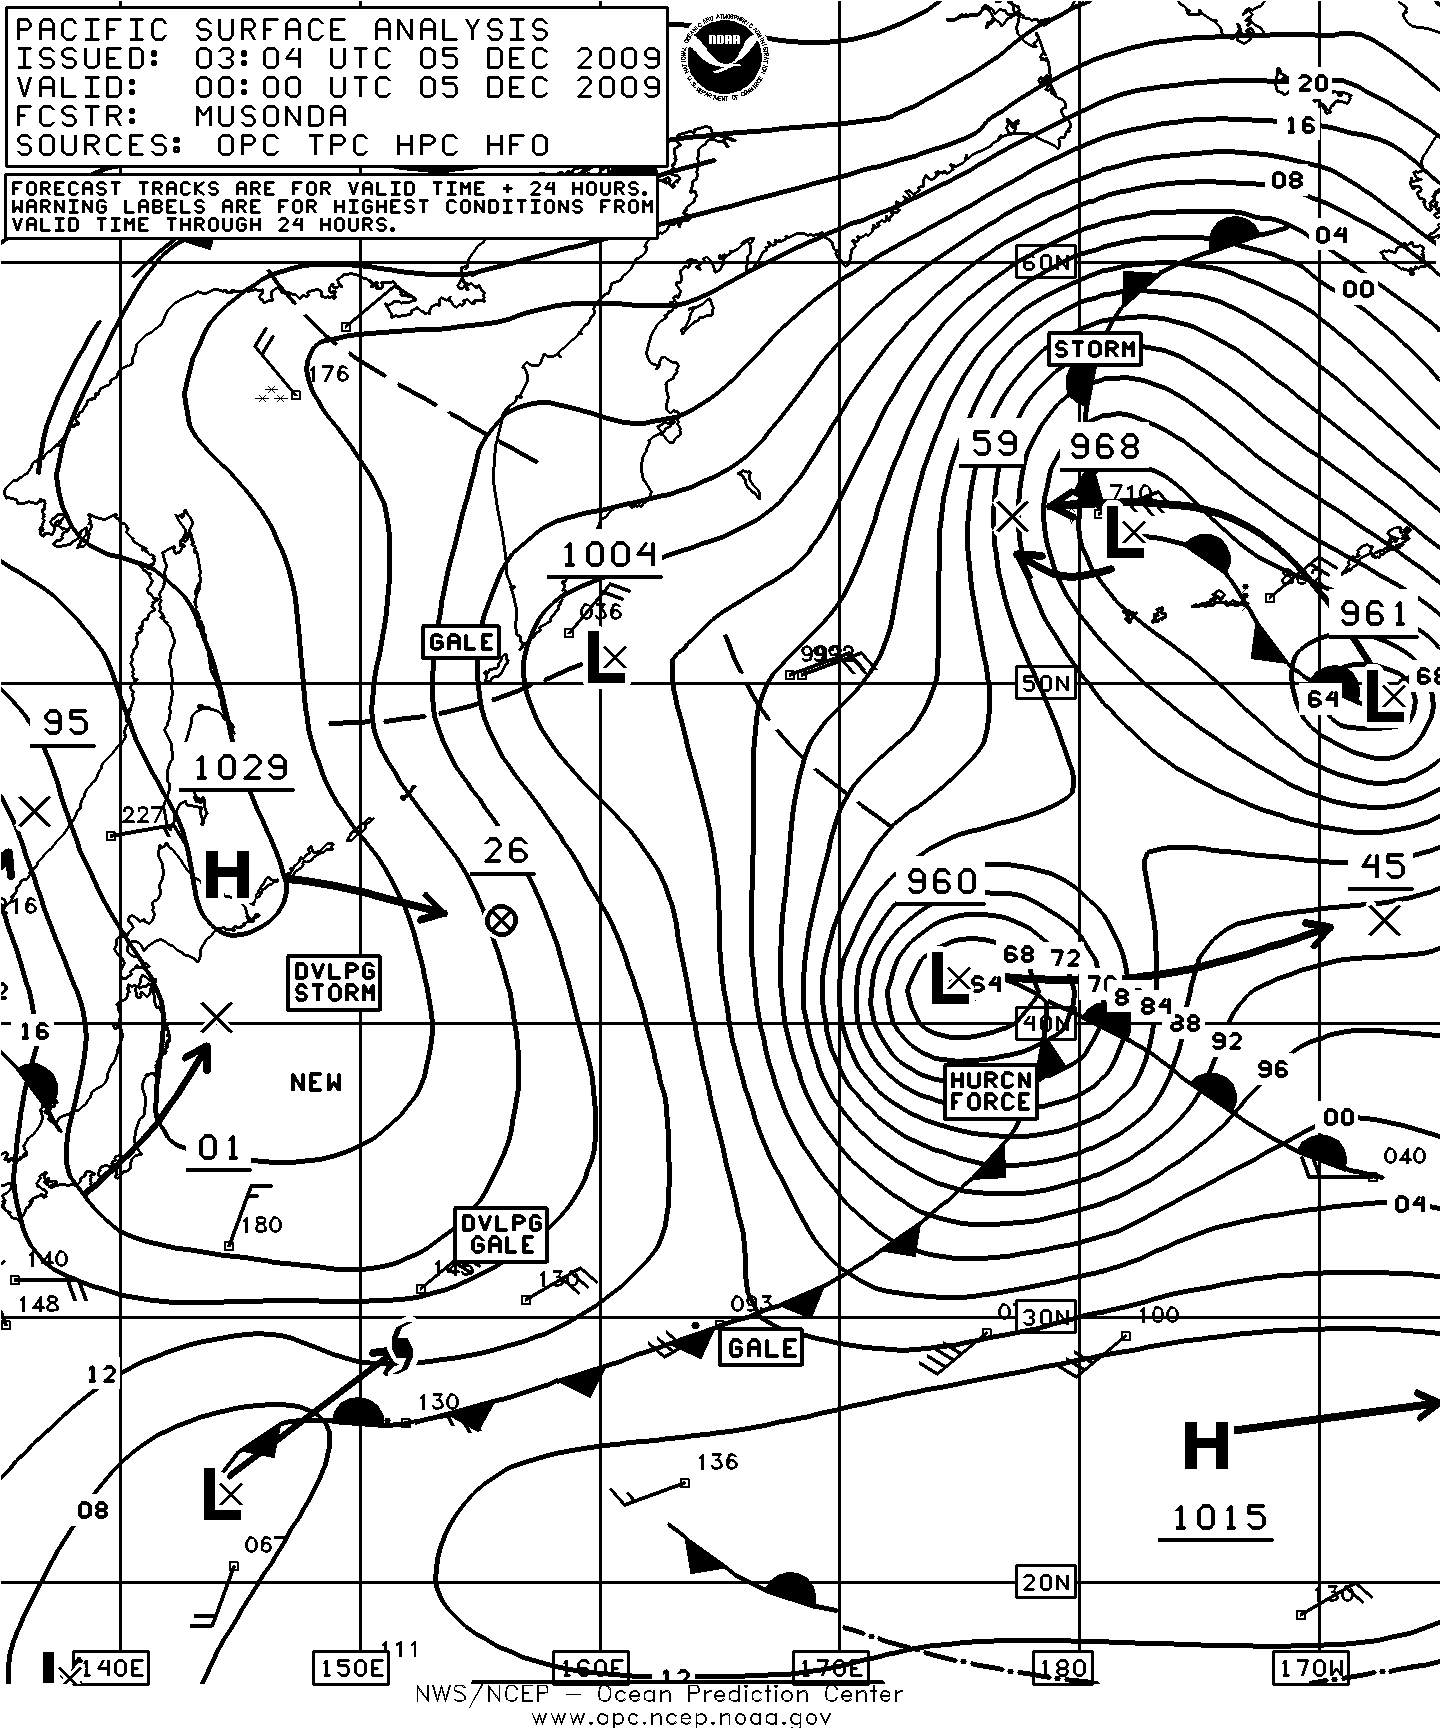
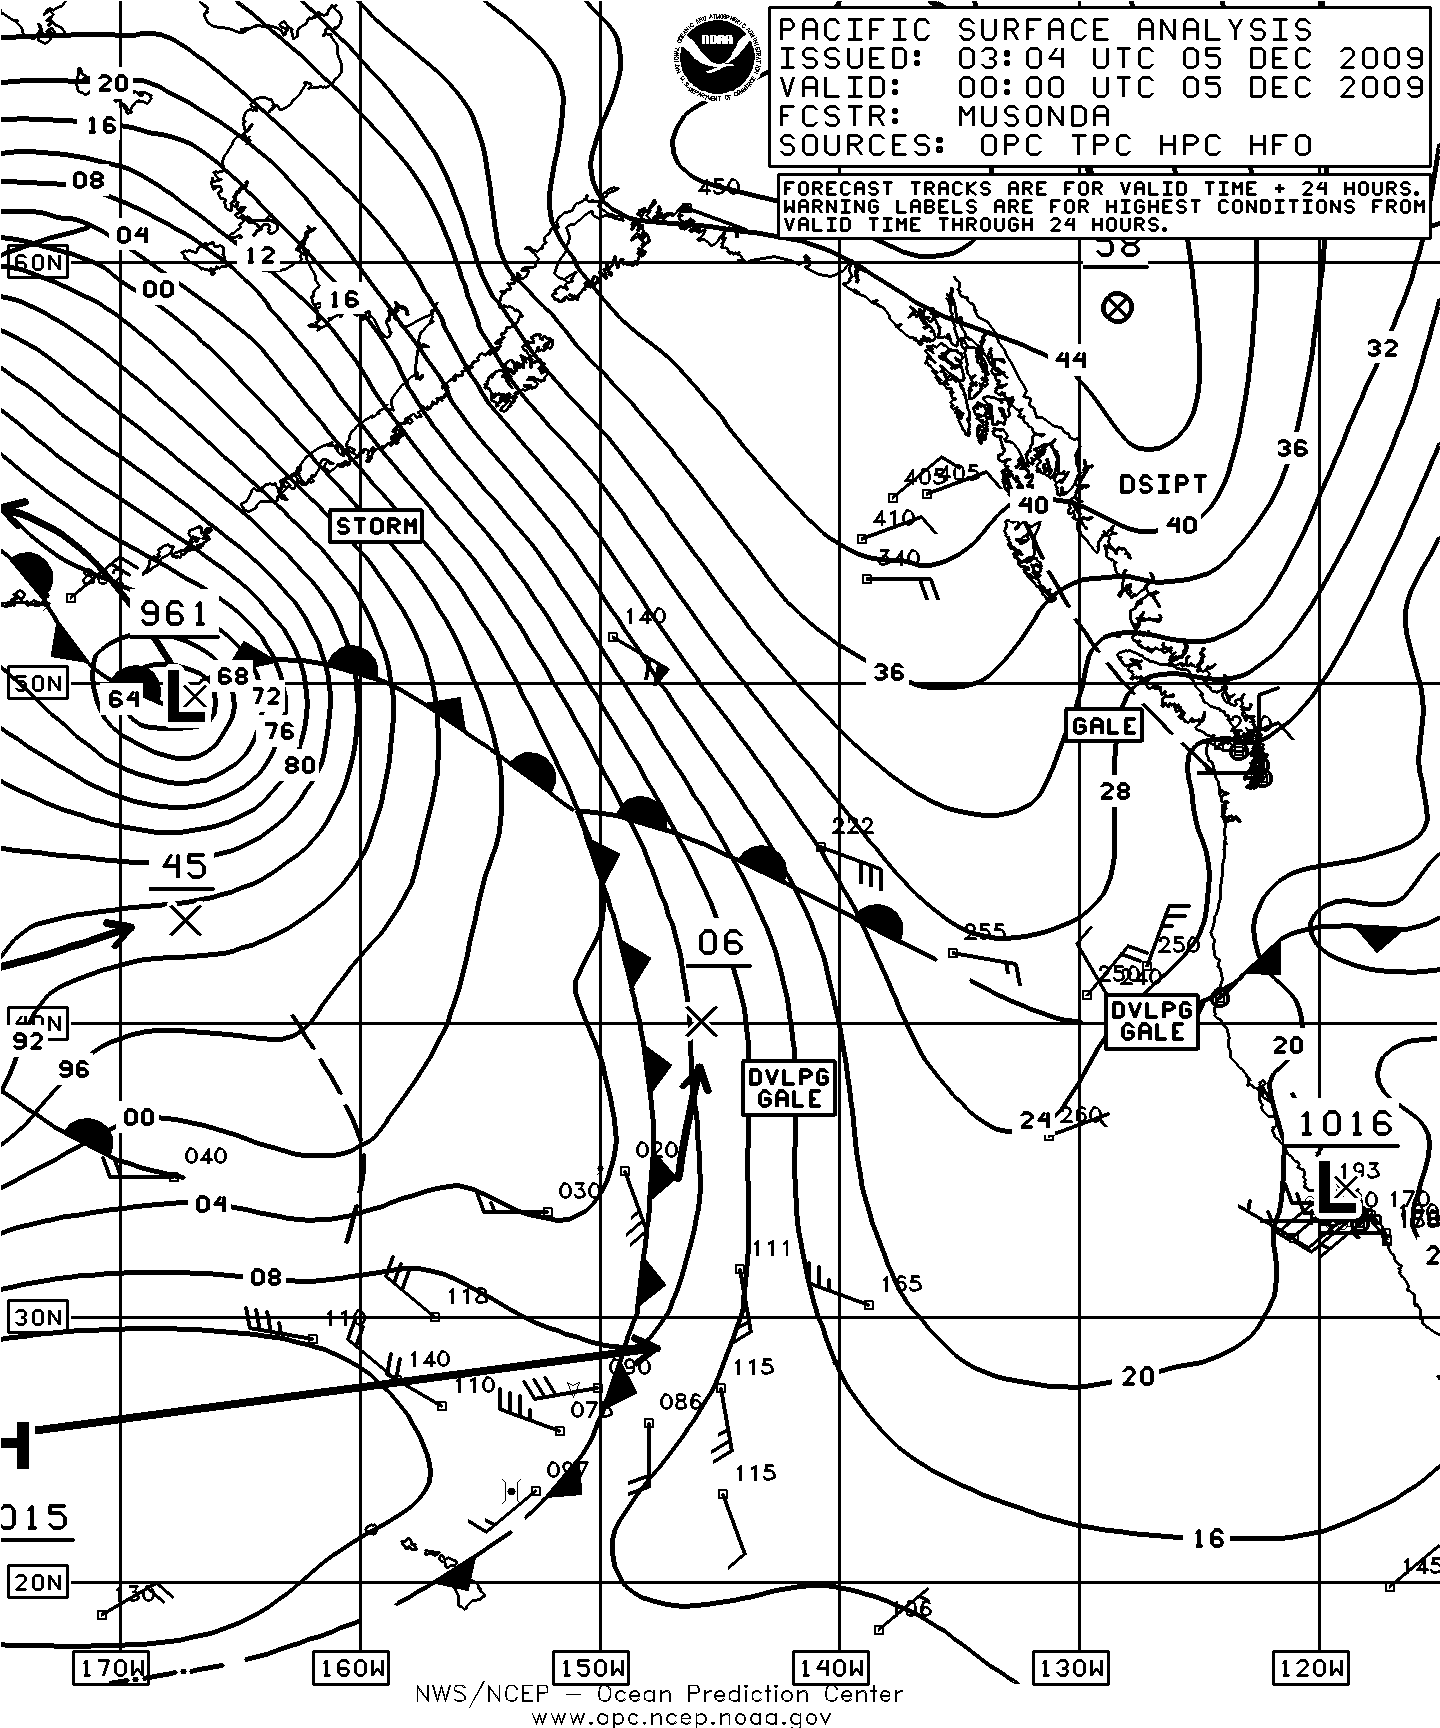
Figure 20. OPC North Pacific Surface Analysis charts (Parts 1 and 2) valid at 0000 UTC December 5, 2009.
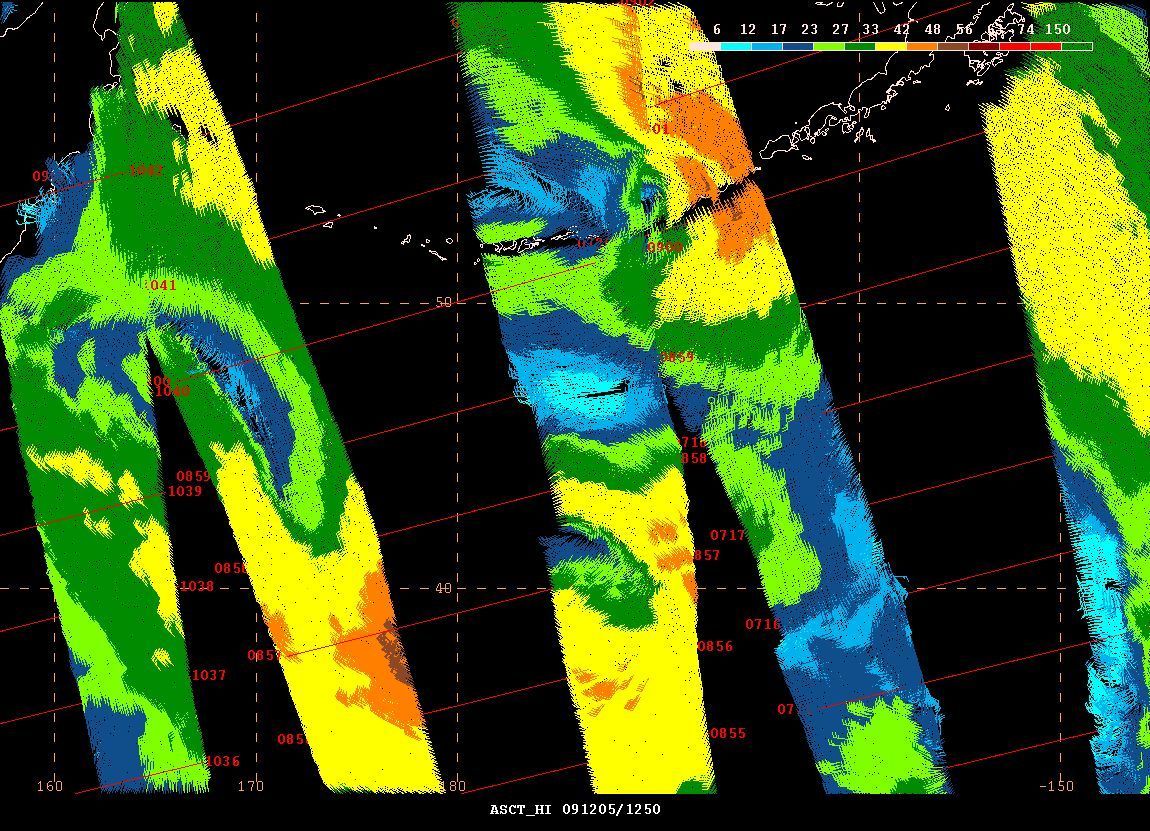
Figure 21. High-resolution ASCAT (Advanced Scatterometer) image of satellite-sensed winds over a large portion of the North Pacific showing portions of four passes along with cross-track time lines of the satellite. The resolution is 25 km versus 50 km in the other version of the imagery such as in Figure 18. The satellite scans in parallel 550 km wide swaths separated by a nadir swath with overlap of passes appearing north of about 48N. Satellite times range approximately from 0700 to 1100 UTC December 5, 2009 or within 7 to 11 hours after the valid time of Figure 20. The red areas or green within red denote areas of stronger winds in the 42 to 56-kt range according to a color scale in the upper right.
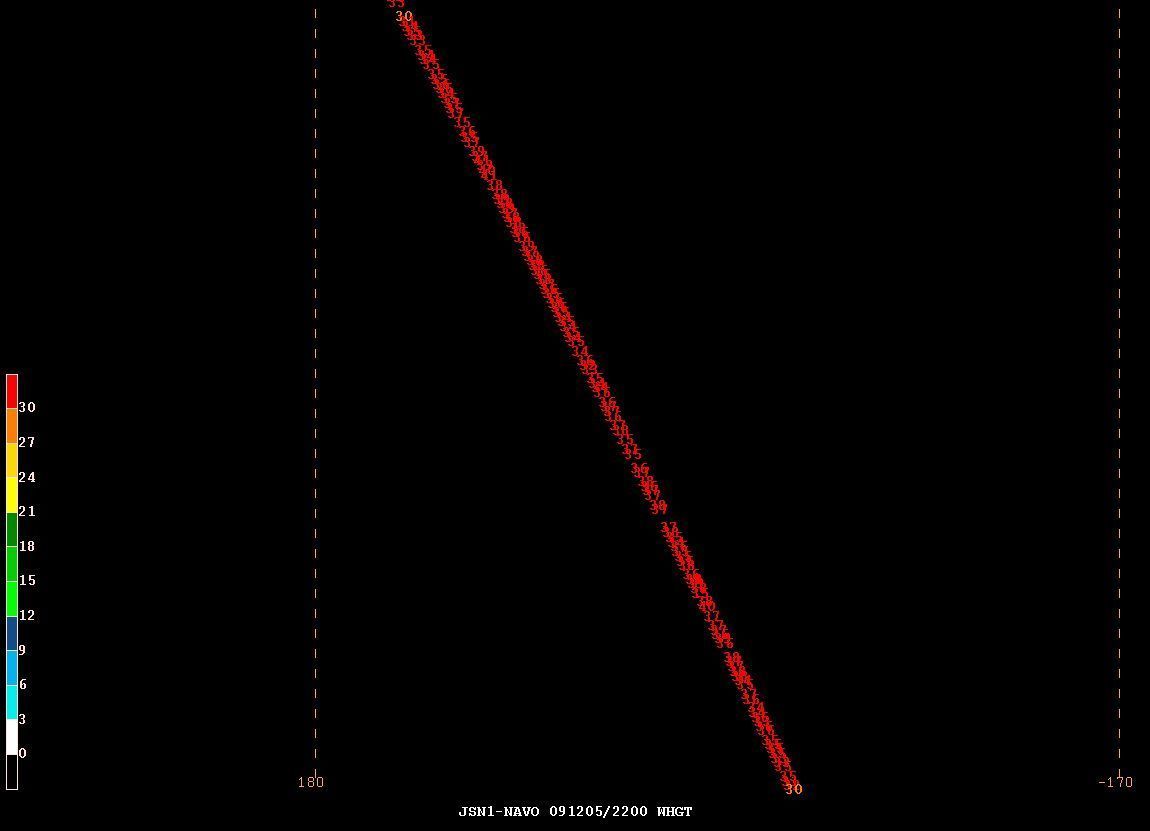
Figure 22. Jason-1 satellite altimeter pass from 2200 UTC December 5, 2009 across an area from 30N to 40N between 174W and 179W. At this time the southern hurricane-force low shown in Figure 20 was near 42N 169W with a central pressure down near 948 mb, or just off the upper right corner of the image. Observed wave heights in whole feet are shown along the track of the satellite.
North Pacific Storm, December 16-21: This cyclone originated south of Japan near 30N late on December 15 and moved northeast while rapidly intensifying late on the 16th and the 17th with the central pressure dropping 30 hPa in the twenty-four hour period ending at 1200 UTC on the 17th when the center was at 43N 168E with a 974-hPa pressure. The system turned more north and approached the western Aleutian Islands early on the 18th with a lowest central pressure of 952 hPa and was similar to the North Pacific/Bering storm of late November. High latitude blocking forced the cyclone to stall near the western Aleutians with its top winds lowering to storm force late on the 18th . The slowly weakening cyclone then moved east-southeast and dissipated south of the eastern Aleutians late on the 21st.
North Pacific Storms, December 21-26:Figure 23 depicts the development of two strong cyclones and implies the formation of another east of Japan in twenty-four hours. In the first part of Figure 23 the hurricane-force low 44N 162E originated near northern Japan early on the 20th and briefly developed hurricane force winds around 0600 UTC on the 22nd. As shown in Figure 23 the secondary development on the front became a hurricane-force low as shown in the second part of Figure 23 as the first cyclone became absorbed shortly thereafter. In Figure 24 even the coarser-resolution 50-km ASCAT imagery shows a 50 KT wind retrieval on the south side of the first hurricane-force low and the circulation near the southeast corner is the secondary low. After briefly developing hurricane-force winds early on the 23rd the secondary low stalled 500 nmi south of the eastern Aleutians late on the 23rd and the 24th before moving east and then northeast and weakening. Dissipation followed by the 27th near Kodiak Island. The Zim California (4XIS) near 38N 157W reported south winds of 50 KT and 11.9-meter seas (39 feet) at 0600 UTC on the 23rd. The Sea-Land Comet (WDB9950) encountered northeast winds of 45 KT and 9.4-meter seas (31 feet) near 45N 167W six hours later. The third development implied by the twenty-four hour forecast track in the second part of Figure 23 became a compact cyclone by 0600 UTC on the 25th 44N 173E with a central pressure as low as 979 hPa and briefly developing hurricane-force winds. The low then weakened while drifting east with its winds diminishing to gale force early the next day. Dissipation followed 600 nmi south of the eastern Aleutian Islands late on December 27.
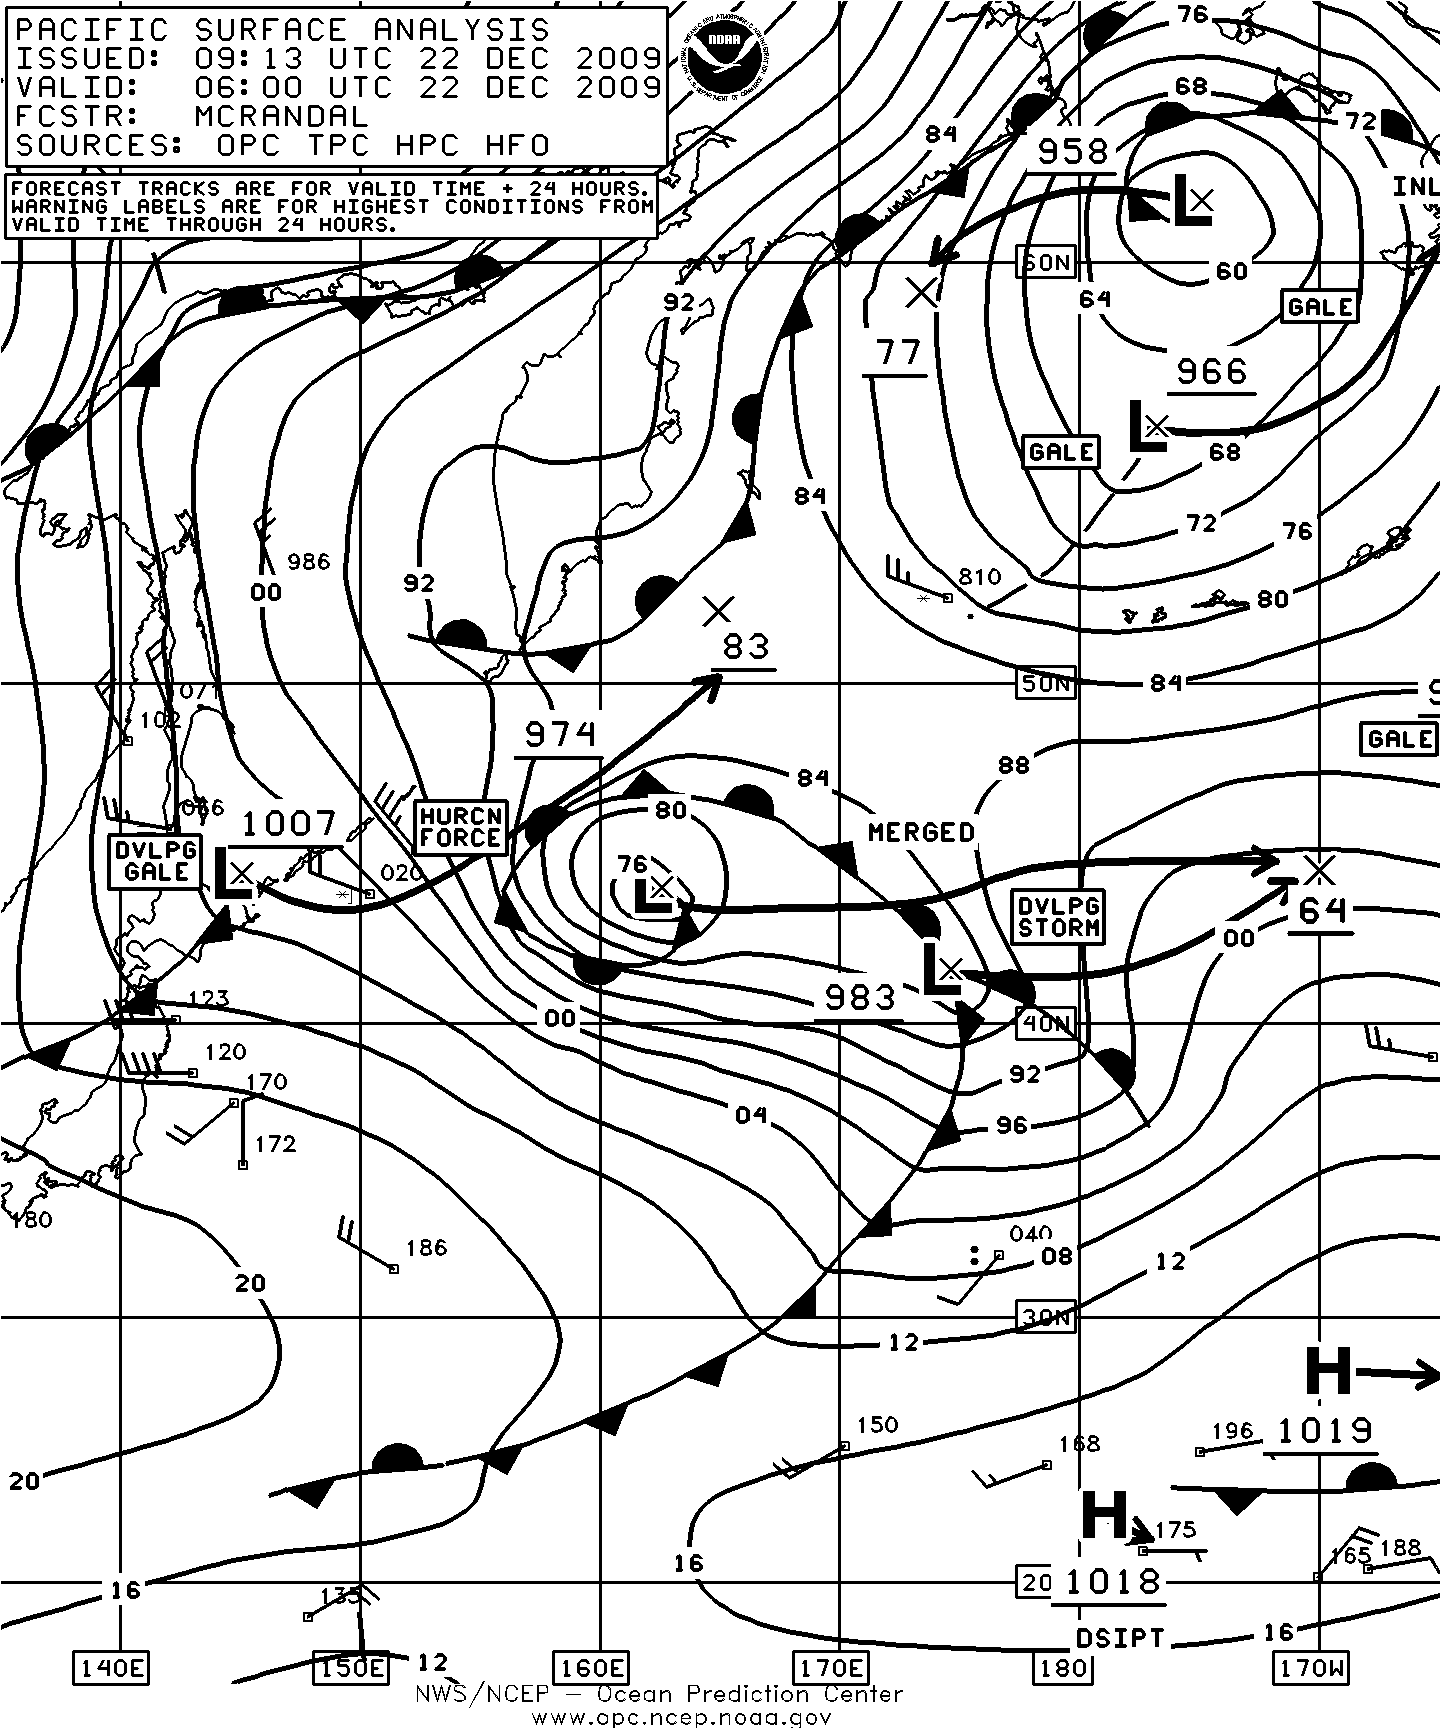
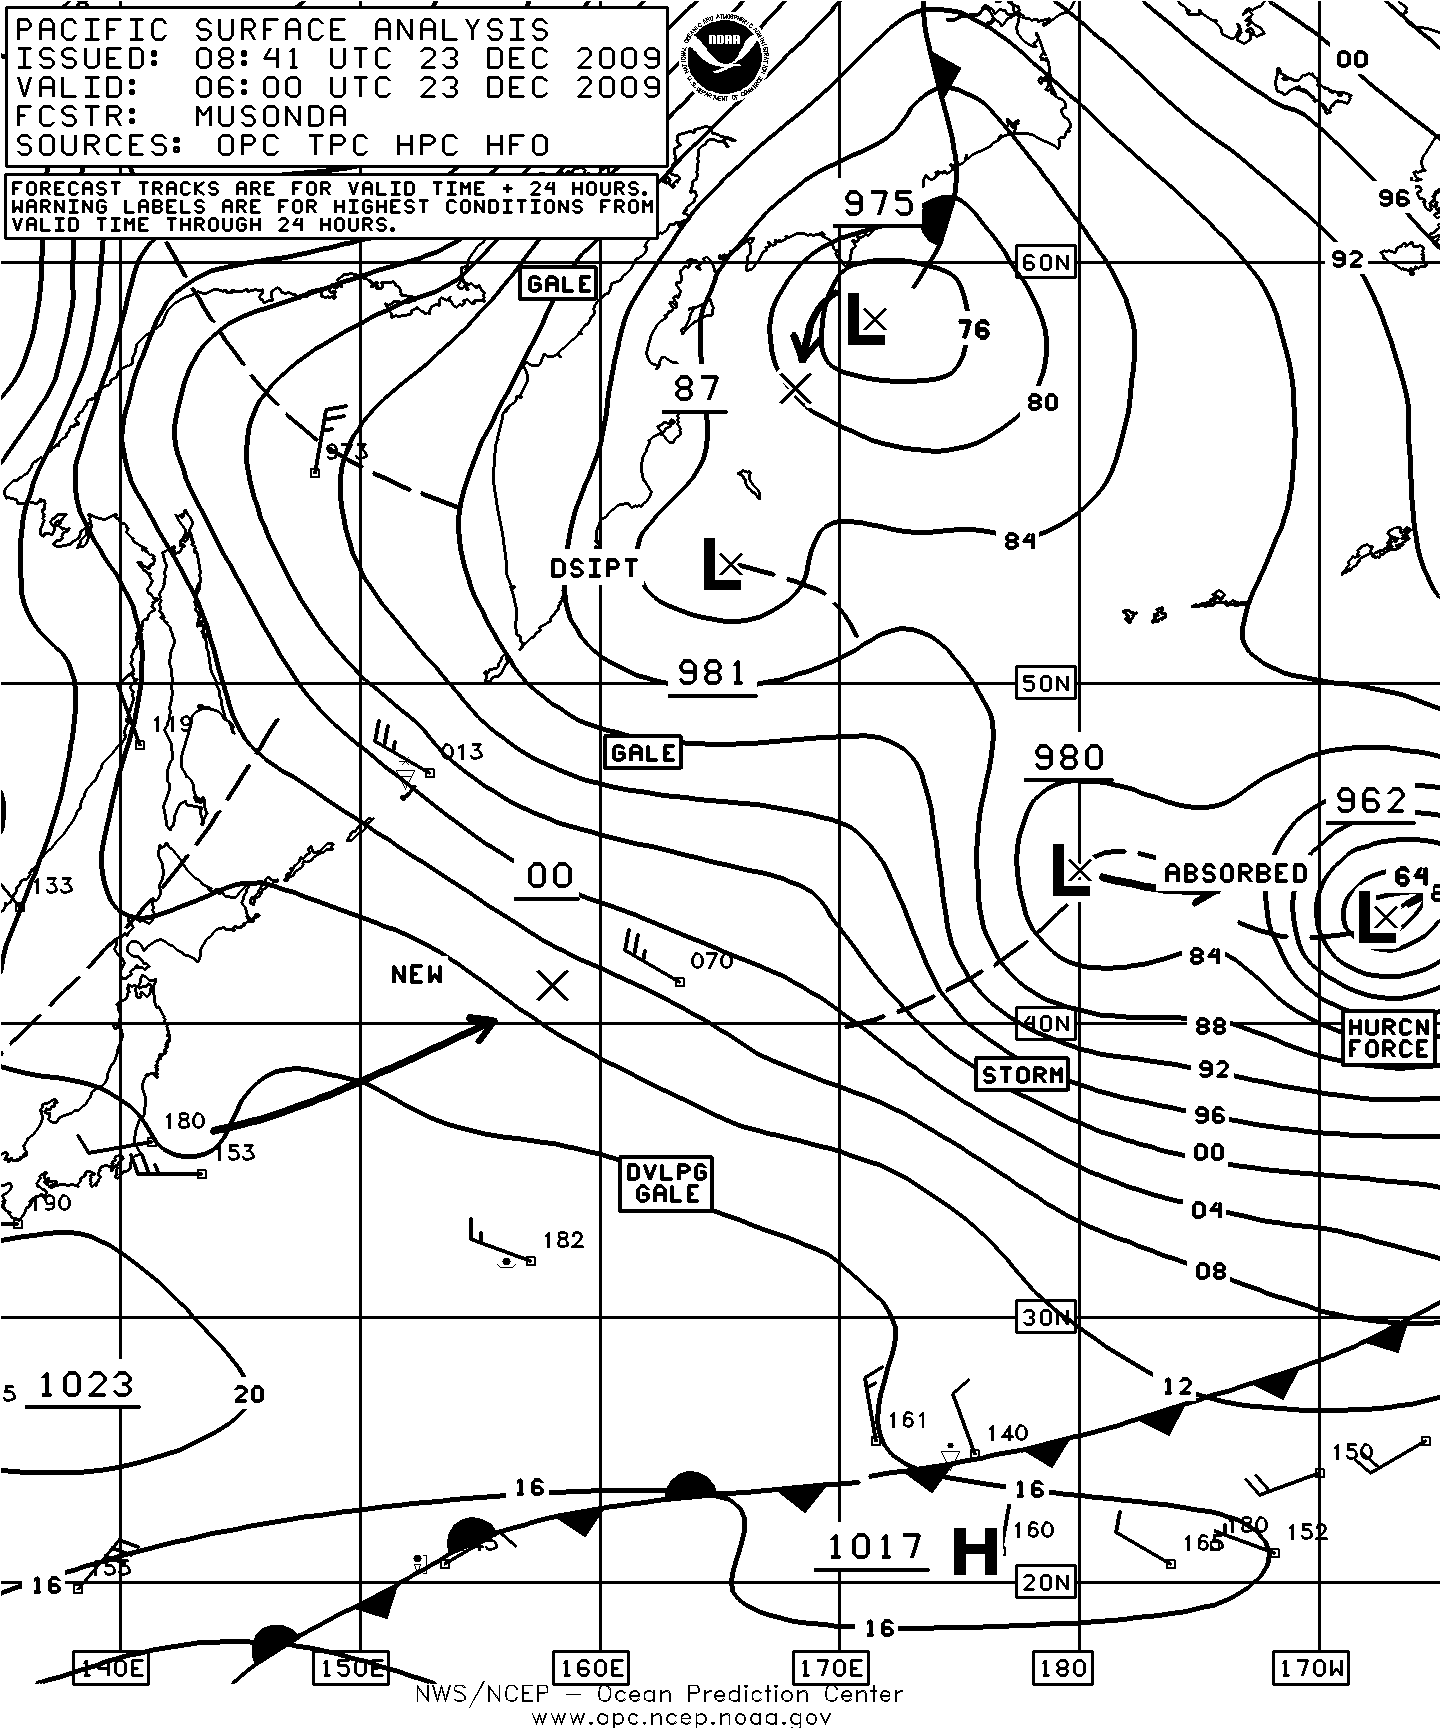
Figure 23. OPC North Pacific Surface Analysis charts (Part 2) valid 0600 UTC December 22 and 23, 2009.
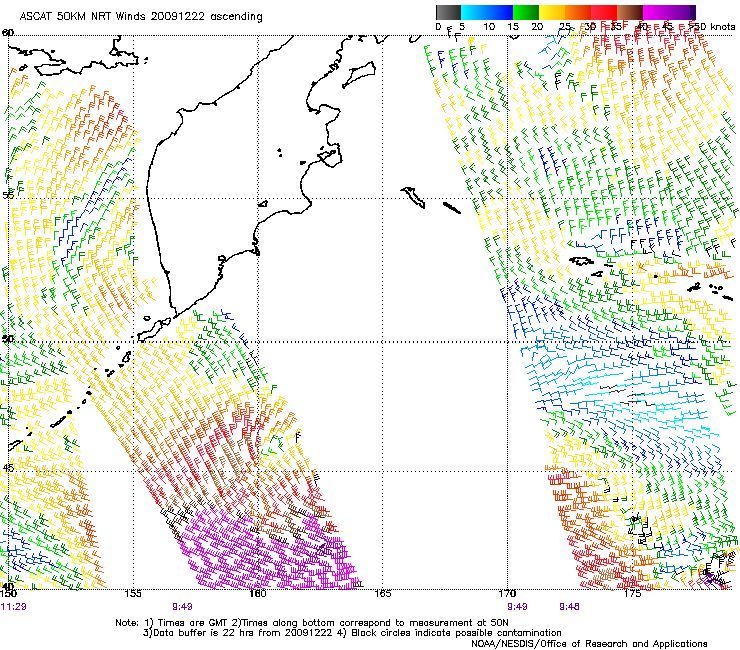
Figure 24. 50-km ASCAT (Advanced Scatterometer) image of satellite-sensed winds around the complex system east of Japan seen in the first part of Figure 23. The pass containing this storm system is from 0949 UTC December 22, 2009, or about four hours later than the valid time of the first part of Figure 23. The main hurricane-force center is in the data-free nadir swath of the satellite southeast of the Kamchatka Peninsula while the secondary cyclone appears near the southeast corner of the image. Image contains data processed by NOAA/NESDIS.