Tropical Atlantic and Tropical East Pacific Areas September through December 2008
John Cangialosi and Hugh Cobb, Tropical Analysis and Forecast Branch, National Hurricane Center, Miami, Florida
Atlantic, Caribbean, and Gulf of Mexico
Twelve non-tropical warnings were issued by the Tropical Analysis and Forecast Branch (TAFB) between September and December of 2008 over the tropical and subtropical North Atlantic Ocean (south of 31N west of 35W). Many of these warnings were associated with strong cold fronts; however, there were a few directly associated with low pressure systems and tight pressure gradients. Six of these warnings were issued for the open Atlantic, four for the Gulf of Mexico and two for the Caribbean Sea Table 1.
| Onset Date | Region | Magnitude | Duration | Weather Forcing |
|---|---|---|---|---|
| Oct 24 | Western Atlantic | Gale | 30 h | Front |
| Nov 15 | Gulf of Mexico | Gale | 30 h | Front |
| Nov 19 | Western Atlantic | Gale | 18 h | Front |
| Nov 24 | Central Atlantic | Storm | 48 h (12 h) | Low |
| Nov 30 | Gulf of Mexico | Gale | 48 h | Front |
| Nov 30 | Western Atlantic | Gale | 18 h | Front |
| Dec 9 | Caribbean | Gale | 12 h | Gradient |
| Dec 10 | Gulf of Mexico | Storm | 48 h (12 h) | Front |
| Dec 11 | Western Atlantic | Gale | 18 h | Front |
| Dec 15 | Central Atlantic | Gale | 60 h | Low |
| Dec 22 | Gulf of Mexico | Gale | 12 h | Front |
| Dec 26 | Caribbean | Gale | 36 h | Gradient |
Gulf of Mexico and Western Atlantic
The first gale event of the period commenced on 24 October as a low pressure area formed just south of the Florida panhandle along a cold front that extended through the eastern Gulf of Mexico. The pressure gradient between the frontal system and a 1035 hPa high over New England produced a swath of east to southeast gale force winds off the northeast Florida coast in the western Atlantic. An observation from the Maersk Gateshead (VQBW2) verified the warning, reporting 40 kts and 5.2 m (17 ft) combined seas just south of 31N. The event lasted 30 h before quickly diminishing.
The next gale occurred about three weeks later on 15 November as an amplified middle to upper level trough dug southeastward over the United States. This feature provided support for the first strong cold front of the season. Northerly gale force winds were observed by the Deepwater Horizon (V7HC9) and Unknown ship (ZWGDB) over the northwest Gulf. However, winds were estimated to be strongest over the data void western Bay of Campeche where fronts typically surge southward allowing for enhanced funneling. The total duration of the gale was 30 h. The same upper trough supported a couple of reinforcing cold fronts which caused a short lived 18 h period of westerly gale force winds over the western Atlantic on 19 November. A very similar pattern set up on 30 November leading to a near repeat event, which lasted for 48 h in the Gulf and 18 h in the Atlantic.
The strongest wind event in the region affected much of the Gulf of Mexico beginning on 10 December associated with the leading edge of an arctic airmass that spread across much of the United States. TAFB forecasters anticipated the severity of the cold front and accordingly issued storm warnings 48 h in advance. While there were several northerly gale force reports including: NOAA buoy 42055 and ships Overseas Philadelphia (WGDB), Discoverer Spirit (V7HC8), SMT Chemical Trader (KRGJ); a high resolution (12.5 km) QuikSCAT pass at 1248 UTC 10 December revealed the expected 50 kts winds over the southwestern Gulf of Mexico Figure 1, which was estimated to last for 12 h. Total duration of at least gale force was 48 h over the Gulf. As the front shifted east into the western Atlantic, it provided another 18 h period of gale force winds.
A brief 12 h gale event occurred on 22 December associated with another cold front moving through the Gulf of Mexico. This event caught forecasters by surprise as many of the global models did not suggest warning criteria. However, a high resolution QuikSCAT proved otherwise in showing a narrow band of 35-45 kts northwest winds west of the frontal wave over the Bay of Campeche Figure 2.
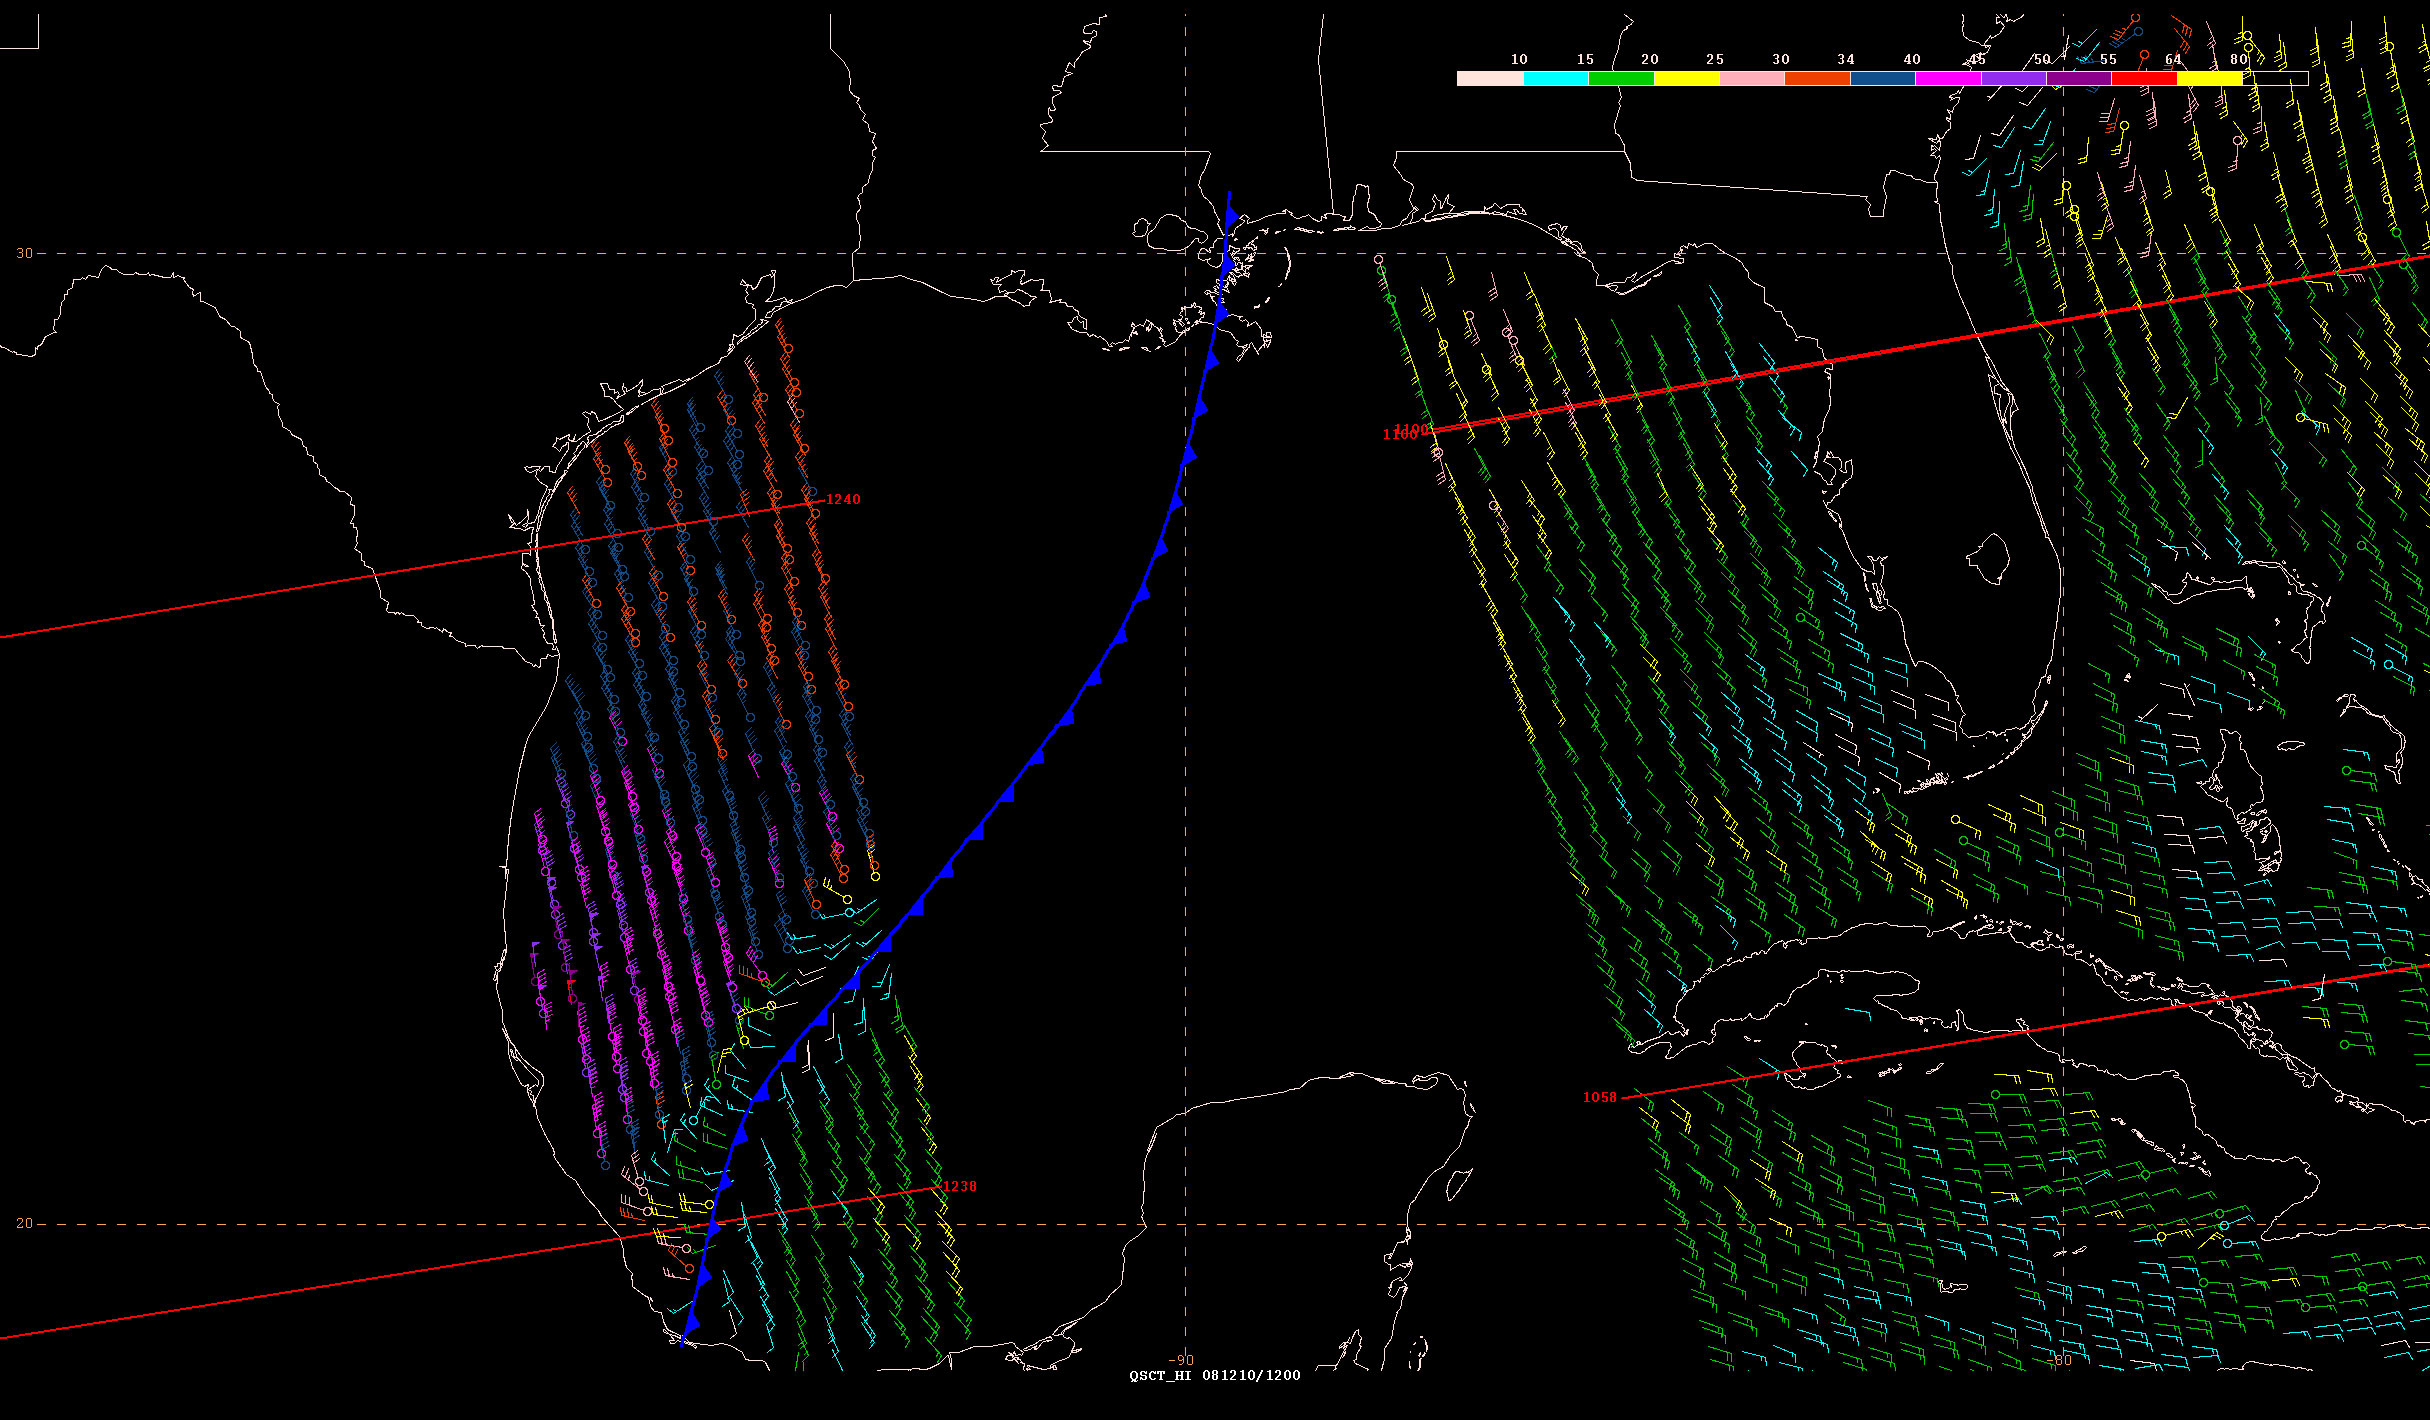
Figure 1. A 12.5 km high resolution QuikSCAT image from 1248 UTC 10 Dec 2008 showing storm force winds to the west of the strong cold front over the southwest Gulf of Mexico.(Click on image to enlarge)
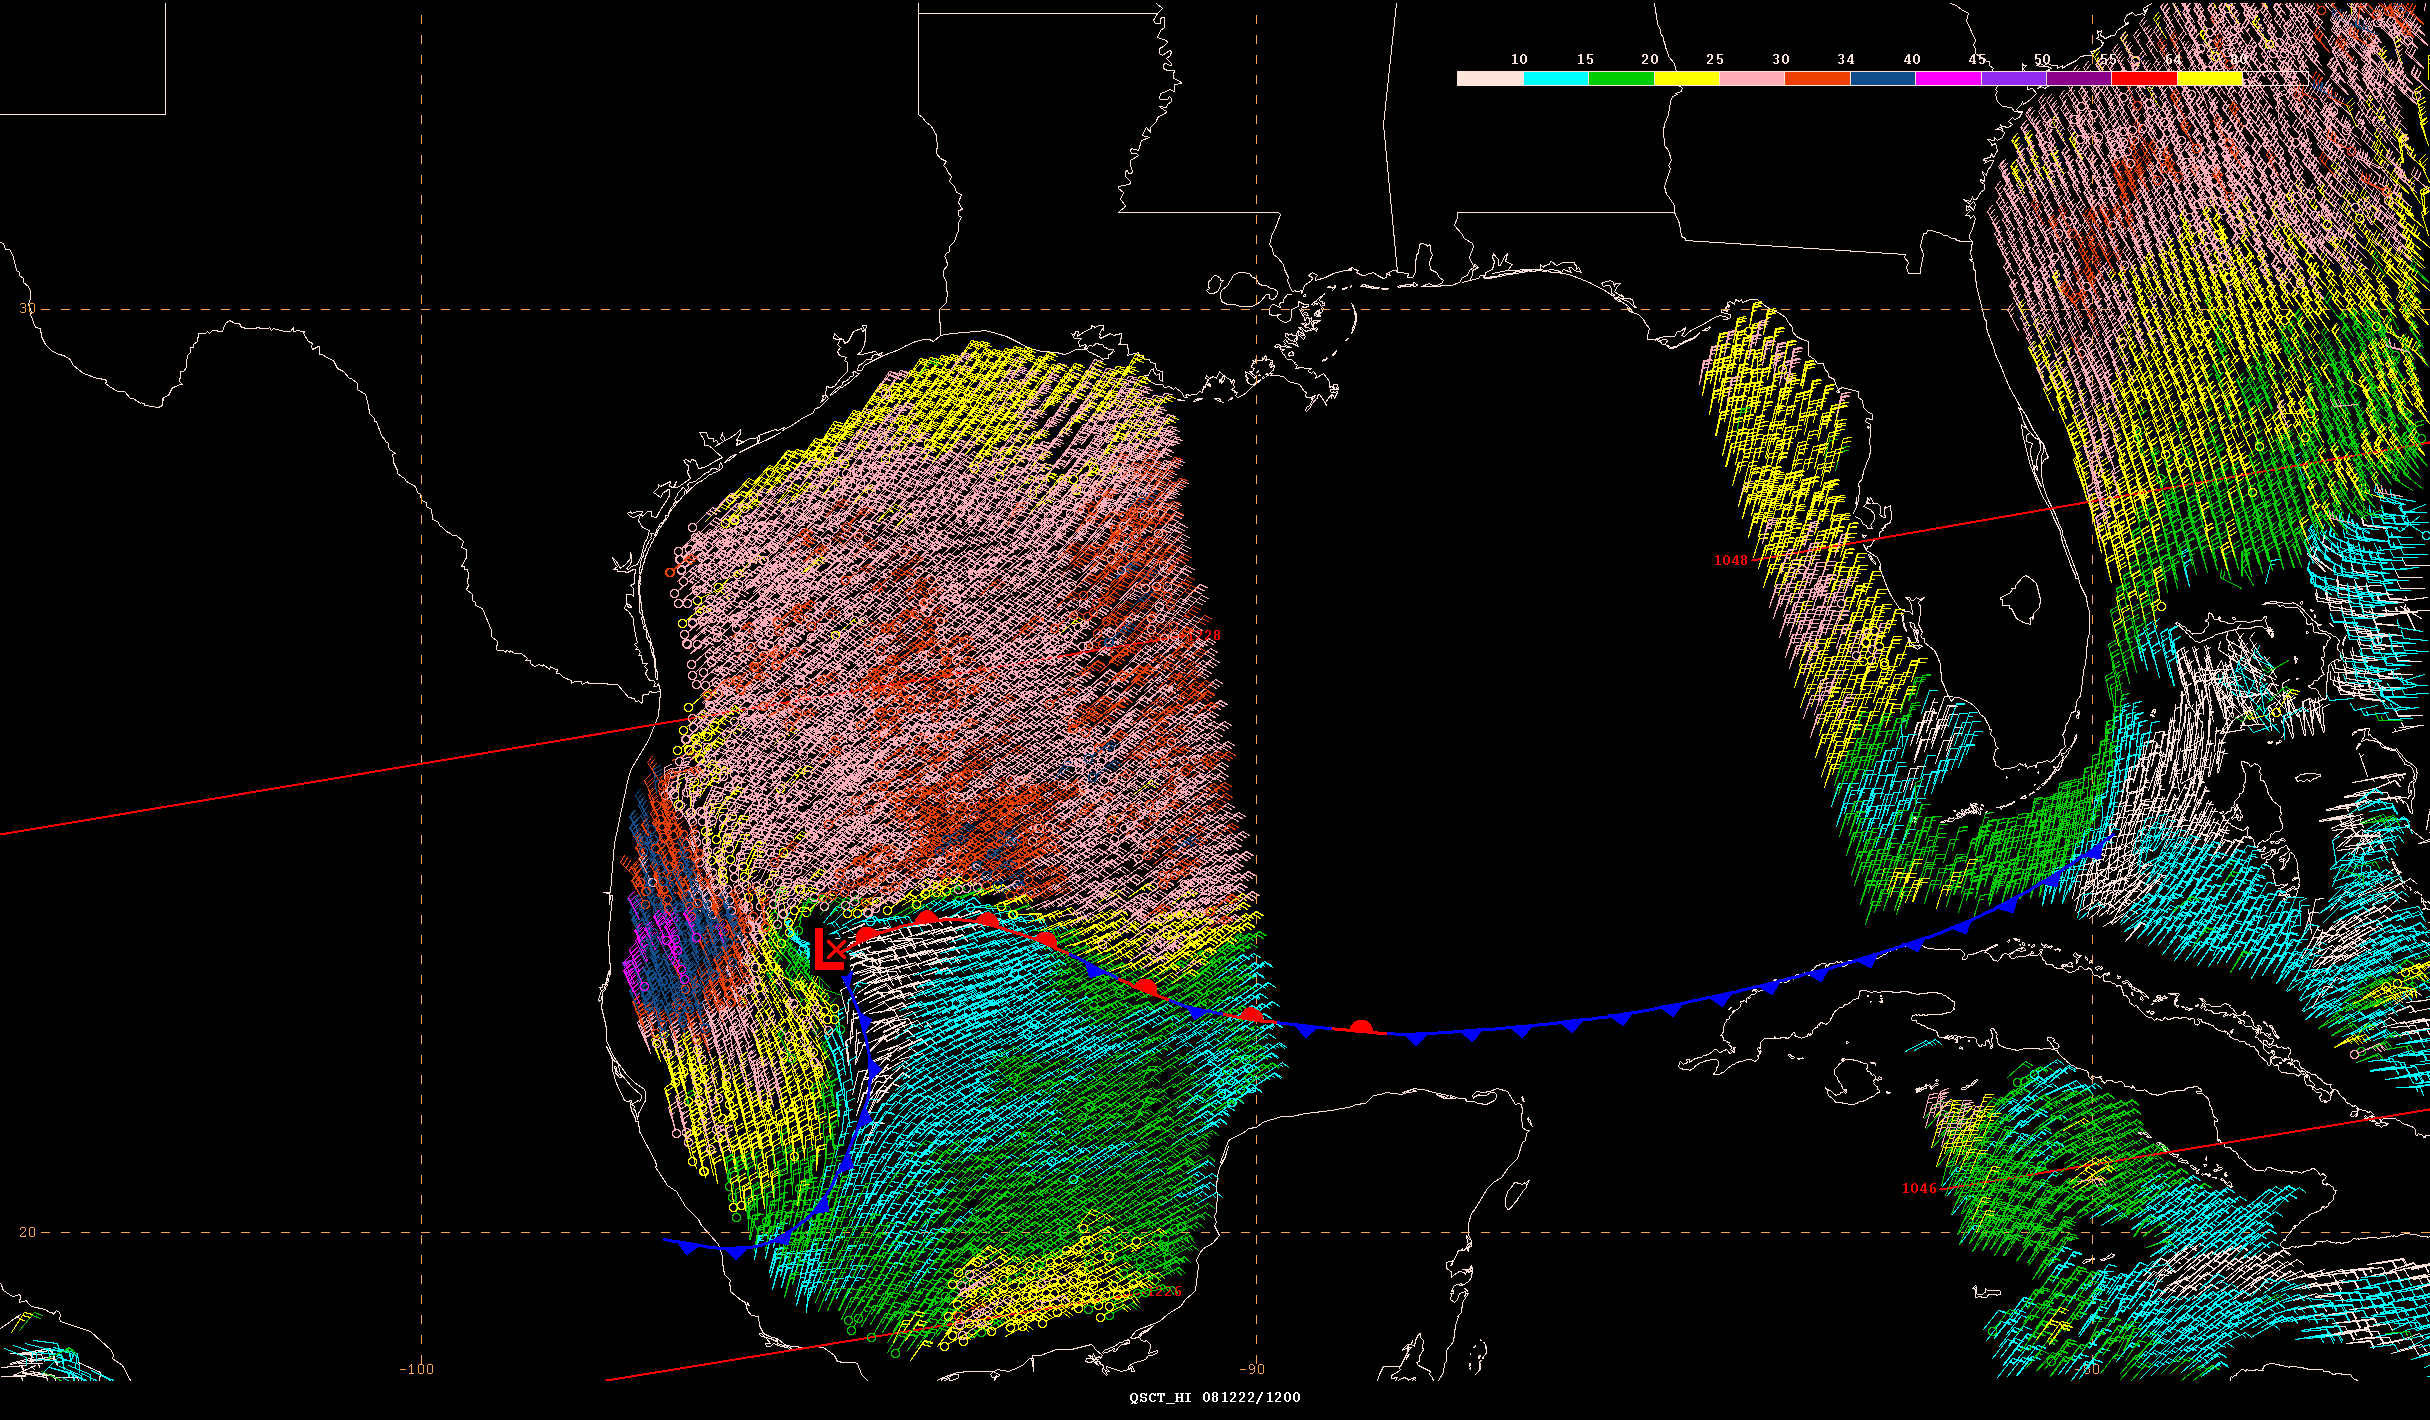
Figure 2. A 12.5 km high resolution QuikSCAT image from 1228 UTC 22 Dec 2008 revealing strong gale conditions west of a kinked front off the east coast of Mexico.(Click on image to enlarge)
Caribbean Sea
The first of two gales in the Caribbean lasted for 12 h on 9 Dec. The forcing for this event was the tight pressure gradient between a 1035+ hPa anticyclone centered off the mid-Atlantic coast and climatological lower pressure over northern portions of South America. This pattern produced marginal gale conditions as noted in QuikSCAT data over the central Caribbean from near the coast of Colombia to just south of Hispaniola where acceleration occurred in the exit region of the Mona Passage. An even stronger high pressure area built off the mid-Atlantic coast on 26 December. Unlike the previous event the weather pattern was not as progressive, leading to a similar magnitude but longer lasting (36 h) gale over the Central Caribbean.
Central Atlantic
Two high wind events occurred over the central Atlantic, one was the strongest and the other was the longest lived during the September through December period. The first event commenced on 24 Nov as a low pressure system developed near 30N 50W. Northerly winds increased to gale force in the cold sector as the low deepened to 1005 hPa late on 24 Nov. As the quasi-stationary low continued to deepen to 998 hPa on 25 Nov, north winds increased to 55 kt as revealed in a 0925 UTC QuikSCAT pass. The storm force winds were estimated to last for 12 h and winds were at least to gale force for a total of 48 h. Figure 3 is the National Weather Service surface analysis at 1800 UTC 25 Nov showing the low pressure system near peak intensity.
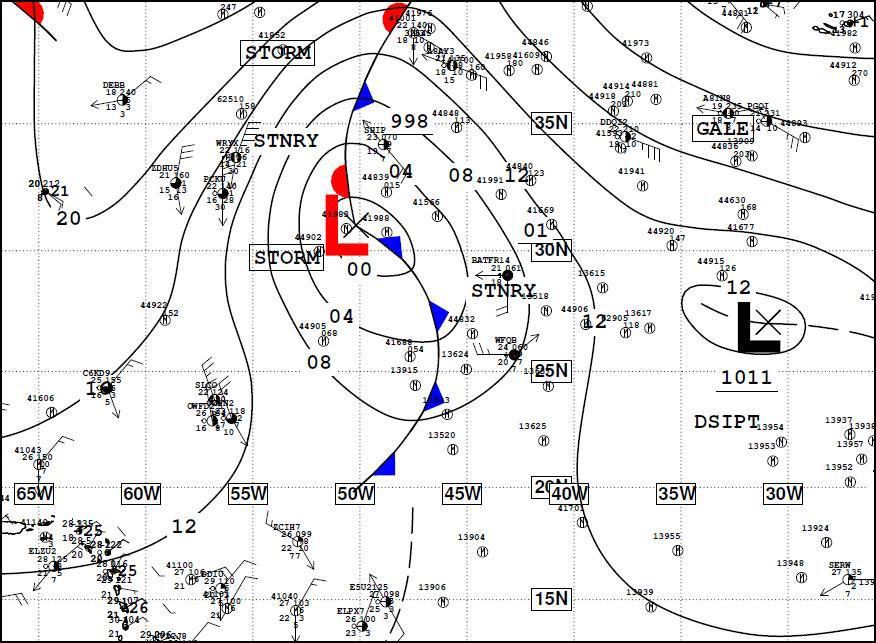
Figure 3. The 1800 UTC 25 Nov 2008 National Weather Service Unified Surface Analysis showing an area of low pressure near peak intensity responsible for the strongest Atlantic event of the September through December 2008 period in the TAFB area of responsibility.(Click on image to enlarge)
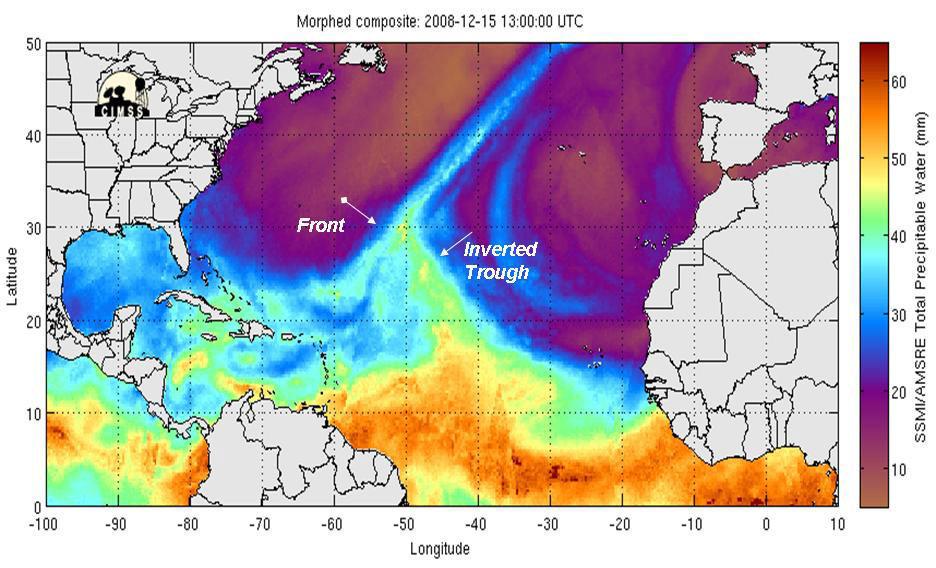
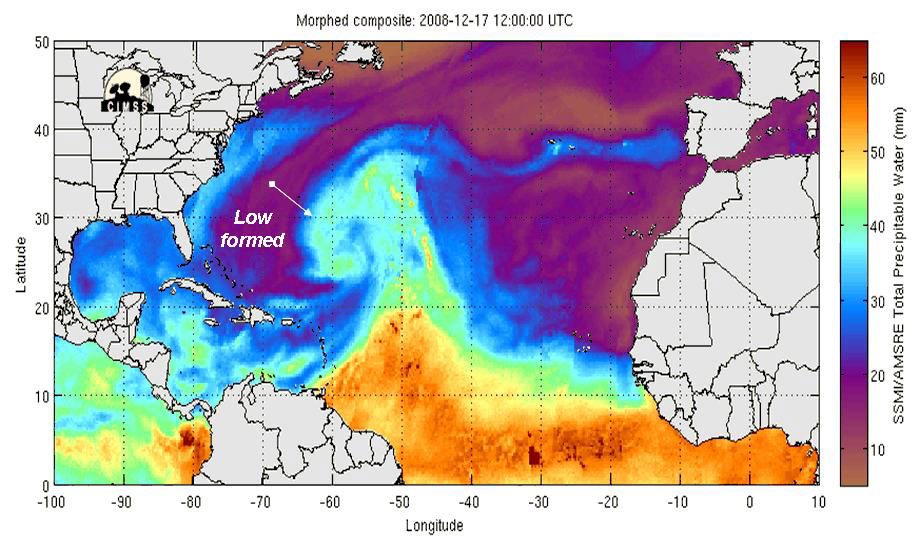
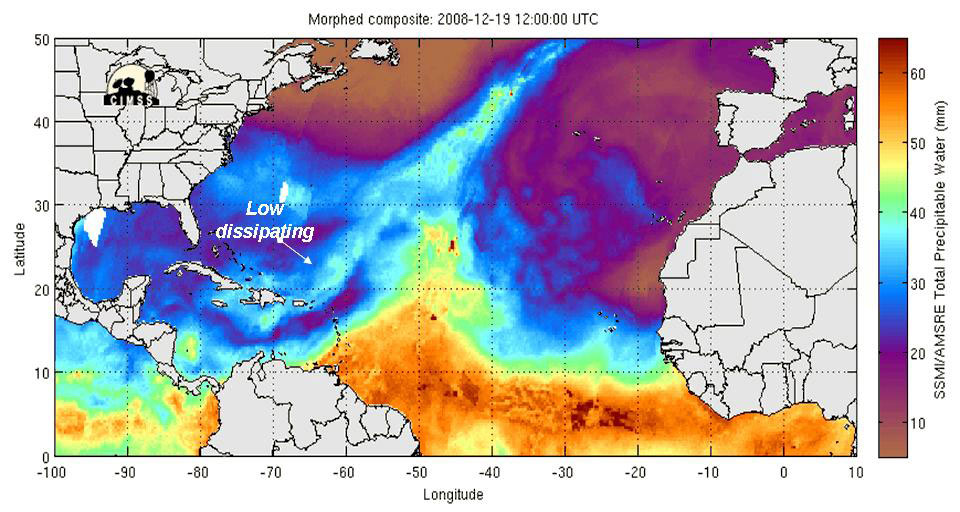
The combined effects of a stalled front over the central Atlantic, a westward moving inverted trough over the subtropical central Atlantic and strong 1040 hPa high pressure over the northwest Atlantic produced the longest lasting gale of the period (60 h). The inverted trough became tangled with the front, which led to cyclongensis on 16 Dec. The low pressure area then tracked southwestward toward the northeast Caribbean islands and strengthened to 1008 hPa near 26N 58W on 17 December, steered by a titled middle-level ridge north of the system. However, increasing northerly shear and stable air aloft led to the demise of the circulation before reaching the islands on 19 December. Figure 4 shows a few snap shots of the Morphed Integrated Microwave Imagery Total Precipitable Water product from the Cooperative Institute for Meteorological Satellite Studies (CIMSS) displaying the evolution of this system over a four day time frame.
Figure 4. CIMSS Morphed Integrated Microwave Imagery Total Precipitable Water product from (a) 1300 UTC 15 Dec, (b) 1200 UTC 17 Dec and (c) 1200 UTC 19 Dec. The imagery provides snap shots of the evolution of the low pressure system in the Central Atlantic that was the main culprit producing the longest lived warning between September and December 2008 in the Atlantic TAFB area of responsibility.
(Click on images to enlarge)
Eastern Pacific
Fifteen non-tropical warnings were issued by TAFB between September and December of 2008 over the tropical and subtropical North Pacific Ocean (south of 30N east of 140W). A majority of these warnings were associated with Gulf of Tehuantepec gap wind events with other events occurring in the Gulf of California and the northwest portion of the forecast area in association with a cold front. (Table 2).
| Onset Date | Region | Magnitude | Duration | Weather Forcing |
|---|---|---|---|---|
| Oct 18 | Tehuantepec | Gale | 48 h | Gap |
| Oct 24 | Tehuantepec | Gale | 18 h | Gap |
| Oct 27 | Tehuantepec | Storm | 168 h | Gap |
| Nov 6 | Gulf of California | Gale | 18 h | Front |
| Nov 15 | Gulf of California | Gale | 30 h | Front |
| Nov 16 | Tehuantepec | Storm | 108 h | Gap |
| Nov 21 | Tehuantepec | Gale | 60 h | Gap |
| Nov 25 | Tehuantepec | Gale | 24 h | Gap |
| Dec 2 | Tehuantepec | Gale | 36 h | Gap |
| Dec 5 | Tehuantepec | Gale | 30 h | Gap |
| Dec 11 | Tehuantepec | Storm | 60 h | Gap |
| Dec 16 | Gulf of California | Gale | 12 h | Low |
| Dec 22 | Tehuantepec | Gale | 24 h | Gap |
| Dec 23 | Northwest waters | Gale | 12 h | Front |
| Dec 30 | Tehuantepec | Gale | 36 h | Gap |
Gulf of Tehuantepec Gale and Storm events
The Gulf of Tehuantepec was quite active with a total of eleven gale and storm events in the period from late October through December. Of these eleven events, three were classified as storm force based on high resolution QuikSCAT data (Table 2). The first Gulf of Tehuantepec event of the season began around 1200 UTC 18 October, which is within a week of the average starting date (25 October) for the first event of a typical season (Cobb et al, 2003). Gale force winds lasted 48 h as indicated by QuikSCAT passes at 1222 UTC 28 October and 0053 UTC 29 October. There were no ships reporting gale force winds.
The next and briefest event of the season thus far began around 0000 UTC 24 October and lasted a mere 18 h. A QuikSCAT pass at 0022 UTC 24 October indicated a modest gale with winds of 35 kt. Like the first event of the season, there were no associated ship reports of gale force winds or higher associated with this event.
The third event of the season persisted for 168 h from 1200 UTC 27 October to 1200 UTC 3 November, the longest lasting event thus far this season and the earliest long lasting event (greater than 120 h) for so early in the season. The previous record for the earliest long lasting event was from 1800 UTC November to 0000 UTC 10 November 2004 (Brown and Cobb, 2005). This was also the first storm force wind event of the season. A high resolution QuikSCAT pass from 0010 UTC 28 October indicated 45-50 kt winds in the Gulf of Tehuantepec (Figure 5). A subsequent pass from 1254 UTC 28 October missed the Gulf of Tehuantepec but still indicated an area of 45-50 kt winds near the edge of the data swath. The area of winds was located about 120 nmi south-southwest of the Gulf of Tehuantepec where the ship Celebrity Infinity (9HJD9) located near 15N 94.7W, reported north-northeast winds of 60 kt at 1200 UTC 28 October. An hour later the same ship had moved west to near 15N 95.1W and indicated that winds had increased to 70 kt thus suggesting maximum winds for this event may have reached hurricane force. Real time quality control of the ship observations indicated that the winds were about 10 kt too high. The ship did not report any seas during its passage across the Gulf of Tehuantepec.
Figure 5. High resolution (12.5 km) QuikSCAT pass from 0010 UTC 28 October depicting a swath of 45-50 kts winds in the Gulf of Tehuantepec.
(Click on image to enlarge)
The extended duration of this event produced a wealth of other gale force or greater ship reports in the area over the next week. Other ships reporting gale force winds included the APL Vietnam (9VEN5) which observed north winds of 36 kt and 4 m (15 ft) seas at 1800 UTC 30 October while located near 13.8N 95.4W. The ship Coral Princess (ZCDF4) reported north-northwest winds of 40 kt at 1200 UTC 1 November while located near 15.6N 94.3W. The ship did not report sea heights. The final ship report from this event came from the London Express (DPLE) at 0600 UTC 2 November while the ship was located near 14.4N 95.9W. The ship reported north-northeast winds of 40 kt.
Nearly two weeks elapsed before the fourth wind event of the 2008-09 Tehuantepec season began. This event, the second storm force wind event of the season started at 0000 UTC 16 November and persisted for four and half days until 1200 UTC 20 November. A 0018 UTC 16 November High resolution QuikSCAT pass indicated 50-55 kt winds in the Gulf of Tehuantepec. Another pass over the region approximately 36 h later, at 1241 UTC 17 November, indicated winds had dropped below storm force but were still in the 40-45 kt range over the area. Like the previous wind event, there were quite a few ships reporting gale force winds in the region. The ship Prinsenborg (PBJF) reported northerly winds of 45 kt and seas of 4m (14 ft) at 0600 UTC 17 November while located near 15.8N 94.5W. The Prinsenborg was heading east across the Gulf and indicated winds had dropped to 34 kt three hours later while located near 15.5N 94.0W. Other ship reports during this event included northeast winds of 36 KT and 3.5 m (12 ft) seas from the Nikkei Tiger (3FMH7) at 1800 UTC 17 November while the ship was located near 13.7N 96.4W, north-northeast winds of 45 kt from the Paris Express (DIHE) at 0600 UTC 18 November near 14.3N 95.9W and north-northeast winds of 36 kt and 5m seas (16 ft) from the Spruce Arrow (C6SD9) at 1800 UTC 19 November while the ship was near 14.9N 95.1W.
The next several wind events in the Gulf of Tehuantepec were characterized by limited availability of ship data for each event. The first of these events began around 1200 UTC 21 November, a mere 24 h after the end of the storm event noted above, and lasted until 0000 UTC 24 November. A 1237 UTC 21 November high resolution QuikSCAT pass indicated northerly winds of 40 kt in the Gulf of Tehuantepec. Subsequent passes at 0103 UTC and 1211 UTC 22 November indicated winds had increased to a high end gale with 45 kt winds noted. There were no ship reports associated with this event.
The next event commenced around 1200 UTC 25 November and lasted a brief 24 h. A 1233 UTC 25 November high resolution QuikSCAT pass indicated a marginal gale with northerly winds of 35 kt in the area. There were no ship reports of winds of gale force or greater in the area.
The seventh event began around 0600 UTC 2 December and lasted for 36 h. A 1244 UTC 2 December high resolution QuikSCAT pass indicated 40-45 kt winds in the Gulf of Tehuantepec. This was the only QuikSCAT pass to indicate gale force winds during this brief event. Similar to the previous event, there were no ship reports of winds of gale force or greater in the area.
The next event began around 0000 UTC 5 December and was also very short lived, lasting only 30 h. A 2359 UTC 4 December high resolution QuikSCAT pass indicated 35 kt winds only within 90 nm of the Gulf of Tehuantepec, covering a very small area.
The ninth event in this period commenced around 0600 UTC 11 December and lasted 60 h. This event constituted the third storm force wind event of the season thus far and may also have been the strongest event as well. A 1220 UTC 11 December high resolution QuikSCAT pass indicated 50-55 kt winds in the Gulf of Tehuantepec (Figure 6). A subsequent 2320 UTC 11 December pass still indicated 50 kt winds in the region.

Figure 6. High resolution (12.5 km) QuikSCAT pass from 1220 UTC 11 December depicting a swath of 50-55 kts winds in the Gulf of Tehuantepec.
(Click on image to enlarge)
The last two events of 2008 were brief gale force wind events in the Gulf of Tehuantepec. The first of these events began around 1200 UTC 22 December and lasted for about 24 h. A 1232 UTC 22 December QuikSCAT pass indicated northerly winds of 35 kt in the area. A subsequent 0058 UTC 23 December pass still indicated marginal gales. There were no ship reports of gale force winds or higher during this event.
The final event of the year began around 0000 UTC 30 December and lasted about 36 h. A 1225 UTC 30 December QuikSCAT pass indicated northerly winds of 40 kt in the Gulf of Tehuantepec. Like the previous event, there were no ship reports of gale force winds or higher in the area at the time of the event.
Gulf of California Gales of September-December 2008
High pressure built into the inter-mountain western United States and pushed a strong cold front southward into northern Mexico. The front ushered in Gale force winds over the northern portions of the Gulf of California. The gale commenced at 0600 UTC 6 November based on a report from the NOAA oceanographic research ship David Starr Jordan (WTDK) of north-northwest winds of 40 kt and fetch limited seas of 2.5 m (7 ft). The ship was located at the far northern portion of the Gulf of California near 30.6N 114.3W. A subsequent report from the same ship at 1200 UTC 6 November still indicated north-northwest winds of 37 kt. The David Starr Jordan provided a wealth of data during this and subsequent events in the Gulf of California. The ship indicated winds had dropped to 30 KT from the north-northwest at 0000 UTC 7 November.
The second gale event in less than 10 days commenced in the Gulf of California around 0600 UTC 15 November. Similar to the previous event, this event was verified by numerous reports from the NOAA oceanographic research ship David Starr Jordan. The ship was equipped with additional instrumentation for wind measurements and reported north-northwest winds varying between 35 and 45 kt over a period of 10 hours between 0900 and 1900 UTC 15 November. This event lasted about 30 h. Figure 7 depicts the synoptic scale pattern in place during both events. The pattern featured strong high pressure over the inter-mountain west which resulted in a strong pressure gradient over Northwest Mexico and the Gulf of California.
An area of low pressure dropped southeastward and intensified along the coast of California late on 16 December. The central pressure of the low deepened from 1014 hPa at 1800 UTC 16 December to 1005 hPa by 1800 UTC 17 December. The rapid deepening of this low prompted the issuance of gale warnings for the far northeast Pacific off the Baja California coast and the northern portion of the Gulf of California beginning 0600 UTC 17 December. There were no ship reports to confirm the existence of the gale as the NOAA oceanographic research ship David Starr Jordan had returned to her home port of San Diego on 4 December.
Gale Northwest Tropical East Pacific December 24, 2008
A gale center located near 43N 140W at 1200 UTC 23 December moved rapidly southeastward and intensified to a 997 hPa storm center near 36N 128W by 1200 UTC 24 December. A trailing cold front entered the TAFB forecast area of responsibility around 0900 UTC 24 December, ushering marginal gale force northwesterly winds into the area northwest of the cold front as indicated by a 1505 UTC 24 December high resolution QuikSCAT pass. At 1800 UTC 24 December the ship Zaandam (PDAN) reported northwest winds of 45 kts while located near 28.5N 129W. Winds in the forecast were increased to 45 kts based on this ship report. Six hours later the same ship indicated northwesterly winds had dropped off to 28 kts while the ship was located near 28N 131.8W, thus signaling an end to gale force winds in the area.
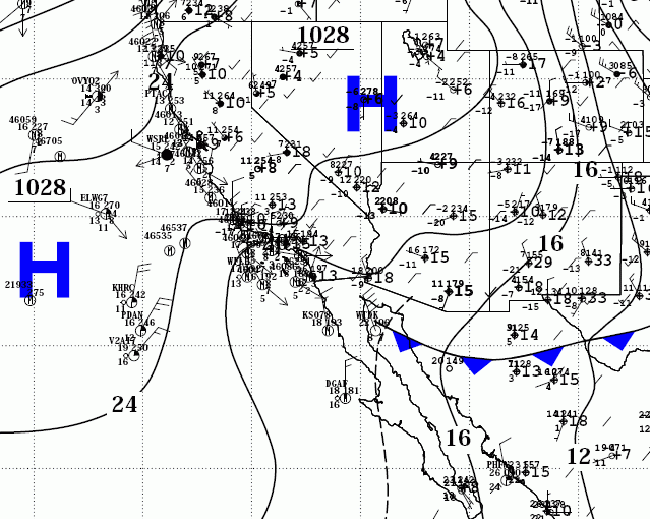
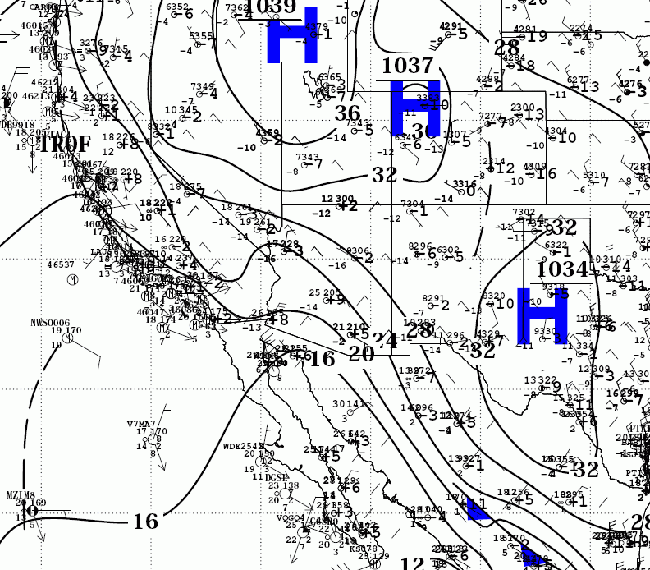
Figure 7. Two-panels of the Tropical Analysis and Forecast Branch (TAFB) surface analyses from 0600 UTC 6 November 2008 and 1800 UTC 15 November 2008. Surface analyses depict the synoptic scale pattern in place which produced gale force winds in the northern Gulf of California.
References
Cangialosi, J. and H. Cobb, Tropical Atlantic and Tropical East Pacific Areas January through April 2008. Mariners Weather Log, Vol. 52, No. 2, August 2008.
Cobb III, H.D., D.P. Brown, and R. Molleda, 2003. Use of QuikSCAT imagery in the diagnosis and detection of Gulf of Tehuantepec wind events 1999-2002. Preprints, 83rd Annual Meeting/12th Conference on Satellite Meteorology and Oceanography, Long Beach, CA, Amer. Meteor. Soc.
Brown, Daniel P. and Hugh D. Cobb III, Tropical Atlantic and Tropical East Pacific Areas July through December 2004. Mariners Weather Log, Vol. 49, No. 1, April 2005.
Back to top