Marine Weather Review North Atlantic Area
September to December 2008
By George P. Bancroft
NOAA National Center for Environmental Prediction
Introduction
The period of September to December 2008 included a period of increasing activity of extratropical cyclones as late summer gave way to fall and then early winter. From September to the middle of October cyclonic systems tracked mainly north of 45N but there were some notable exceptions, such as two early-season hurricane force cutoff lows forming over the south central and southwestern waters in September. Otherwise developing cyclones tracked in a northeastward direction toward the area east of Greenland to the Norwegian Sea. At times such as in late September, mid to late October, mid November to early December and in late December the pattern became blocked, forcing cyclones northward toward the Davis Strait and forming slow-moving cutoff lows in southern waters. December was the most active month, with twelve hurricane force systems in that month alone.
Tropical activity occurred in September and the middle of October when Tropical Storm Hanna followed by Hurricane Kyle and Subtropical/Tropical Storm Laura, and then in mid-October Hurricane Omar, affected OPCs waters north of 31N. Other tropical systems occurred during the period but remained south of OPCs area. More information on tropical cyclones and other significant weather south of 31N may be found in the review for the Tropical Atlantic and Tropical East Pacific areas issued by TPCs Tropical Analysis and Forecast Branch. Also see Reference 1.
Tropical Activity
Tropical Storm Hanna: Hanna passed north from the Bahamas into OPCs southwestern waters late on September 5 as a strong tropical storm with maximum sustained winds of 60 kts and gusts to 75 kts. The cyclone then moved inland over eastern North Carolina and southeast Virginia on the 6th and weakened but remained a tropical storm with 45 kts sustained winds and gusts to 55 kts. Hanna then moved along the coast before passing near Long Island on the evening of the 6th with 50 kts sustained winds and gusts to 60 kts. Hanna then weakened to an extratropical gale force low in the Gulf of Maine early on the 7th. The remains of Hanna later re-intensified into a storm force low over the North Atlantic on September 9 with the central pressure dropping to as low as 977 hPa just west of Ireland later on the 10th. The cyclone then weakened as it approached Iceland by the 12th. Some notable ship, buoy and platform observations taken during passage of Hanna near the U.S. and Canadian coasts are listed in Table 1. Later as extratropical Hanna was near Ireland the ship Chiquita Schweiz (WDC6925) (50N 36W) reported a north wind of 50 kts and 8.0 m seas (26 ft) at 1700 UTC on the 9th. A high resolution QuikSCAT pass about four hours later showed winds to 55 kts in that area.
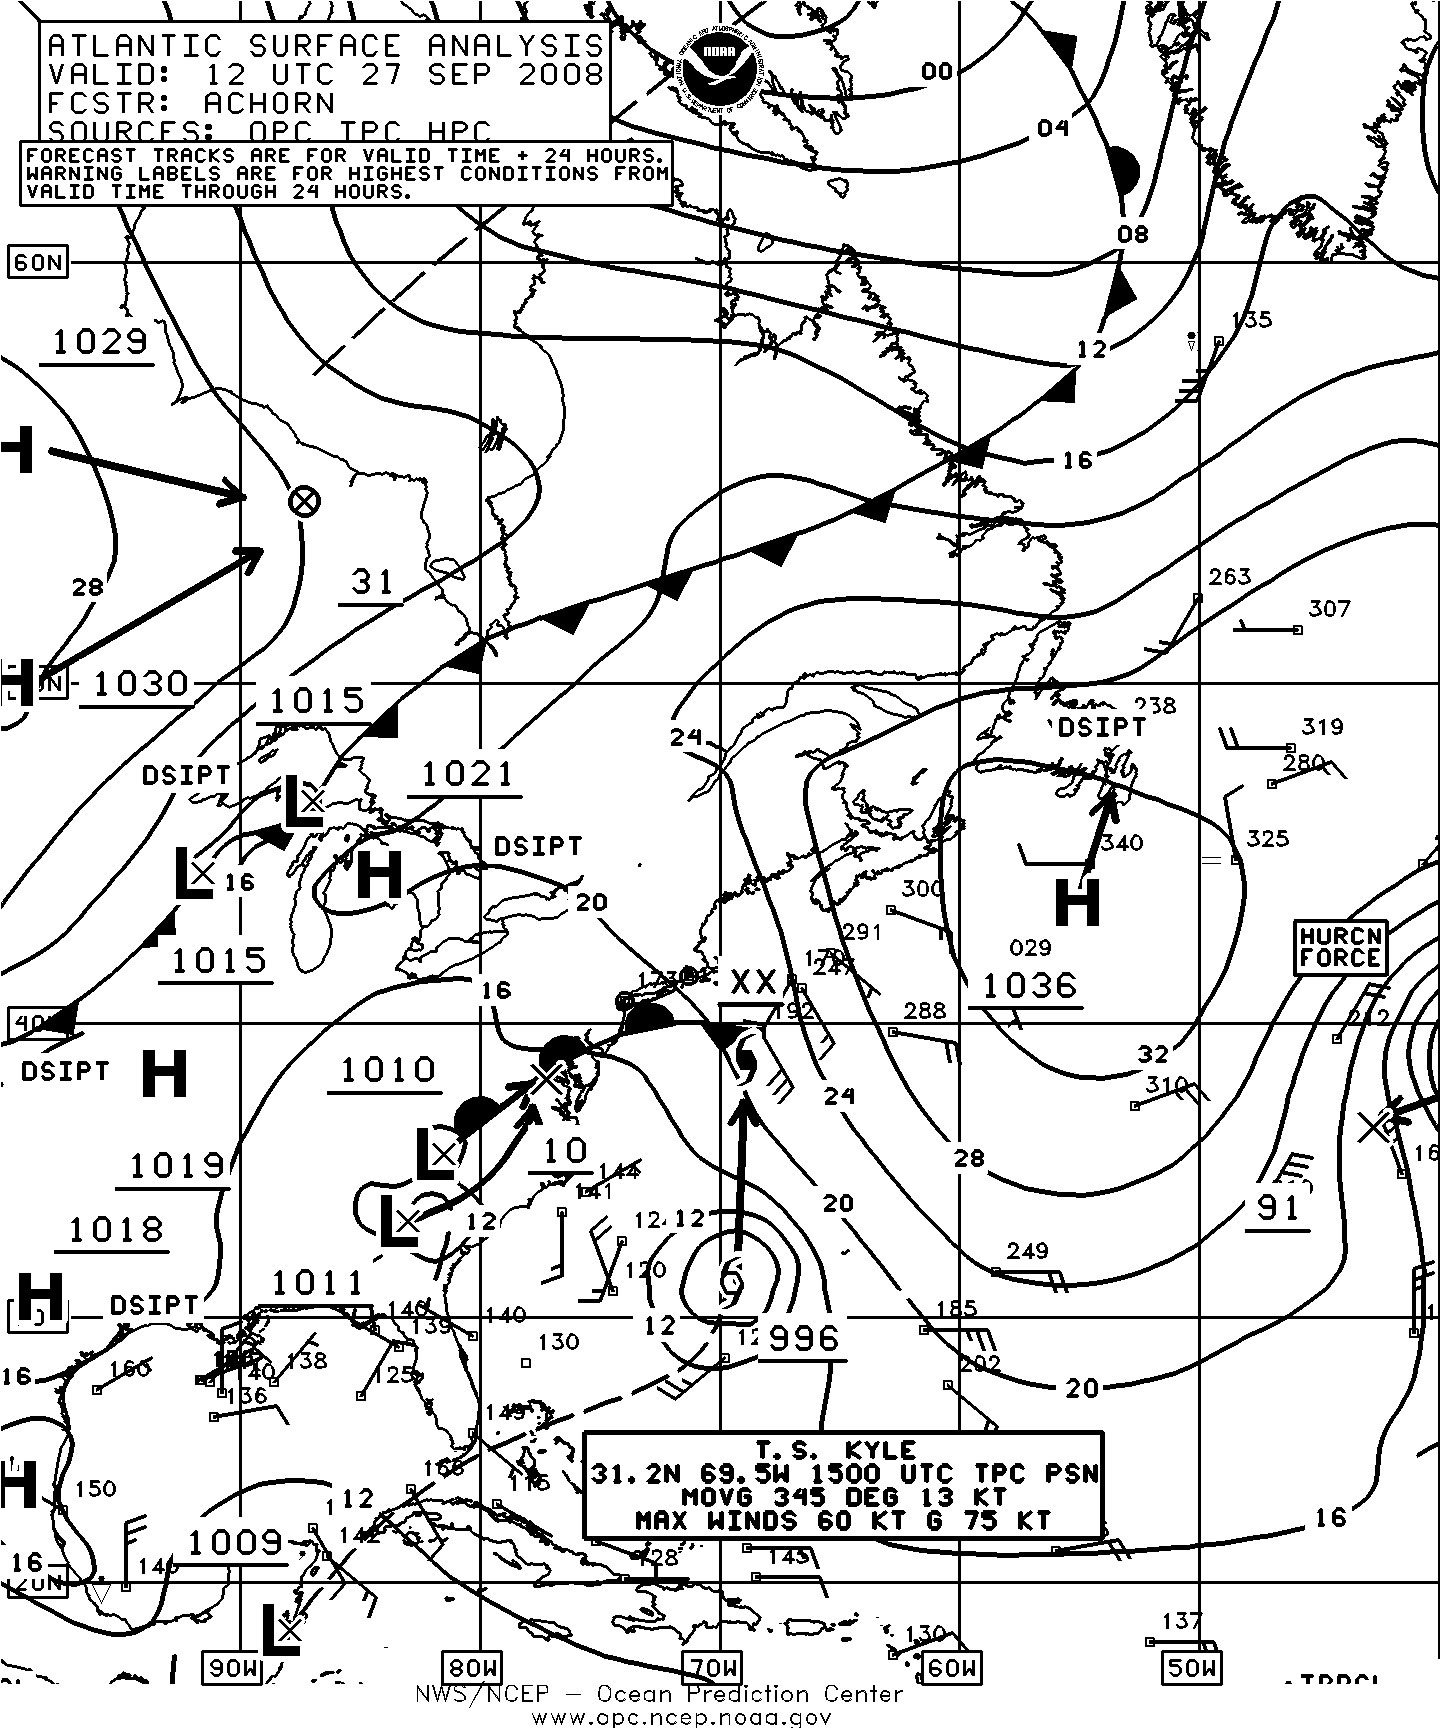
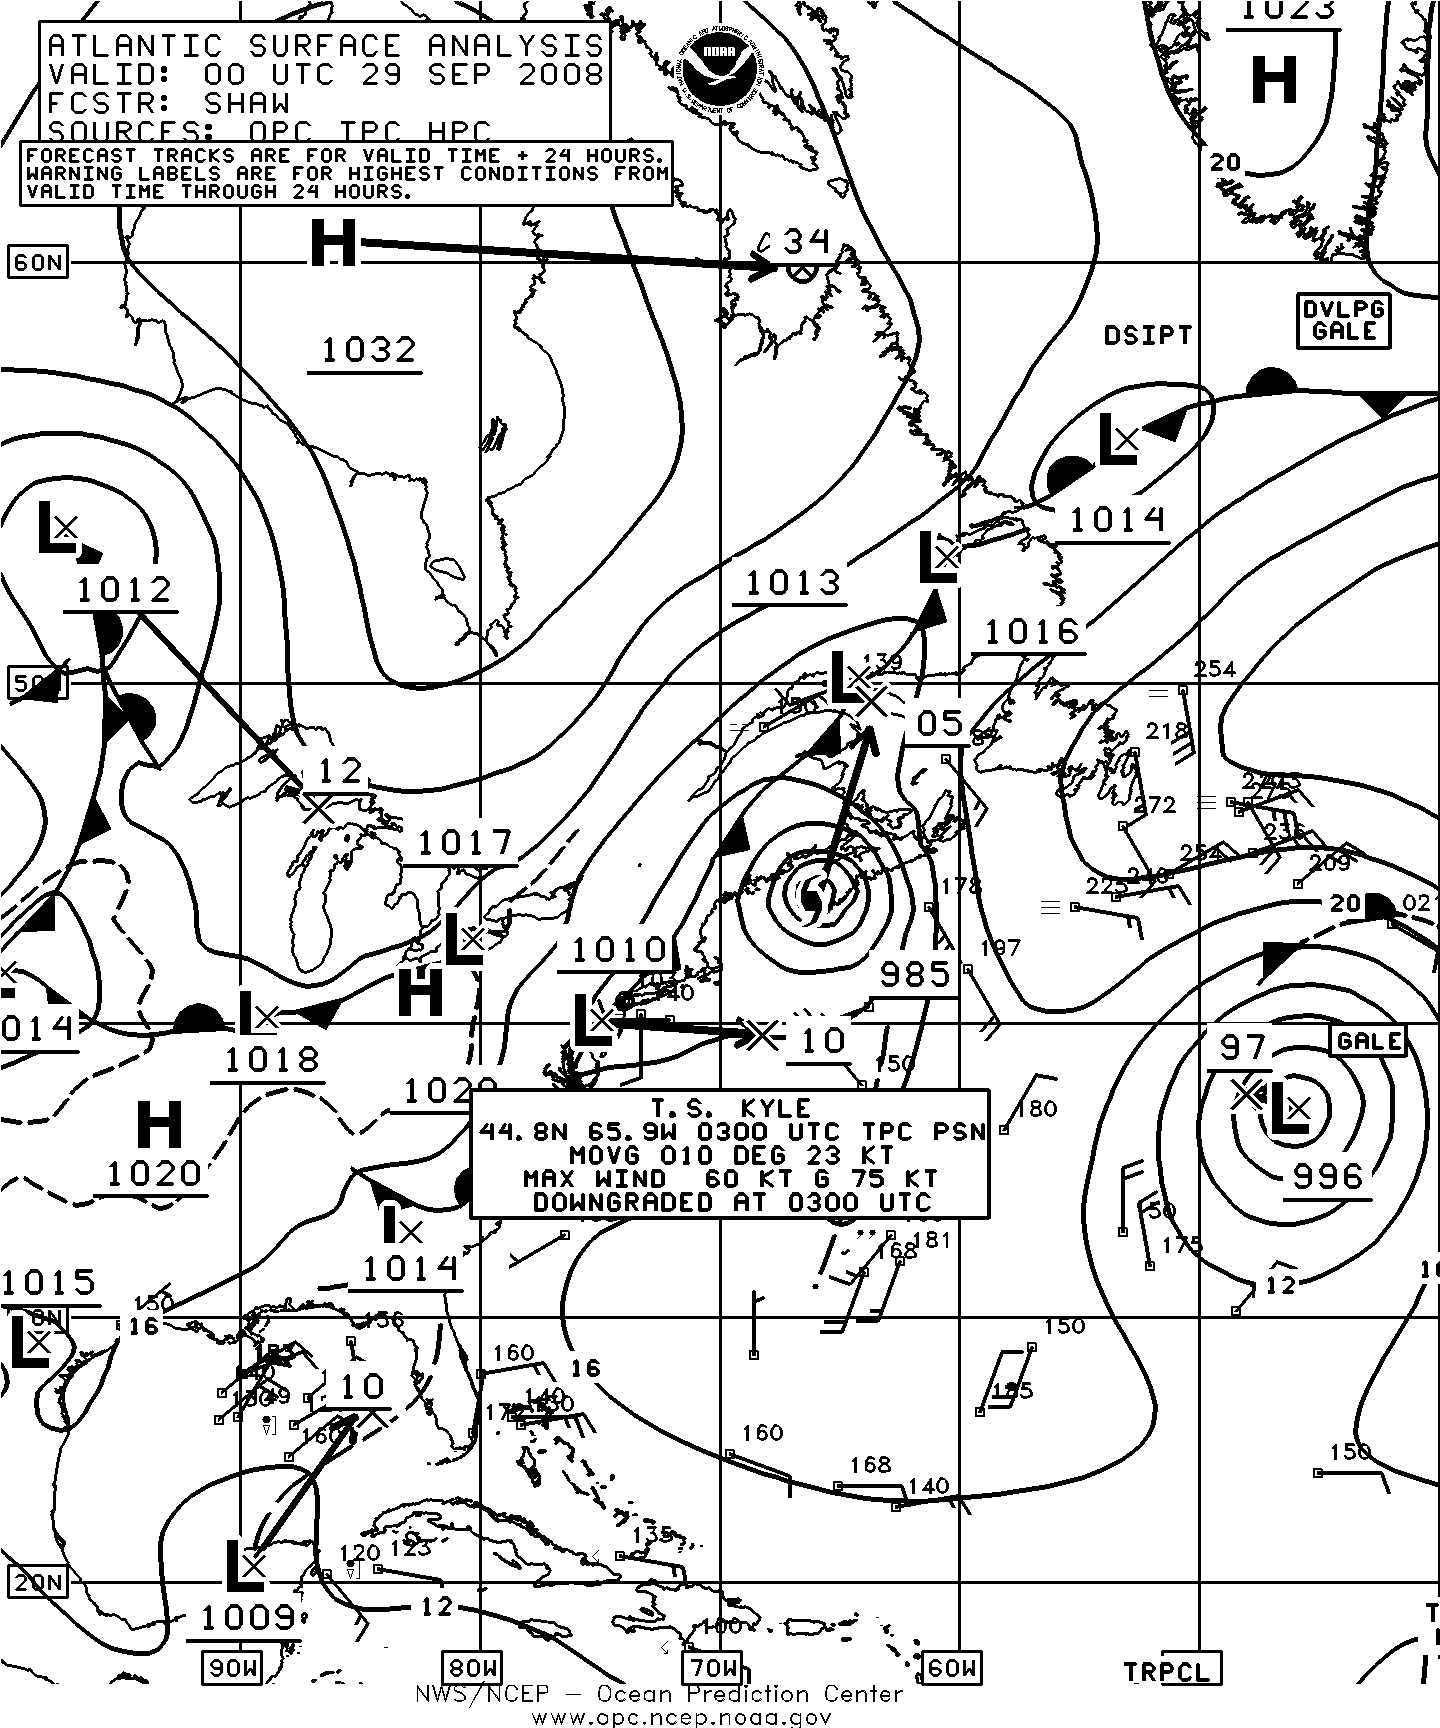
Figure 1. OPC North Atlantic Surface Analysis charts (Part 2 - west) valid 1200 UTC September 27 and 0000 UTC September 29, 2008, showing intensifying Tropical Storm Kyle and the westward-moving cut-off low pressure system near the eastern edge of the chart, which later became Tropical Cyclone Laura.(Click on image to enlarge)
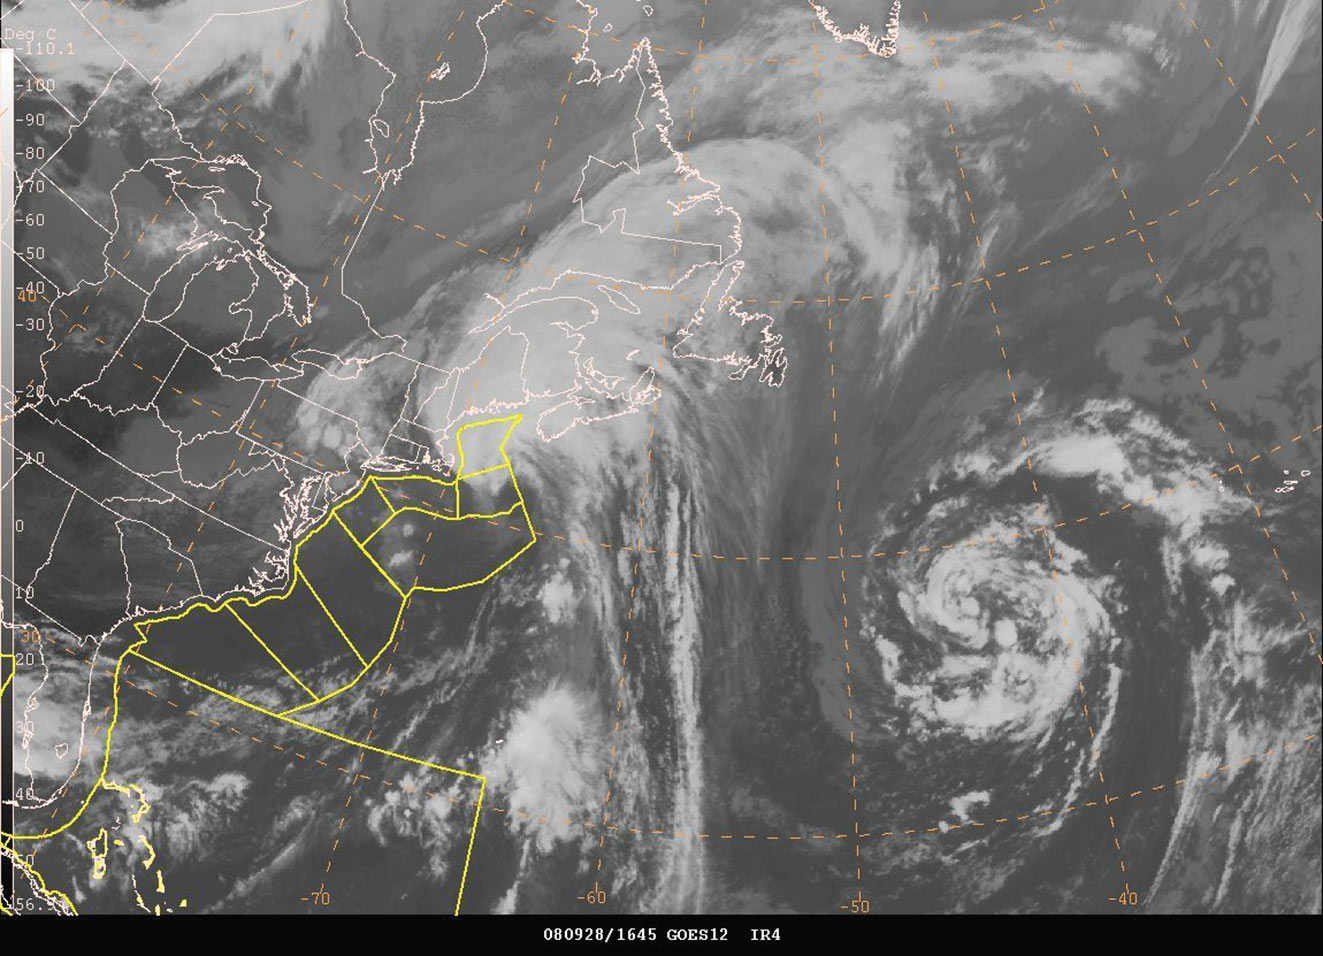
Figure 2. GOES-12 infrared satellite image valid 1645 UTC September 28, 2008 showing Hurricane Kyle east of New England and the low pressure system (southeast of Newfoundland) which later became Laura. The valid time of the image is about seven hours prior to the valid time of the second part of Figure 1. Satellite senses temperature on a scale from black (warm) to white (cold) in this type of imagery. (Click on image to enlarge)
Hurricane Kyle: Figure 1 depicts the movement of Kyle northward into OPCs marine area north of 31N as a tropical storm early on September 27. Kyle then intensified to a hurricane later that day while passing near 36N 69W and attained a maximum intensity over Georges Bank at 1500 UTC on the 28th , when its winds were 70 kts sustained with gusts to 85 kts. This intensity was Category 1 on the Saffir-Simpson scale of hurricane intensity (Reference 2). Figure 1 shows Hurricane Kyle making landfall over Nova Scotia later that day with the text box of advisory information on Kyle indicating downgrade to a tropical storm since the advisory on Kyle is based on 0300 UTC September 29, three hours later. Kyle was undergoing extratropical transition by that time as indicated in Figure 2, which reveals loss of deep cloudcover and convection on the south side and development of a comma type cloud formation common in nontropical systems. The cyclone became extratropical by the 29th as it passed over the Atlantic provinces of Canada and weakened, before dissipating late on the 30th. Selected observations taken during passage of Kyle are listed in Table 2.
| Observation | Position | Date/Time (UTC) | Wind | Seas (m/ft) |
|---|---|---|---|---|
| Star Grindanger (LAKR5) | 31N 77W | 06/0000 | SE 50 | 4.0/12 |
| Rio Lontue (A8IY6) | 38N 73W | 07/0000 | SW 45 | 9.0/29 |
| Aurora (ZCDW9) | 39N 72W 39N 73W |
07/0000 07/0100 |
S 65 S 60 |
10.0/32 8.5/28 |
| Saudi Diriyah (HZZB) | 40N 73W | 07/0600 | NW 45 | 5.0/17 |
| YM Tianjin (DDDI2) | 39N 70W | 07/1000 | W 35 | 10.0/32 |
| Dublin Express (DDSB2) | 41N 68W | 07/1200 | SW 40 | 8.0/27 |
| Buoy 41004 | 32.5N 79.1W | 06/0500 06/0500 06/0300 |
NW 39 G51 Peak gust 58 |
4.5/15 Maximum 6.5/21 |
| Buoy 41038 | 34.1N 77.7W | 06/0800 | S 35 G51 | |
| Buoy 41025 | 35.0N 75.4W | 06/1100 06/1200 |
SE 35 G47 | 6.0/20 Maximum 6.5/21 |
| Buoy 44014 | 36.6N 74.8W | 06/1900 06/1600 |
SW 33 G45 | 4.5/15 Maximum 5.0/16 |
| Buoy 44025 | 40.3N 73.2W | 07/0100 07/0000 07/0300 |
SE 29 G39 Peak gust 43 |
4.0/13 Maximum 5.0/16 |
| Buoy 44008 | 40.5N 69.4W | 07/0700 07/1000 | S 33 G43 | 4.5/15 Maximum 7.0/23 |
| Buoy 44011 | 41.1N 66.6W | 07/1400 07/1500 | SW 29 G39 | 6.5/21 Maximum 7.0/23 |
| Buoy 44141 | 43.0N 58.0W | 08/0100 08/0400 | SW 37 G45 | 4.0/13 Maximum 4.5/15 |
| Cape Lookout | 34.6N 76.4W | 06/0900 | 39 G46 | |
| (C/MAN station CLKN7) | (direction missing) | |||
| Chesapeake Light (C/MAN station CHLV2) | 36.9N 75.6W | 06/1800 | S 44 G53 | |
| Buzzards Bay (BUZM3) | 41.4N 70.9W | 07/0300 07/0900 | SE 32 G34 Peak gust NW 45 |
|
| Hibernia Platform (VEP717) | 46.7N 48.7W | 08/0600 | SW 52 | |
| GSF Grand Banks (semi-submersible YJUF7) | 46.7N 48.0W | 08/0900 | SW 41 |
| Observation | Position | Date/Time (UTC) | Wind | Seas (m/ft) |
|---|---|---|---|---|
| VRON3 | 41N 63W | 28/1800 | SE 30 | 6.5/22 |
| Sea Princess (ZCBU3) | 44N 62W | 28/2100 | SE 40 | 3.0/10 |
| Buoy 41048 | 32.0N 69.6W | 27/1300 | NE 41 G49 Peak gust 56 |
7.0/23 |
| Buoy 44011 | 41.1N 66.6W | 28/1600 28/1700 |
SE 52 G70 Peak gust 72 Pressure 987.1 hPa |
Maximum 11.0/36 |
| Buoy 44024 | 42.3N 65.9W | 28/2000 28/2200 |
S 47 G62 | 7.5/25 |
| Buoy 44038 | 43.6N 66.6W | 29/0200 29/0300 |
W 31 G39 | 7.0/23 |
| Buoy 44258 | 44.5N 63.4W | 29/0400 29/0500 |
S 33 G43 | 6.5/21 Maximum 7.0/23 |
Subtropical/Tropical Storm Laura: Initial development was as a nontropical low which originated as a frontal wave of low pressure in the central Atlantic near 36N 35W early on September 26. This low drifted northwest and intensified rapidly, developing hurricane force winds in its west semicircle by the 27th. Figure 1 shows this low drifting west into the chart area southeast of Newfoundland while at first weakening to a gale force low. Figure 3 is a view of the high resolution scatterometer winds on the north side of this low with the center just off the image near 39N 38W. Winds as high as 75 kts appear near 40N and similar winds to hurricane force extended to the southwest side of the storm center. A Jason-2 satellite altimeter pass (Figure 4) reveals numerous observations of 30 ft (9 m) or higher with 35 ft (10.5 m) near the center of the image. There was a 37 ft (11 m) observation from another satellite (Jason-1). The 54 ft (16.5 m) observation just to the south is well outside the observed range and may be due to heavy rain (E-mail communication, Sienkiewicz, Joseph, OPC, 28 September 2008). The Chiquita Belgie (C6KD7) reported a north wind of 45 kts and 7.0 m seas (22 ft) near 35N 37W at 0000 UTC on the 27th. The ship Chiquita Schweiz (C6KD9) (37N 34W) reported south winds of 35 kts and 8.0 m seas (27 ft) eighteen hours later. The infrared satellite image in Figure 2 also shows this cyclone which was undergoing subtropical transition, as TPCs National Hurricane Center named this cyclone Subtropical Storm Laura by the 29th with maximum sustained winds of 50 kts with gusts to 60 kts. Laura then completed transition to a tropical storm of the same intensity the next day, the 30th, as the center passed near 41N 49W and turned toward the north.. The cyclone became extratropical over the Grand Banks on October 1 and briefly developed hurricane force winds near the southern tip of Greenland late on October 2 before turning east toward Great Britain and weakening to a gale late on the 3rd. The remnant of Laura then became absorbed by another low on October 4.
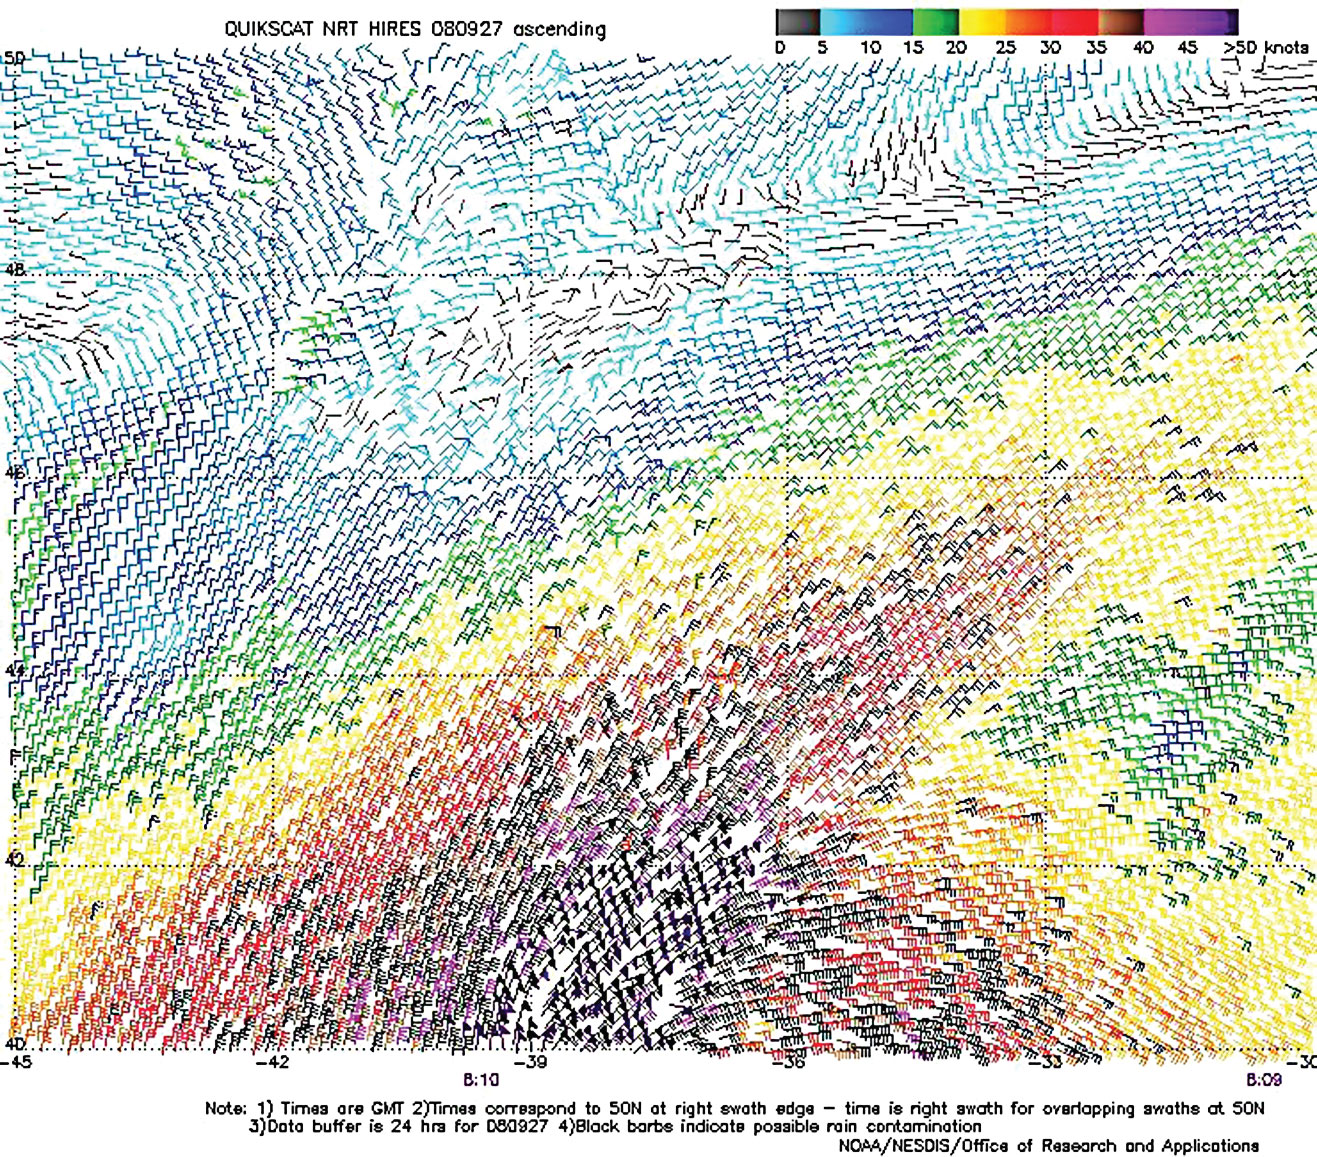
Figure 3. High resolution QuikSCAT scatterometer image of satellite-sensed winds around the north side of the hurricane force low with the center just off the chart in the first part of Figure 1. The valid time of the pass is 0810 UTC September 27, 2008 or about four hours prior to the valid time of the first part of Figure 1. The center of the storm is just off the bottom edge of the image near 38N 37W. The resolution of the image is 12.5 km versus 25 km in the standard version of the imagery. Image is courtesy of NOAA/NESDIS/Office of Research and Applications. (Click on image to enlarge)
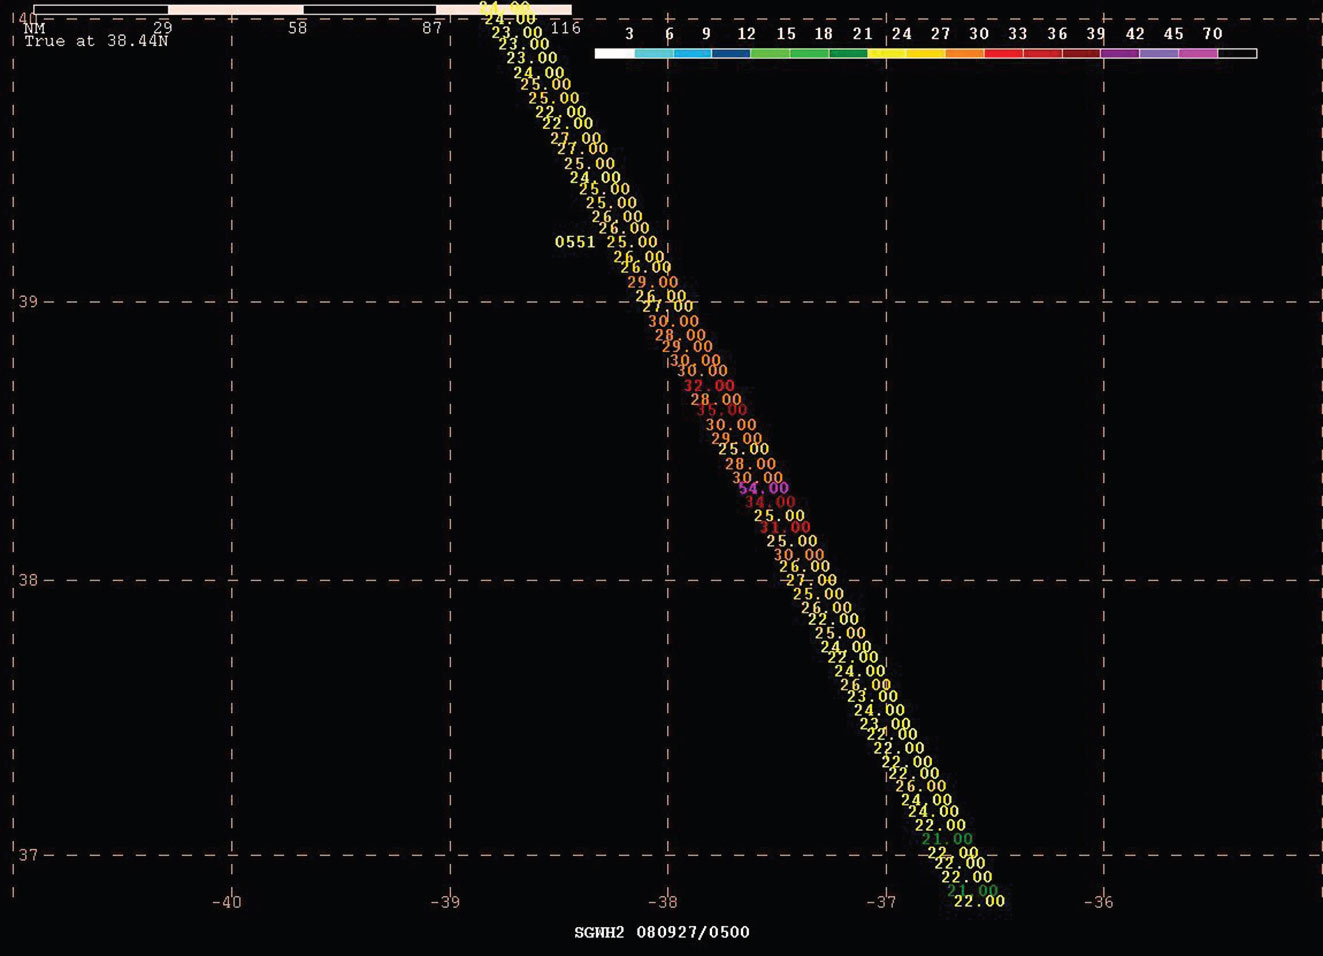
Figure 4. Jason-2 satellite altimeter pass from approximately 0550 UTC September 27, 2008. The area of interest is the western portion of the mid-Atlantic cyclone southeast of Newfoundland shown in Figure 1 and also in Figures 2 and 3. OPC classified this cyclone as a hurricane force low by 1200 UTC September 27 (Figure 1). The image shows a swath of observed wave heights (ft) along the track of the satellite. The 0551 figure to the left of the track is the time (UTC) of the satellite at that point on the track. (Click on image to enlarge)
Hurricane Omar: Hurricane Omar moved northward from the eastern Caribbean, crossing 31N near 54W late on October 17 as a weakening hurricane with maximum sustained winds of 65 kts with gusts 80 kts. Omar then turned toward the northeast and weakened to a tropical storm on the night of the 17th, and became a minimal tropical storm while passing near 33N 51W at 1500 UTC on the 18th. Omar then weakened to a remnant low later on the 18th Figure 8.
Other Significant Events of the Period
North Atlantic Storms, September 3-21: A series of cyclones, many of them developing storm force winds, tracked across the northern waters in September aside from the more significant tropical developments and the hurricane force low in the southwestern waters described below. The first of these developed over the north-central waters early on September 3 and moved southeast, developing a central pressure as low as 979 hPa near 49N 10W and storm force winds early on the 5th. The ship Oceana (ZCDN9) (49N 3W) reported south winds of 50 kts at 0500 UTC on the 5th, and seven hours later the vessel Hanjin Basel (DHPU) (46N 8W) encountered west winds of 50 kts and 6.5 m seas (21 ft). The cyclone weakened over the North Sea late on the 6th. Another developing cyclone moved out of the Davis Strait on September 6 and redeveloped as a storm just east of Greenland with a central pressure as low as 976 hPa early on the 7th. The Discovery (GLNE) near 59N 41W reported west winds of 50 kts and 9.0 m seas (30 ft) at 1200 UTC on the 7th. The cyclone stalled and weakened in that area on the 8th with its winds weakening to gale force. The next system developed a similar intensity just southeast of Greenland early on September 12 after moving off the Labrador coast on the 10th. In an area of sparse ship reports a high resolution QuikSCAT pass early on the 12th showed north to northwest winds to 55 kts around the west side of the cyclone, extending south from near the southern tip of Greenland. The cyclone then weakened to a gale later that day before turning north into the Denmark Strait on the 14th. The cyclone that followed took a similar track northeastward to the east of Greenland on the 15th and 16th and appeared to be the remains of Ike, a hurricane earlier in the month. The cyclone re-intensified to a storm east of Greenland with a central pressure as low as 966 hPa on the 17th before weakening north of the area on the 18th. The CSS Hudson (CGDG) near 63N 58W reported north winds of 50 kts at 2000 UTC on the 17th. A high resolution QuikSCAT pass early on the 17th revealed west winds as high as 60 kts in a swath extending east-southeast from the southern tip of Greenland, a weaker version of the December event depicted in Figures 16 and 17. The next two systems tracked more north into the Davis Strait from the 17th into the 22nd with the second developing a lowest central pressure of 973 hPa near 61N 62W at 0600 UTC on the 21st. Both cyclones briefly developed storm force winds before dissipating over Greenland.
North Atlantic Storm, Greenland area, September 23-24: This major cyclone, originating near 40N 63W early on the 21st, tracked northeast and intensified, developing storm force winds over the north-central waters by the 23rd and then hurricane force winds by the 24th east of Greenland. The center developed a lowest central pressure of 973 hPa near 63N 33W at 0600 UTC on the 24th , a drop of 24 hPa in twenty-four hours. Scatterometer data available near that time revealed a pattern similar to that of the October 7-10 event Figure 7 except that the strongest winds, 75 kts, were on the northwest side in the Denmark Strait. The winds diminished to below hurricane force as the cyclone moved north of the area by the 25th.
Southwestern North Atlantic Storm, September 23-25: The development of this small and relatively compact non-tropical low on a stationary front is shown in Figure 5. Hurricane force winds developed northwest of the center where the Gulf Stream is found, early on the 24th and lasted until early on the 25th while the cyclone drifted west. The ship WDB9444 (35N 75W) repored north winds of 45 kts at 2000 UTC September 23, followed by a report of northeast winds of 45 kts near 37N 75W at 1200 UTC on the 25th. This was the strongest wind reported by a ship. Another ship, Spiegelgracht (PCEO) (31N 78W) encountered north winds of 40 kts and 8.5 m seas (28 ft) at 0000 UTC on the 24th . The buoy 41036 (34.2N 77W) reported a northeast wind of 40 kts and 4.5 m seas (14 ft) at 0900 UTC on the 25th. A high resolution QuikSCAT pass from early on the 25th showed north to northeast winds as high as 70 kts southeast of Cape Fear near the Gulf Stream, similar to the October 18-19 event Figure 9. The system subsequently developed a central pressure as low as 990 hPa near Cape Fear late on the 25th before weakening inland, but winds started diminishing before then on the 25th.
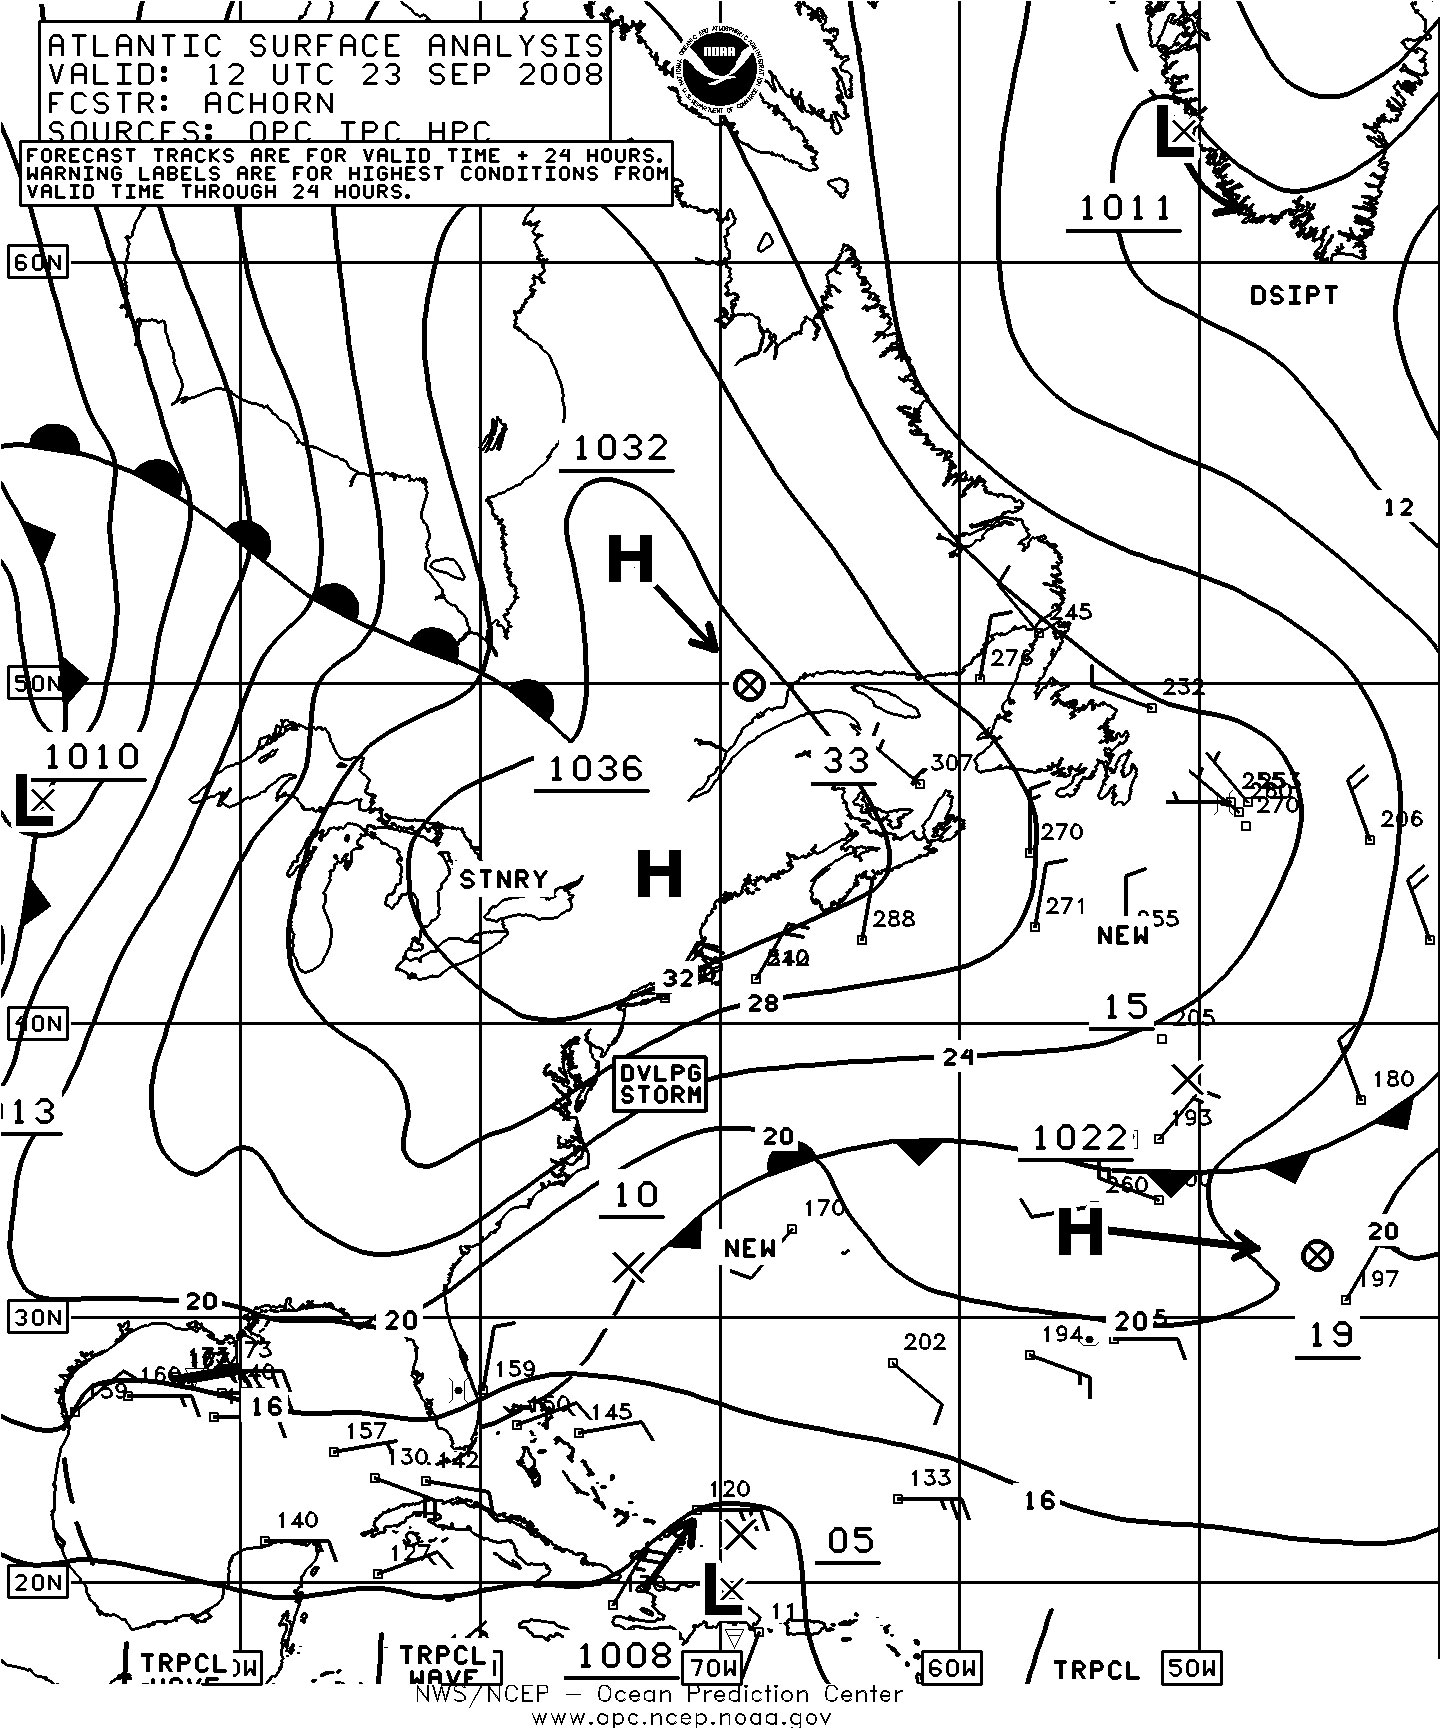
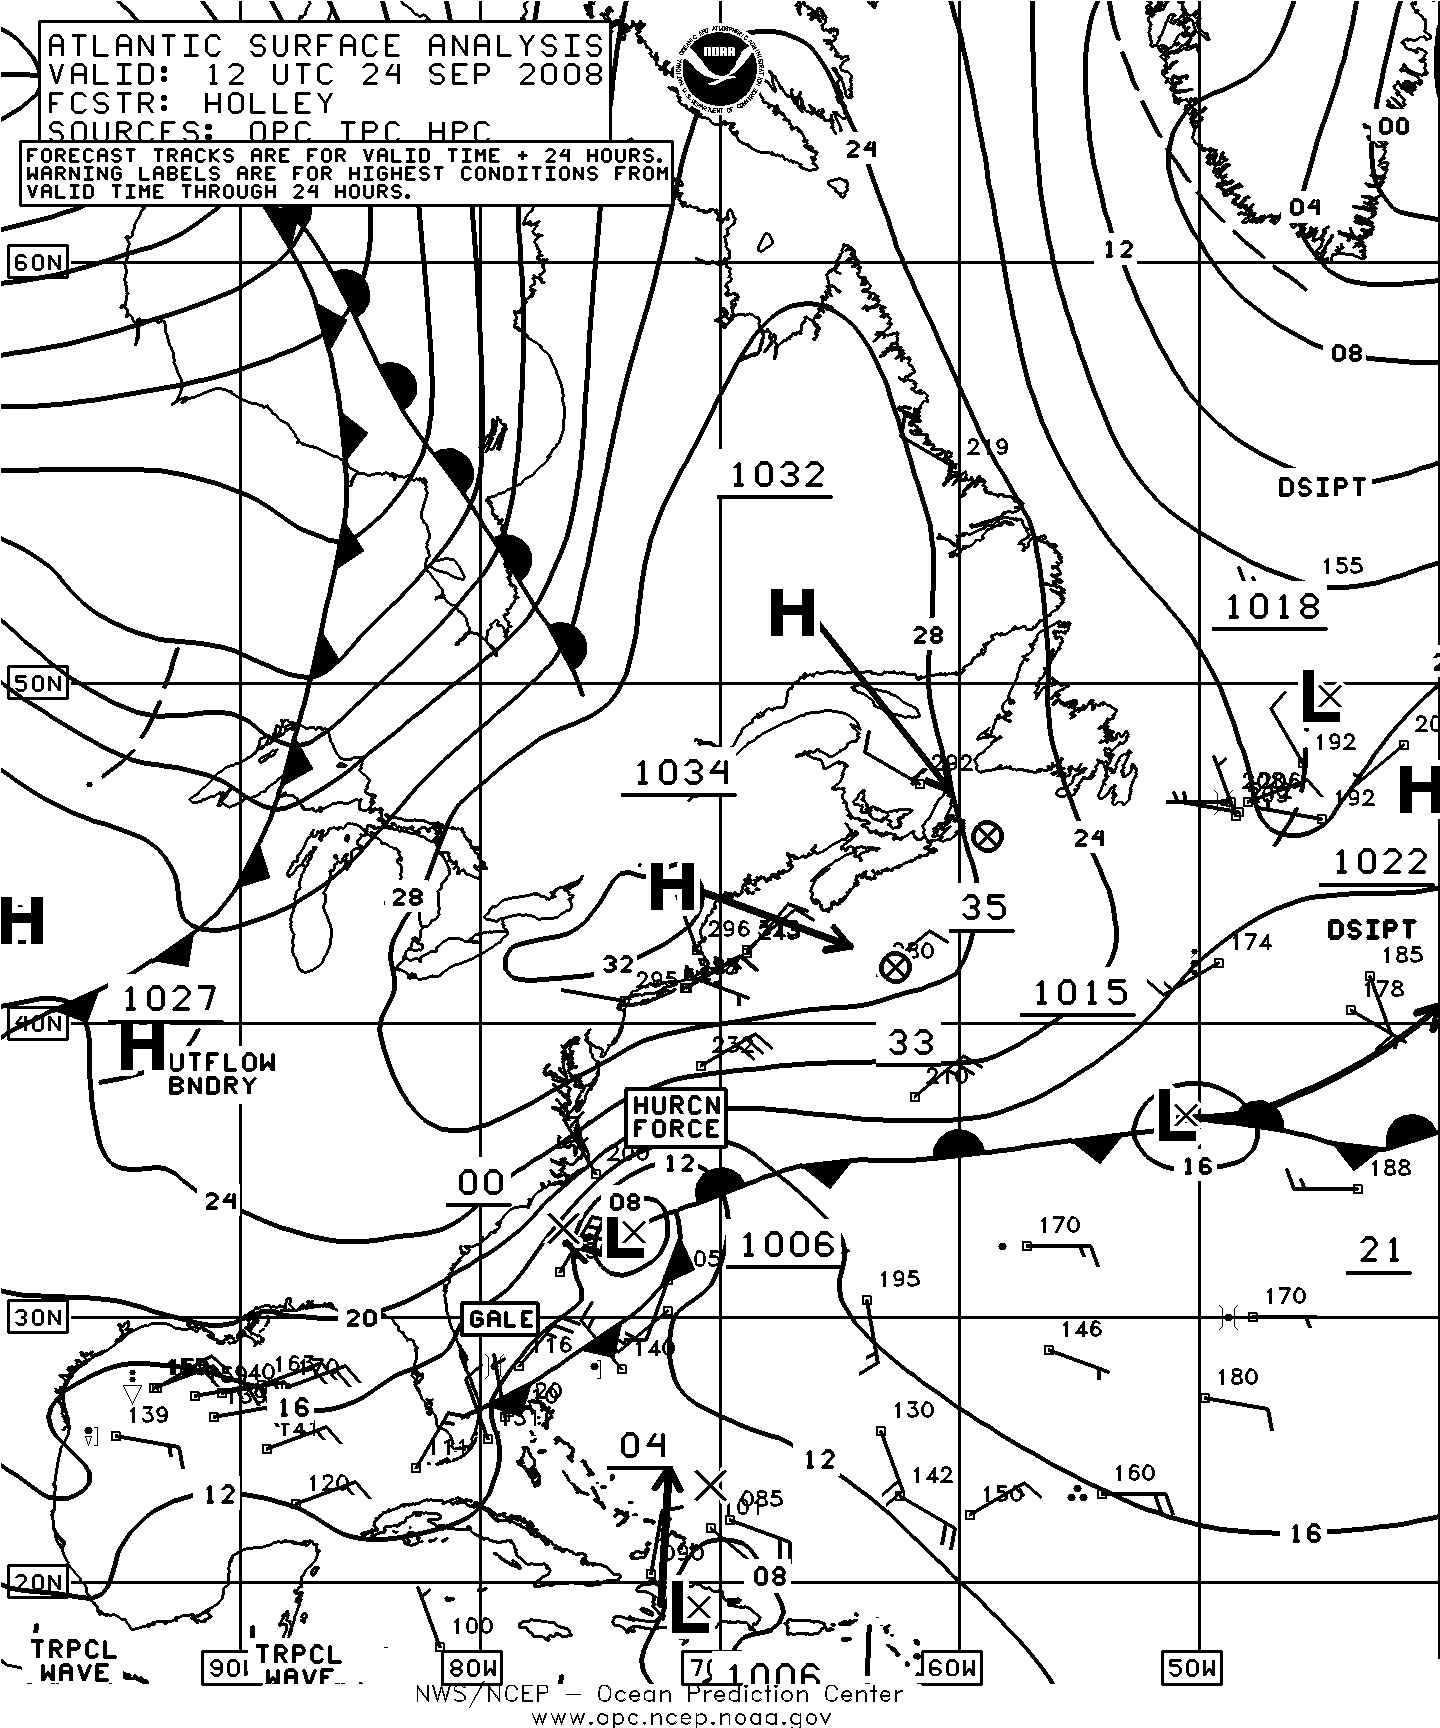
Figure 5. OPC North Atlantic Surface Analysis charts (Part 2) valid 1200 UTC September 23 and 24, 2008. (Click on image to enlarge)
Greenland Storm, October 6-7: This cyclone briefly formed east of Greenland by October 7 and was similar to the September 23-24 storm in that area. This cyclone was short-lived, quickly becoming absorbed by the much stronger system coming from the south, to be described below.
North Atlantic Storm, October 7-10: The development of the second most intense cyclone of the period is depicted in Figure 6. The central pressure fell an impressive 42 hPa in the twenty-four hour period ending at 1800 UTC on the 8th. The strongest winds occurred near the time of maximum intensity, 946 hPa (27.94 inches). The QuikSCAT data in Figure 7 show numerous observations in the 60 to 75 kts range in the south semicircle of the cyclone, and winds approaching hurricane force on the northwest side. The strongest wind report from a ship was northeast 50 kt, from Arni Fridriksson (TFNA) (66N 27W) at 2100 UTC on the 9th. The Iceland coastal station TFSRT (64N 20W) reported seas as high as 11.5 m (38 ft) at that time. The buoy 64045 (59.1N 11.7W) reported southwest winds of 25 kts but seas up to 11.5 m (37 ft) one hour later. The cyclone subsequently moved northeast while weakening, passing northeast of Iceland by the 11th.

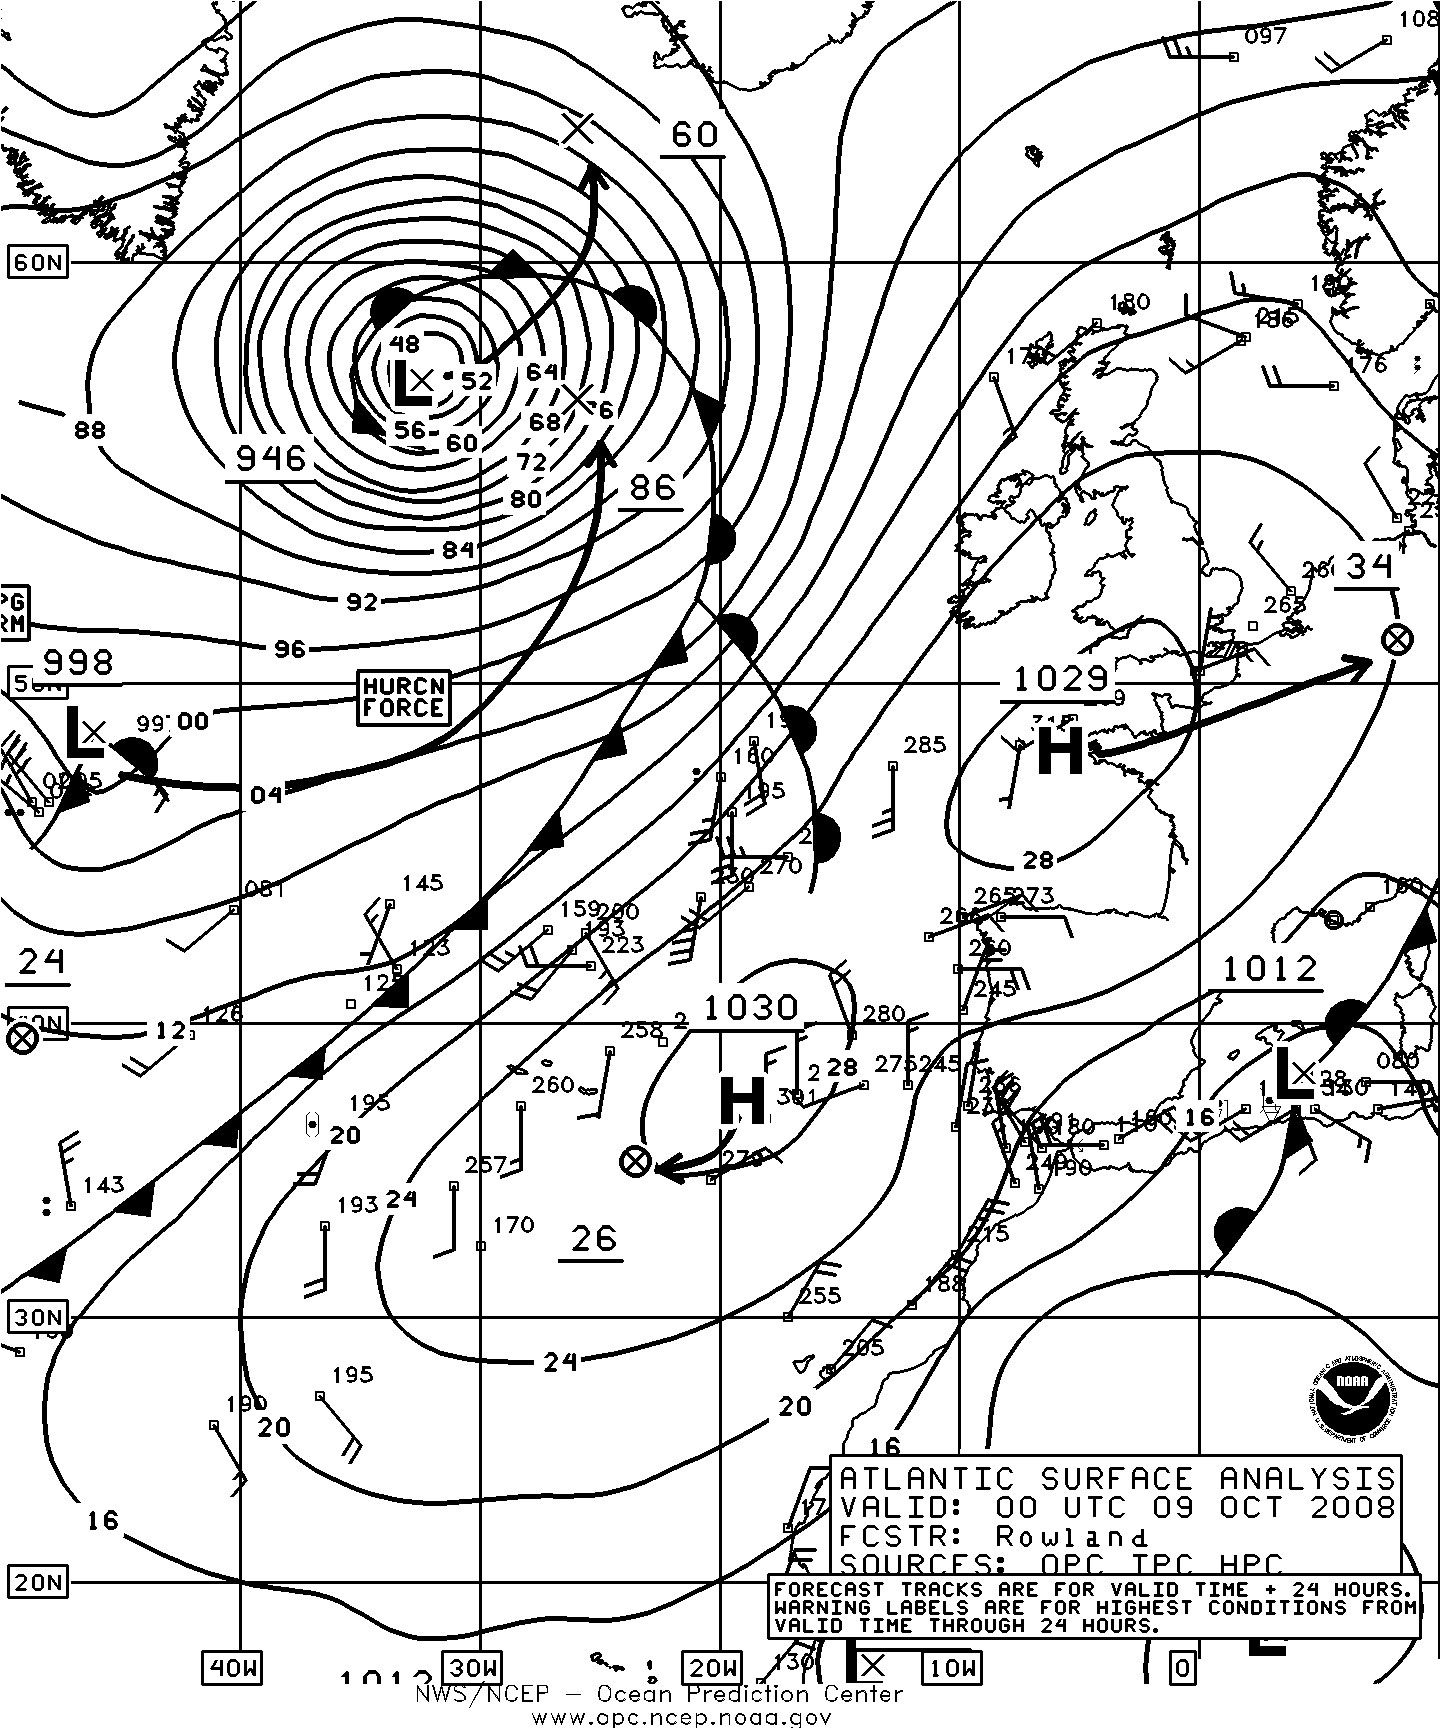
Figure 6. OPC North Atlantic Surface Analysis charts valid 1200 UTC October 7 (Part 2 west) and 0000 UTC October 9, 2008 (Part 1 east). (Click on image to enlarge)

Figure 7. High resolution QuikSCAT scatterometer image of satellite-sensed winds around the storm shown in Figure 6. The valid time of the pass is 2211 UTC September 8, 2008, or about two hours prior to the valid time of the second part of Figure 6. The center of the storm is near 57N 35W in the upper right portion of the image. The southern tip of Greenland appears in the upper-left corner of the image. Image is courtesy of NOAA/NESDIS/Office of Research and Applications. (Click on image to enlarge)
Northwest Atlantic Storm of October 14-16: A large cyclone over northeastern Canada moved into the northern Labrador Sea on the 15th, briefly developing hurricane force winds from the west and northwest over the Labrador Sea, up to 65 kts in a high resolution QuikSCAT pass from late on October 15. The lowest central pressure was 964 hPa near 61N 59W at 1800 UTC on the 15th. The cyclone then dissipated over Greenland while a new storm force low formed east of Greenland on the 16th and moved northeast, passing northwest of Iceland on the 17th.
North Atlantic Storm, October 18-24: The initial rapid development of this cyclone off the U.S. East Coast is shown in Figure 8, as two frontal waves of low pressure consolidated into a compact hurricane force low over a twenty-four hour period. The scatterometer data in Figure 9 reveal hurricane force northeast winds of up to 75 kts although some of the data may be affected by heavy rain. Part of New Jersey is in the upper left corner of the figure. This area of strong winds is near the Gulf Stream. Another QuikSCAT pass from later that day showed some winds to 60 kts wrapping around to the south side as the cyclone intensified, but data on the northwest side was missing. The cyclone then moved northeast and developed a central pressure of 988 hPa late on the 20th near 40N 63W but by then its strongest winds were down to storm force. The system passed east of the Grand Banks by the 22nd and redeveloped northeastward, finally passing east of Iceland by the 24th. This later merged with other lows in the Greenland-Iceland area to form an intense 938 hPa (27.70 inches) low north of Iceland near 70N at 1200 UTC October 24, as analyzed by the UKMET office in Exeter, U.K. This was the deepest low of the period in either ocean. Some notable observations taken in the storm are listed in Table 3.
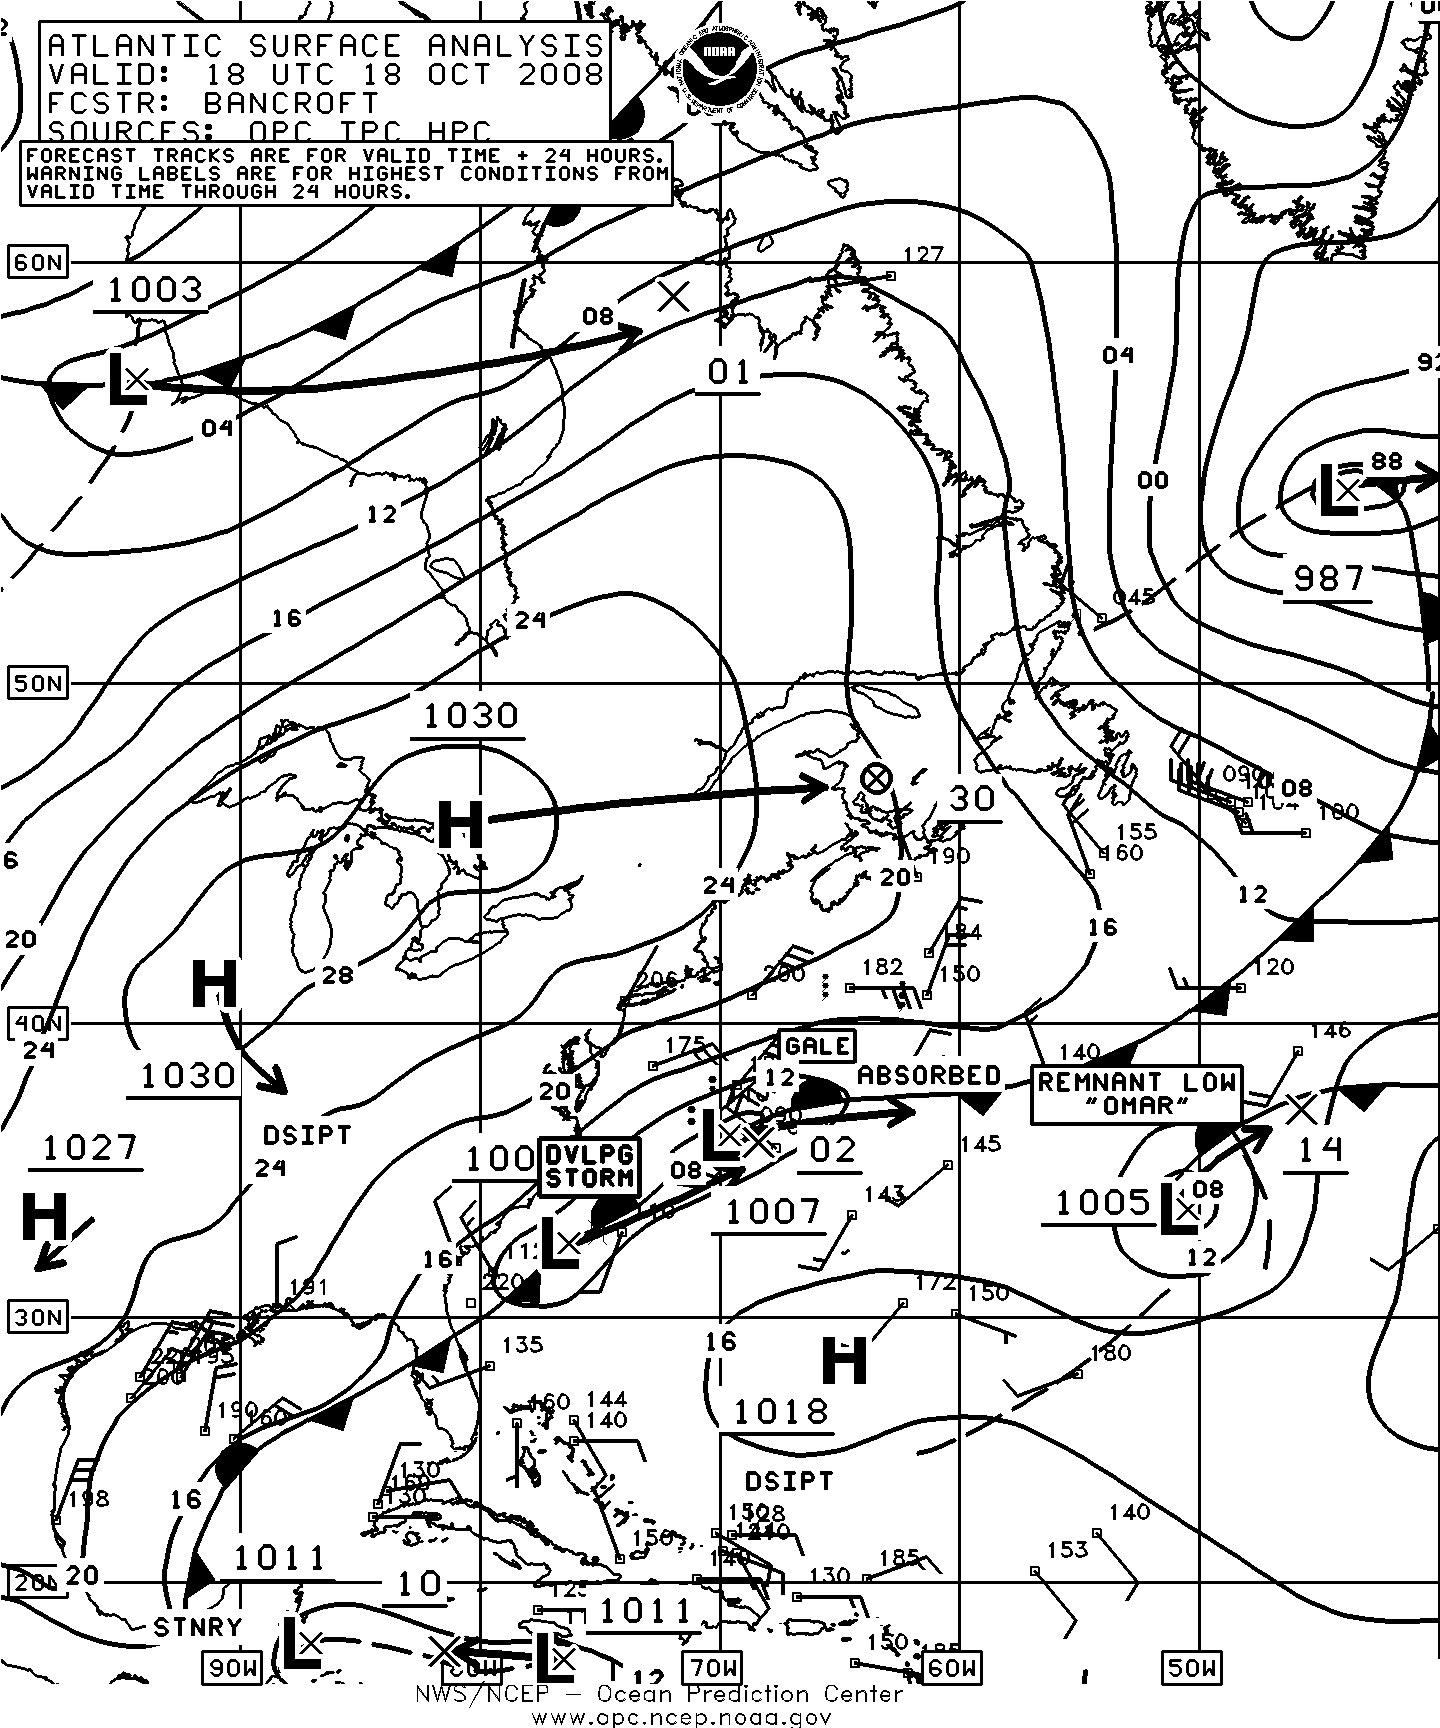
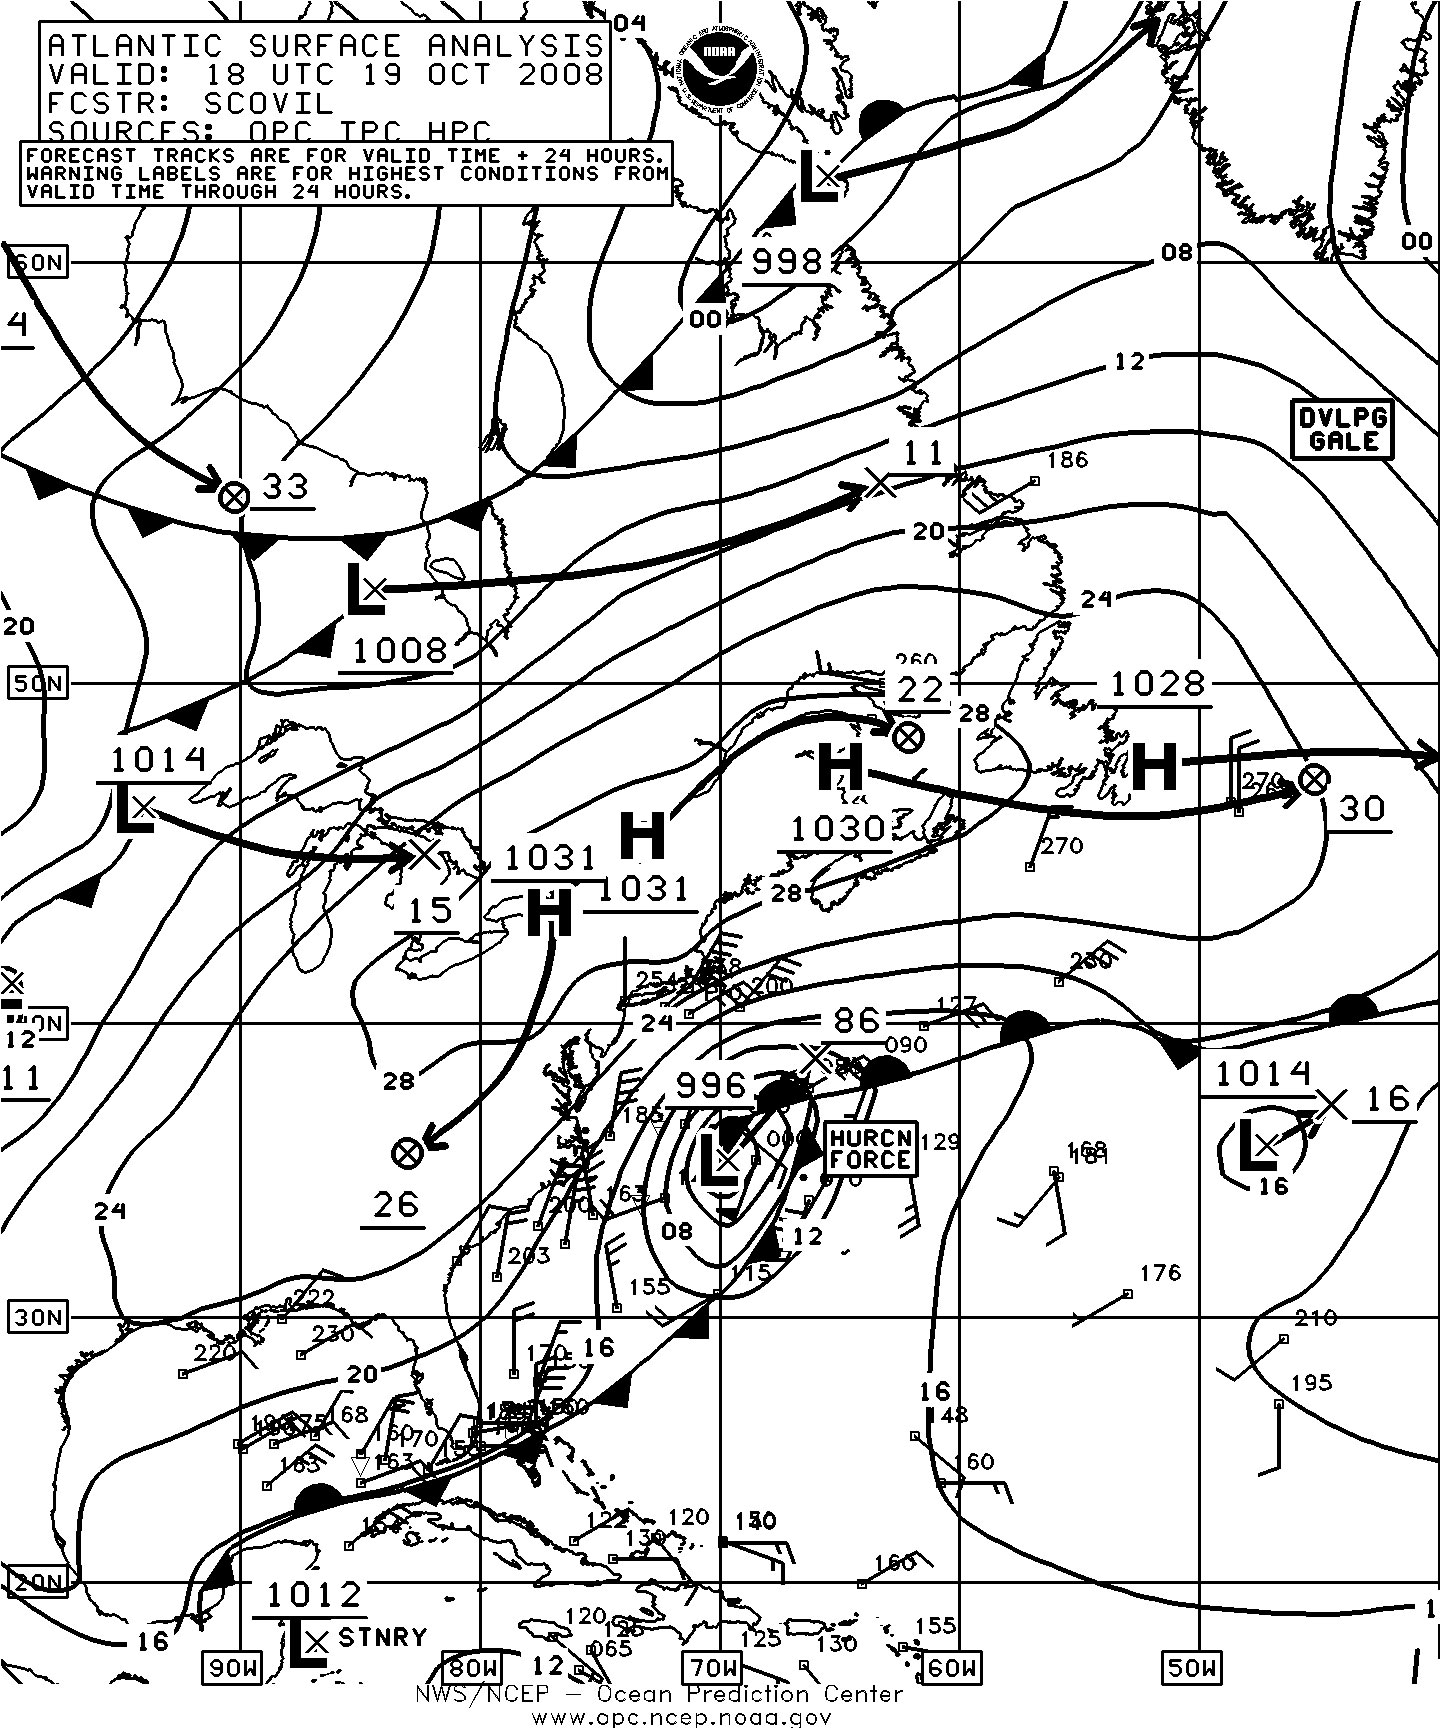
Figure 8. OPC North Atlantic Surface Analysis charts (Part 2) valid 1800 UTC October 18 and 19, 2008.(Click on image to enlarge)

Figure 9. Figure 9. High-resolution QuikSCAT scatterometer image of satellite-sensed winds around the storm shown in Figure 8. The valid time of the pass is 1017 UTC October 19, 2008, or less than eight hours prior to the valid time of the second part of Figure 8. The center of the storm, not well-defined, is near 36N 71W in the left-center portion of the image. Image is courtesy of NOAA/NESDIS/Office of Research and Applications.(Click on image to enlarge)
| Observation | Position | Date/Time (UTC) | Wind | Seas (m/ft) |
|---|---|---|---|---|
| C6FT7 | 38N 71W | 19/0000 | NE 35 | 7.5/24 |
| PHAQ | 39N 69W | 19/1200 | N 40 | 6.0/19 |
| C6OY4 | 39N 72W 42N 68W |
19/1200 20/1200 |
NE 40 NE 40 |
8.0/26 9.0/30 |
| WCZ5528 | 37N 71W | 19/1800 | NE 35 | 10.5/35 |
| C6SE4 | 36N 68W | 19/1800 | SW 50 | 8.0/26 |
| DDSC2 | 39N 75W | 20/0000 | N 35 | 11.5/37 |
| ZCDV2 | 40N 70W | 20/0200 | NE 50 | 6.5/21 |
| Buoy 44011 | 41.1N 66.6W | 20/1100 | NE 35 | 8.0/27 |
| Buoy 44754 | 42.3N 55.5W | 20/0900 | E 40 | |
| Hibernia Platform (VEP717) | 46.7N 48.7W | 22/0900 22/1200 |
NW 55 | 6.5/21 Maximum 7.5/25 |
| GSF Grand Banks (YJUF7) | 46.7N 48.0W | 22/1200 | NW 60 | 7.5/24 |
North Atlantic Storm, October 17-20: The development of this cyclone at about the same time as the preceding event is depicted in Figure 10. It originated south of Newfoundland near 40N early on the 17th. The cyclone developed hurricane force winds on the northwest side late on the 19th as shown by the scatterometer winds in Figure 11. The cyclone was south of Iceland at the time with the strongest winds in the northeast flow between the cyclone center and Iceland, up to 70 kts. The second part of Figure 10 shows the cyclone with its lowest central pressure before it passed north of the area late on the 20th. The ship Arni Fridriksson (TFNA) (66N 13W) reported northwest winds of 55 kts at 1200 UTC on the 21st. The buoy 64049 (54.4N 10.9W) reported a southwest wind of 45 kts and 7.5 m seas (25 ft) at 0700 UTC on the 19th, followed three hours later by a report of south winds 40 kts and 12.0 m seas (39 ft). The buoy 64071 (68.5N 9.3W) reported a north wind of 30 kts and 13.0 m seas (42 ft) at 0200 UTC on the 21st followed two hours later by a report of 14.0 m seas (46 ft).
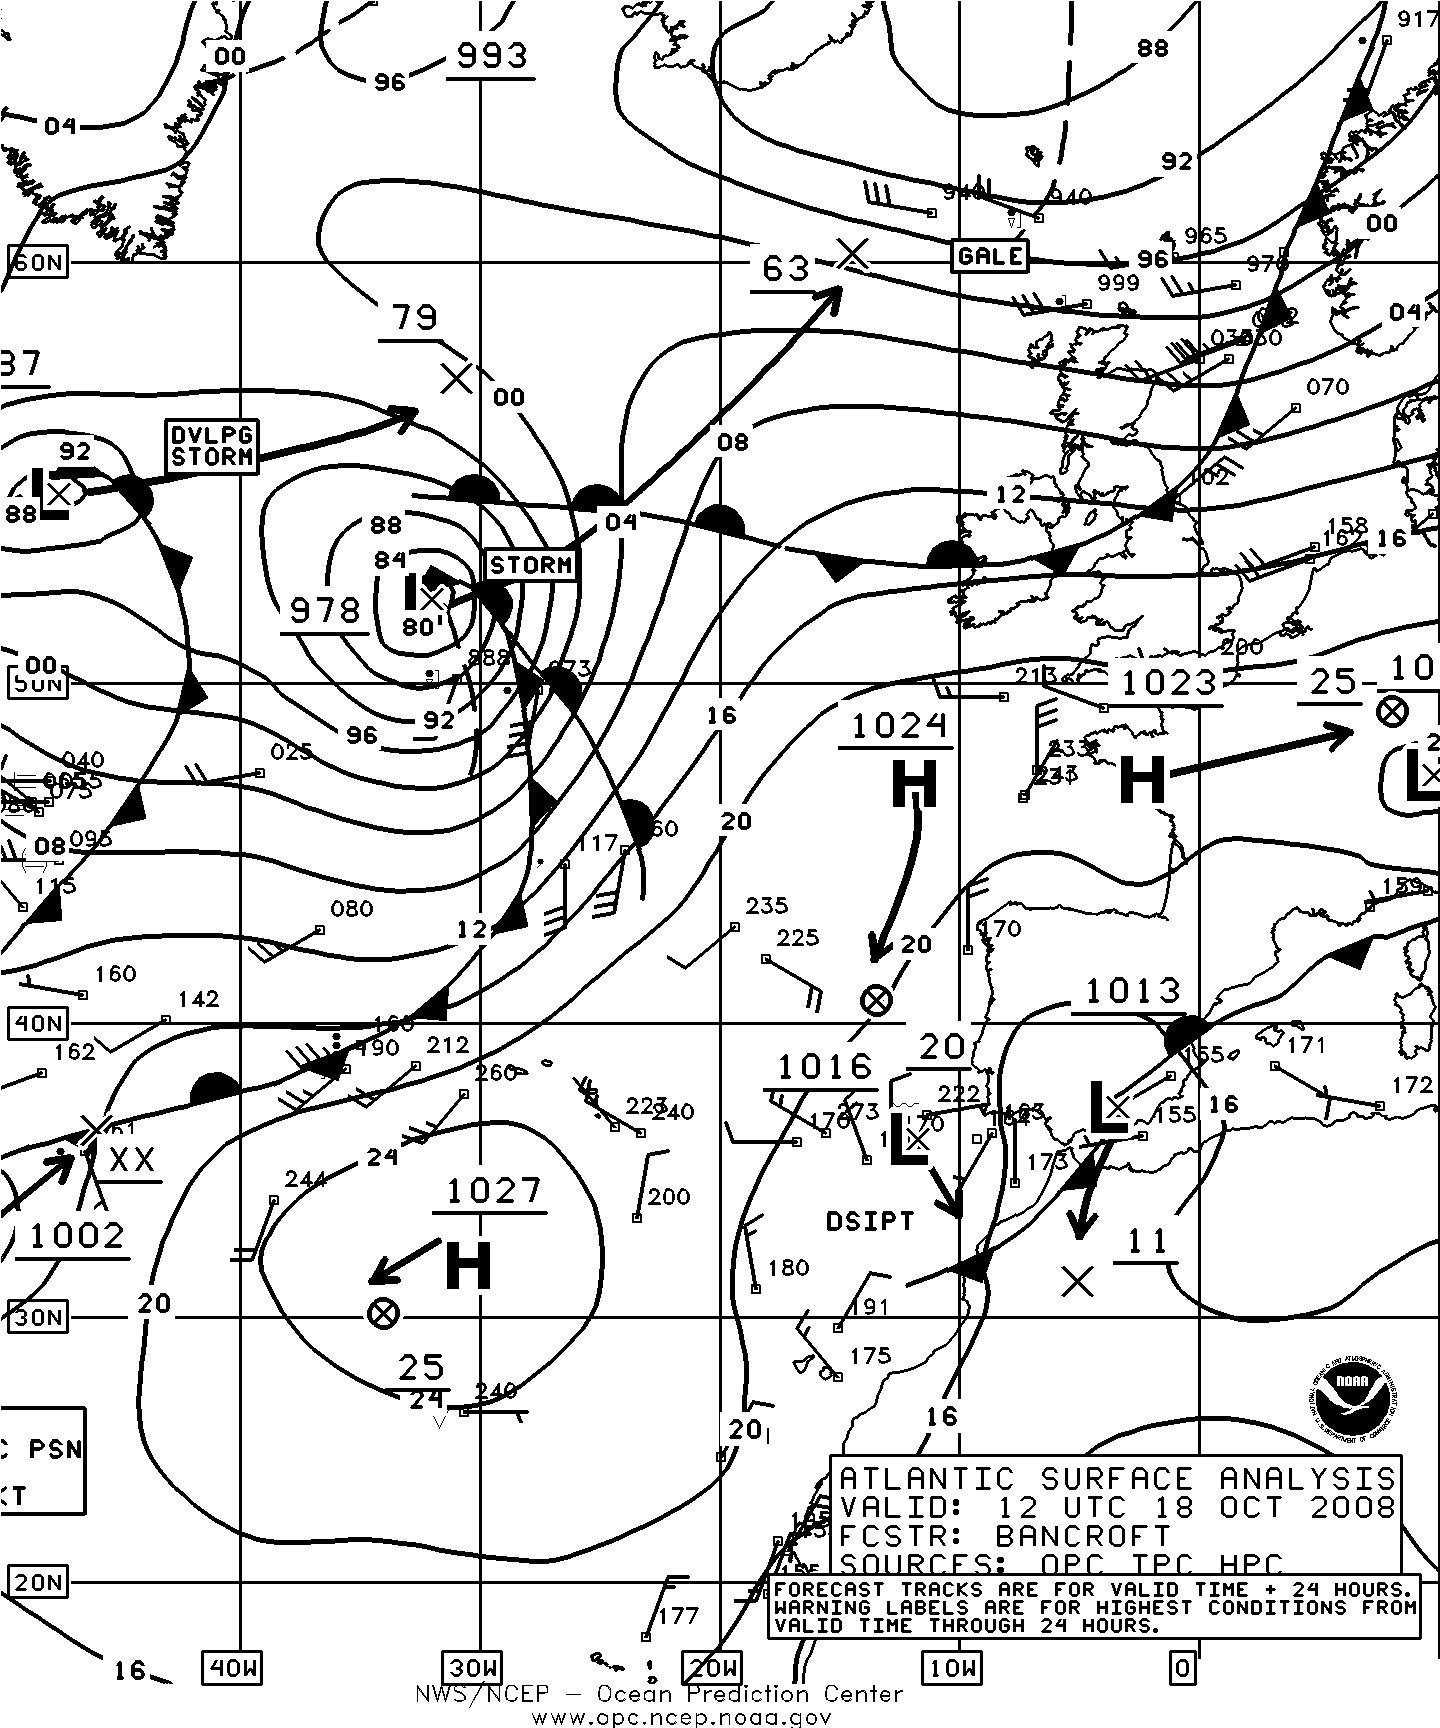
Figure 10. OPC North Atlantic Surface Analysis charts (Part 1) valid 1200 UTC October 18 and 20, 2008.(Click on image to enlarge)

Figure 11. High resolution QuikSCAT scatterometer image of satellite-sensed winds around the storm shown in Figure 10. The valid time of the pass is 1902 UTC October 19, 2008, or about seventeen hours prior to the valid time of the second part of Figure 10. The center of the storm appears southeast of Iceland near 62N 13W in the lower left side of the image. Image is courtesy of NOAA/NESDIS/Office of Research and Applications. (Click on image to enlarge)
North Atlantic Storm, Greenland-Iceland area, October 21-24: A developing storm formed east of Greenland on October 21st, briefly developing hurricane force winds neaar the southern tip of Greenland early on the 22nd. This was joined by another developing cyclone approaching Iceland from the south later that day and a third originating from east of New England late on the 23rd, to form the intense 938 hPa cyclone mentioned previously, at 1200 UTC October 24. Hurricane force winds in the Iceland area shifted to mainly north of Iceland by the 24th with a high resolution QuikSCAT image showing north winds to 70 kts north of Iceland. The ship Arni Fridriksson (TFNA) (64N 11W) reported west winds of 60 kts at 0900 UTC on the 24th. Polarfront (LDWR) near 66N 2E reported southwest winds of 50 kts and 6.0 m seas (19 ft) at 0200 UTC on the 24th. The buoy 64071 (68.5N 9.1W) reported highest seas of 11.5 m (37 ft) at 0500 UTC on the 25th.
North Atlantic Storm, November 3-5: Originating south of Newfoundland early on the 2nd, this system rapidly intensified while passing northeast over the North Atlantic with the central pressure dropping 34 hPa in the 24-hour period ending at 1200 UTC on the 4th. The cyclone passed between Greenland and Iceland with a 956 hPa central pressure late on the 4th before weakening rapidly near the Greenland coast on the 5th. Hurricane force winds accompanied this low from late on the 3rd until early on the 5th. QuikSCAT imagery from early on October 4 revealed winds of 50 to 75 kts on the south and west sides, similar to Figure 7 (October 7-10 event). The ship Arnarfell (OZ2048) (63N 21W) reported southeast winds of 40 kts at 0300 UTC on the 5th.
Northeast Atlantic Storm, November 7-10: This cyclone developed from a frontal wave of low pressure over the north-central waters early on the 7th and tracked northeast, developing hurricane force winds when passing northwest of Ireland on the 8th. High resolution QuikSCAT imagery from late on the 8th showed a swath of west to northwest winds of 50 to 70 kts on the south and west sides. The lowest central pressure was 956 hPa early on the 9th before the cyclone turned southeast into the North Sea, where it weakened rapidly by the 11th. The ship Finnfighter (SBFC) (55N 12W) reported southwest winds of 45 kts at 1800 UTC on the 8th. The buoy 64049 (54.3N 10.9W) reported southwest winds of 40 kts and 10.5 m seas (35 ft) at 1600 UTC on the 8th.
Western Atlantic Storm, November 21-22: This cyclone developed quickly from a frontal wave of low pressure near the southeast U.S. coast as shown in Figure 12 with the central pressure falling 32 hPa in the twenty-four hour period ending at 0600 UTC on the 22nd. The cyclone appears well defined in high resolution scatterometer imagery as shown in Figure 13. Hurricane force winds are mainly on the north side. The ship Safmarine Nyassa (2AJI3) ( 38N 69W) reported north winds of 60 kts and 6.0 m seas (19 ft) at 0000 UTC November 22, and CSCL Barcelona (V2OH3) (41N 64W) encountered southwest winds of 60 kts and 7.5 m seas (24 ft) six hours later. At 1200 UTC on the 22nd the Antwerpen Express (DGAF) reported south winds of 45 kts and 9.0 m seas (30 ft). The cyclone subsequently weakened to a gale over the Canadian Atlantic provinces late on the 22nd before redeveloping in the Labrador Sea, where it weakened on the 24th.
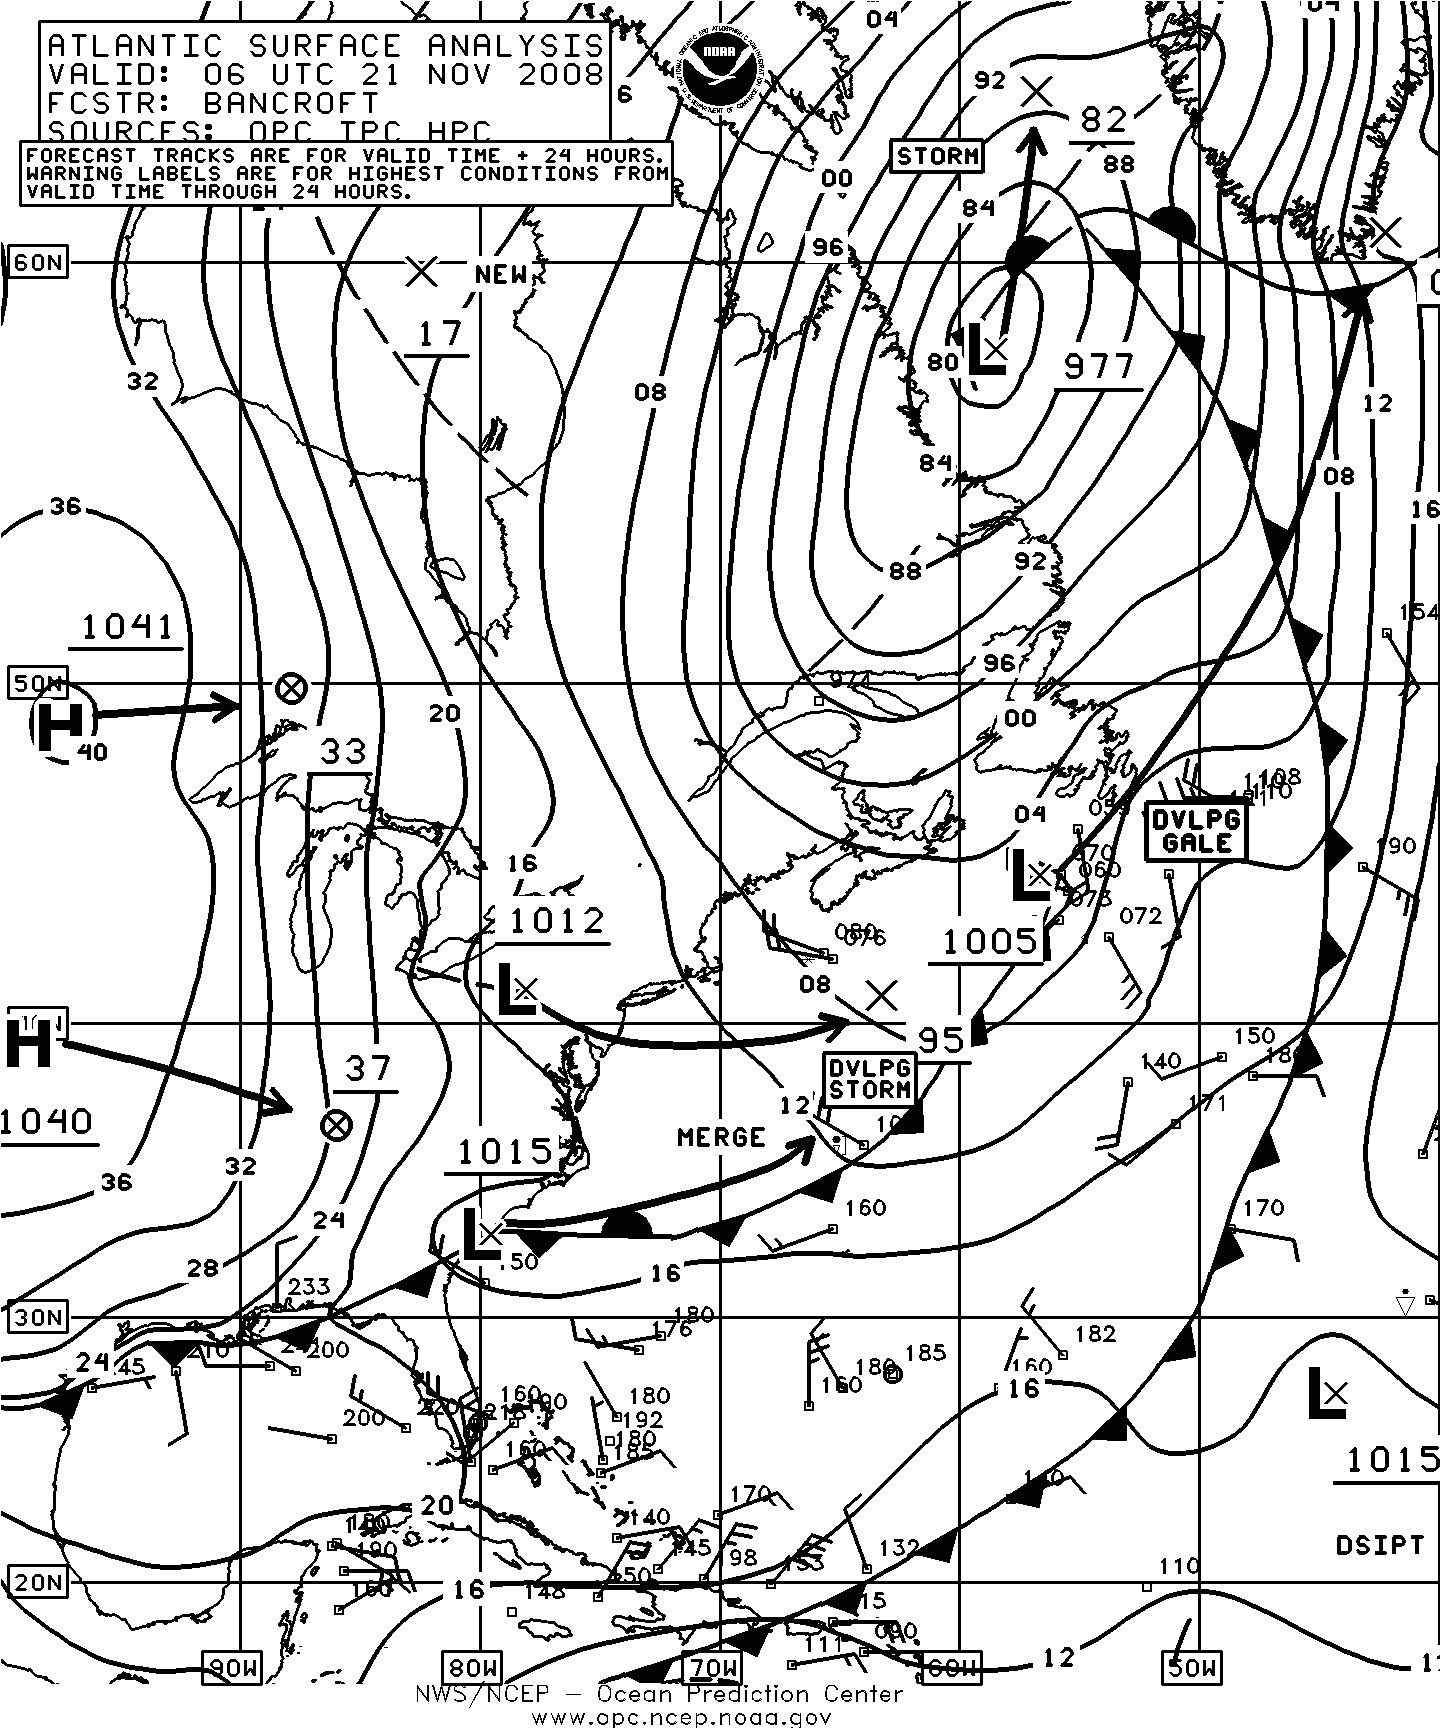
Figure 12. OPC North Atlantic Surface Analysis charts (Part 2) valid 0600 UTC November 21 and 22, 2008.(Click on image to enlarge)

Figure 13. High resolution QuikSCAT scatterometer image of satellite-sensed winds around the storm shown in Figure 12. The valid time of the pass is 2316 UTC November 21, 2008, or about seven hours prior to the valid time of the second part of Figure 12. The center of the storm is near 37N 69W in the upper-left portion of the image. Image is courtesy of NOAA/NESDIS/ Office of Research and Applications.(Click on image to enlarge)
Northwestern Atlantic Storm, November 29 December 1: This developing storm originated in the southwestern waters and tracked north across Newfoundland late on November 29, and became a hurricane force cyclone in the northern Labrador Sea late on the 30th . High resolution QuikSCAT data from early on December 1 revealed southeast to south winds 50 to 65 kts on the east side. The system then weakened to a gale in the Davis Strait late on December 1.
Western Atlantic Storm, December 7-10: This developing cyclone followed a track similar to that of the November 29-December 1 event, and is depicted in Figure 14. Initial development was rapid with the central pressure falling 36 hPa in the twenty-four hour period ending at 0000 UTC on the 8th when the center was over eastern Nova Scotia. The cyclone developed hurricane force winds late on the 8th and Figure 15 shows these winds of up to 75 kts in a swath extending southeast from the Labrador Sea near the time of the second part of Figure 14. The Hibernia Platform (VEP717, 48.7N 48.7W) reported south winds of 70 kts at 1500 UTC on the 8th while nearby Terra Nova (VCXF) reported south winds of 55 kts with its lower anemometer height. Hibernia later reported a southwest wind of 65 kts at 0000 UTC on the 9th along with 5.5 m seas (18 ft). The ship Spiegelgracht (PCEO) (45N 55W) reported southwest winds of 60 kts at 1800 UTC on the 8th. Later, at 0600 UTC on the 10th the ship Mississauga Express (ZCBP6) (49N 41W) encountered 8.5 m seas (28 ft). The cyclone subsequently moved north and weakened in the Davis Strait late on the 9th and on the 10th.
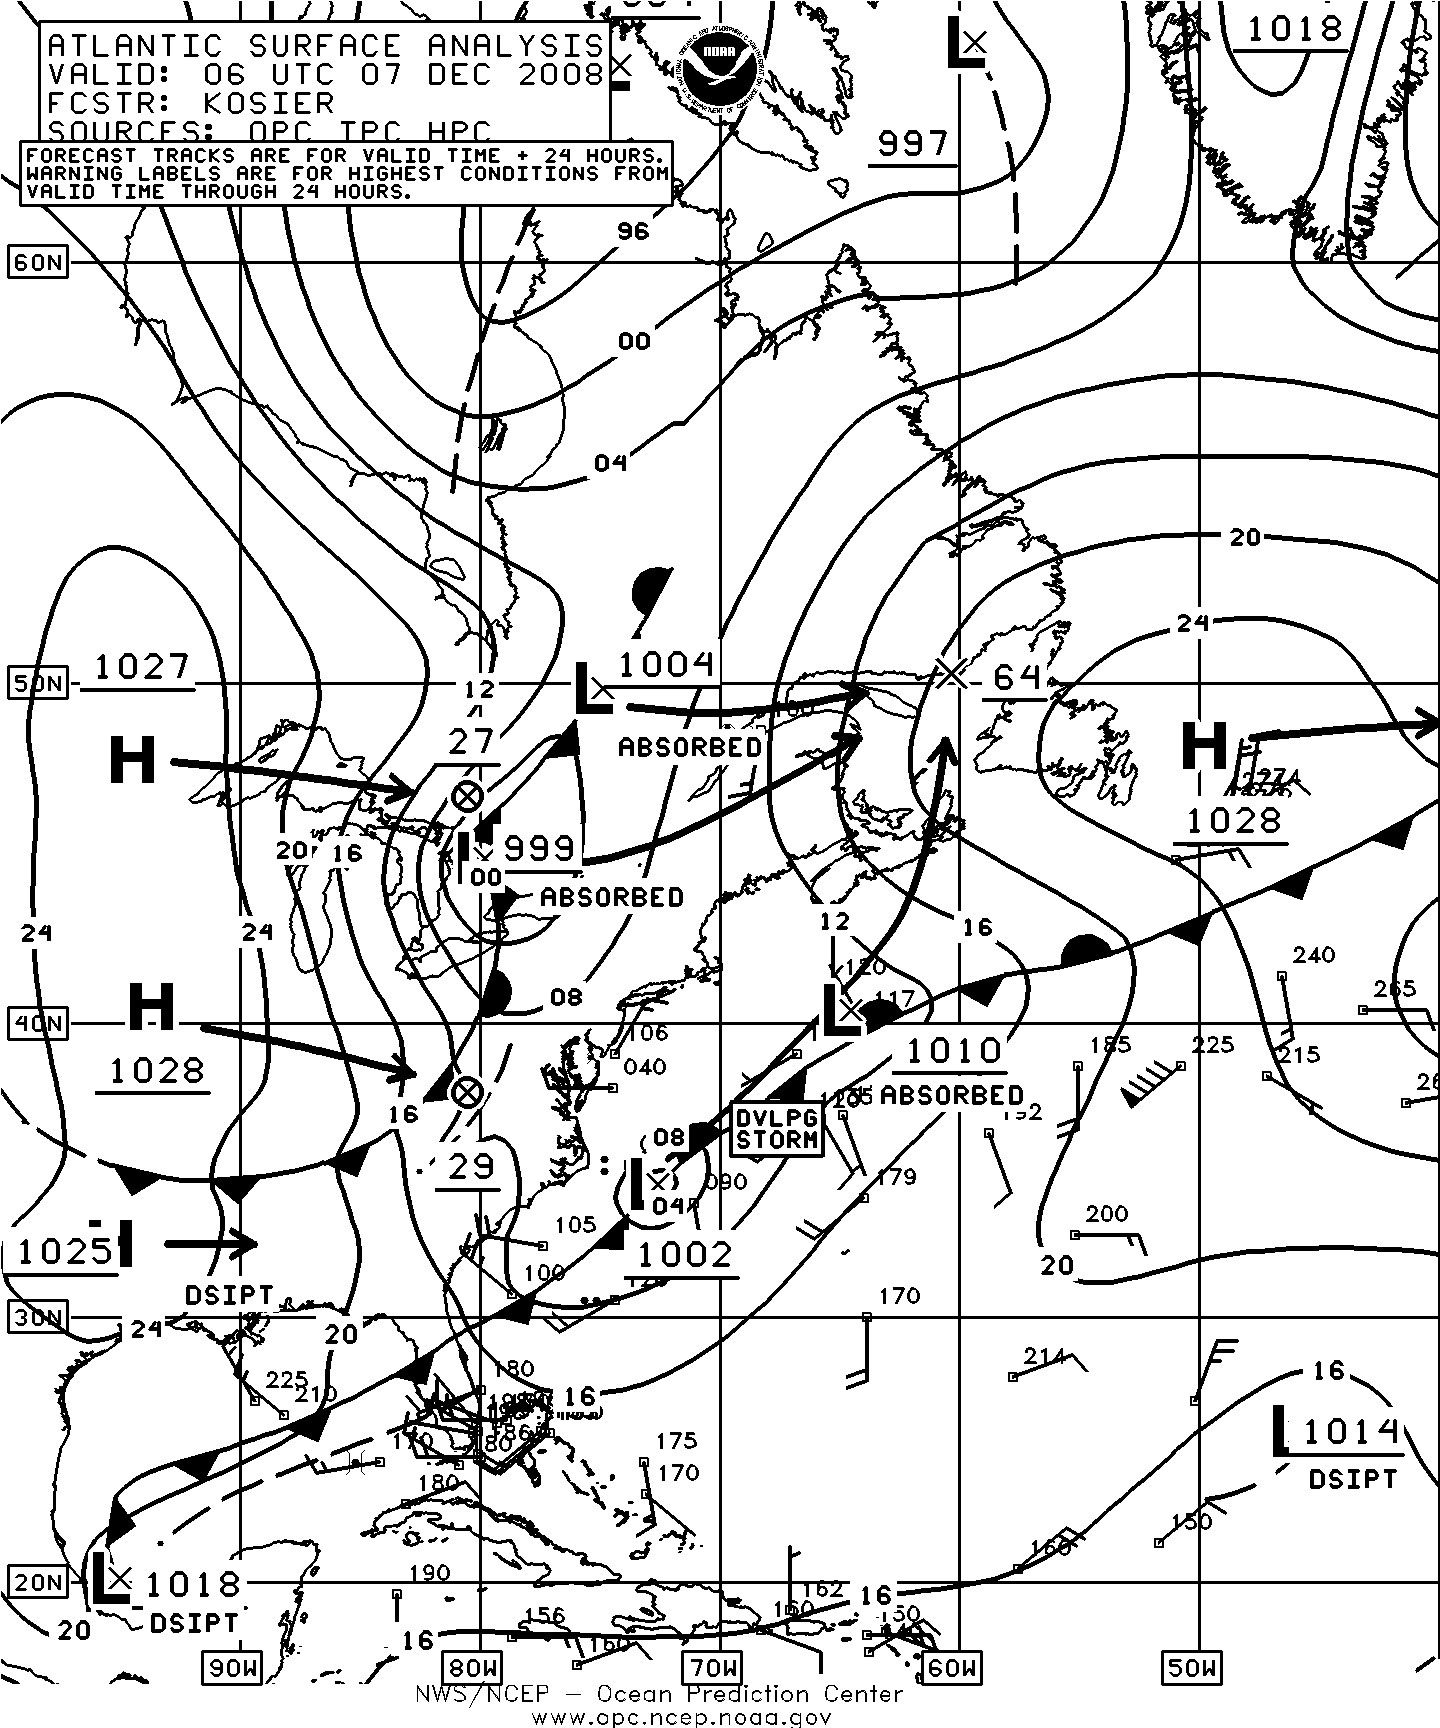
Figure 14. OPC North Atlantic Surface Analysis charts (Part 2) valid 0600 UTC December 7 and 9, 2008.

Figure 15. High resolution QuikSCAT scatterometer image of satellite-sensed winds around the south side of the storm shown in the second part of Figure 14. The valid time of the pass is 0819 UTC December 9, 2008, or about two hours later than the valid time of the second part of Figure 14. Portions of Labrador and the island of Newfoundland appear in the lower left part of the image. Image is courtesy of NOAA/NESDIS/Office of Research and Applications.(Click on image to enlarge)
North Atlantic/ Greenland area Storms, December 11-18: Figure 16 depicts a low which formed in the east Greenland waters on the 11th and developed hurricane force winds by the 12th. The low intensified to 956 hPa near 65N 38W early on the 12th before weakening and drifting southeast. Figure 17 shows the resulting scatterometer winds in a wind maximum extending southeast from the southern tip of Greenland, with winds up to 70 kts. As the low weakened and drifted southeast, the winds weakened to storm force by the 13th with the low becoming absorbed late on the 13th. A similar event occurred again as a low developed east of Greenland on the 15th and briefly developed hurricane force winds near the southern tip of Greenland late on the 17th.

Figure 16. OPC North Atlantic Surface Analysis chart (Part 1) valid 1800 UTC December 12, 2008.(Click on image to enlarge)

Figure 17. High resolution QuikSCAT scatterometer image of satellite-sensed winds in an area southeast of the southern tip of Greenland (upper-left corner of the image). An area of low pressure was to the north, between Greenland and Iceland (Figure 16). The valid time of the image is 2044 UTC December 12, 2008, or about two and three-quarters hours later than the valid time of Figure 16. Image is courtesy of NOAA/NESDIS/Office of Research and Applications. (Click on image to enlarge)
North Atlantic/ North Sea Storm, December 10-13: A storm center formed on a northeast to southwest oriented front over the north-central waters near 54N 47W late on the 10th and moved northeast. Figure 16 shows the low near Iceland at 1800 UTC on the 12th. The ship A8FZ5 (44N 36W) reported southwest winds of 60 kts and 11.5 m seas (37 ft) at 0000 UTC on the 12th. Winds strengthened over the North Sea in response to a secondary low forming on the front just northwest of Great Britain early on the 13th. A high resolution QuikSCAT pass early on the 13th showed southeast winds as high as 65 kts over the north portion of the North Sea. The ship VQHR9 (56N 2E) reported south winds of 55 kts at 0600 UTC on the 13th. The buoy 63115 (61.6N 1.3E) reported south winds of 45 kts and 10.0 m seas (32 ft) at that time, with a maximum of 12.0 m (40 ft) five hours later. There were numerous reports of 45 to 55 kts winds early on the 13th. Winds diminished on the 14th as the low dissipated over Great Britain.
North Atlantic Storm, December 18-20: This fast moving system originated near New England late on the 17th and tracked northeast, developing hurricane force winds around the northern British Isles on the 19th with the center developing a lowest central pressure of 969 hPa. The cyclone passed near 62N 0W at 0000 UTC on the 20th when the buoy 62138 (58.3N 1.7E) reported west winds of 65 kts. The ship V2RU (60N 7W) encountered west winds of 60 kts three hours earlier. A platform LF4C (58.4N 1.9E) reported west winds of 50 kts and 7.5 m seas (25 ft) at 0000 UTC on the 20th followed six hours later by a report of seas 8.5 m (28 ft). The cyclone then began to weaken and passed inland over Norway on the 20th.
Northeast Atlantic Storm, December 20-21: The next cyclone followed a track farther north closer to Greenland and Iceland before turning east, and originated over the central Atlantic. The center reached 59N 33W with a 968 hPa central pressure and hurricane force winds at 0000 UTC on the 21st, with the central pressure falling 36 hPa in twenty-four hours. Figure 18 shows the cyclone weakening near Iceland with a new center to the east taking over. A 25 km QuikSCAT pass from early on December 21 revealed a swath of west to southwest winds 50 to 60 kts northwest of Ireland, and since the higher resolution version shows more detail this could justify the hurricane force label in Figure 18. The cyclone weakened later that day and moved into southern Norway.
North Atlantic Storm, December 20-23: A stronger system followed, moving off the mid-Atlantic coast of the U.S. late on the 19th and tracking northeast, to become the developing hurricane force low in the central Atlantic shown in Figure 18. The QuikSCAT image in Figure 20 taken more than eleven hours after the time of Figure 18 shows winds to 70 kts even in the coarser resolution version of the imagery. At 0600 UTC on the 21st Hibernia Platform (VEP717, 46.7N 48.7W) reported a north wind of 70 kts as the cyclone passed to the east. The cyclone subsequently deepened further when passing east of Greenland on December 22 with a pressure as low as 952 hPa, before moving north of the area by the 23rd.
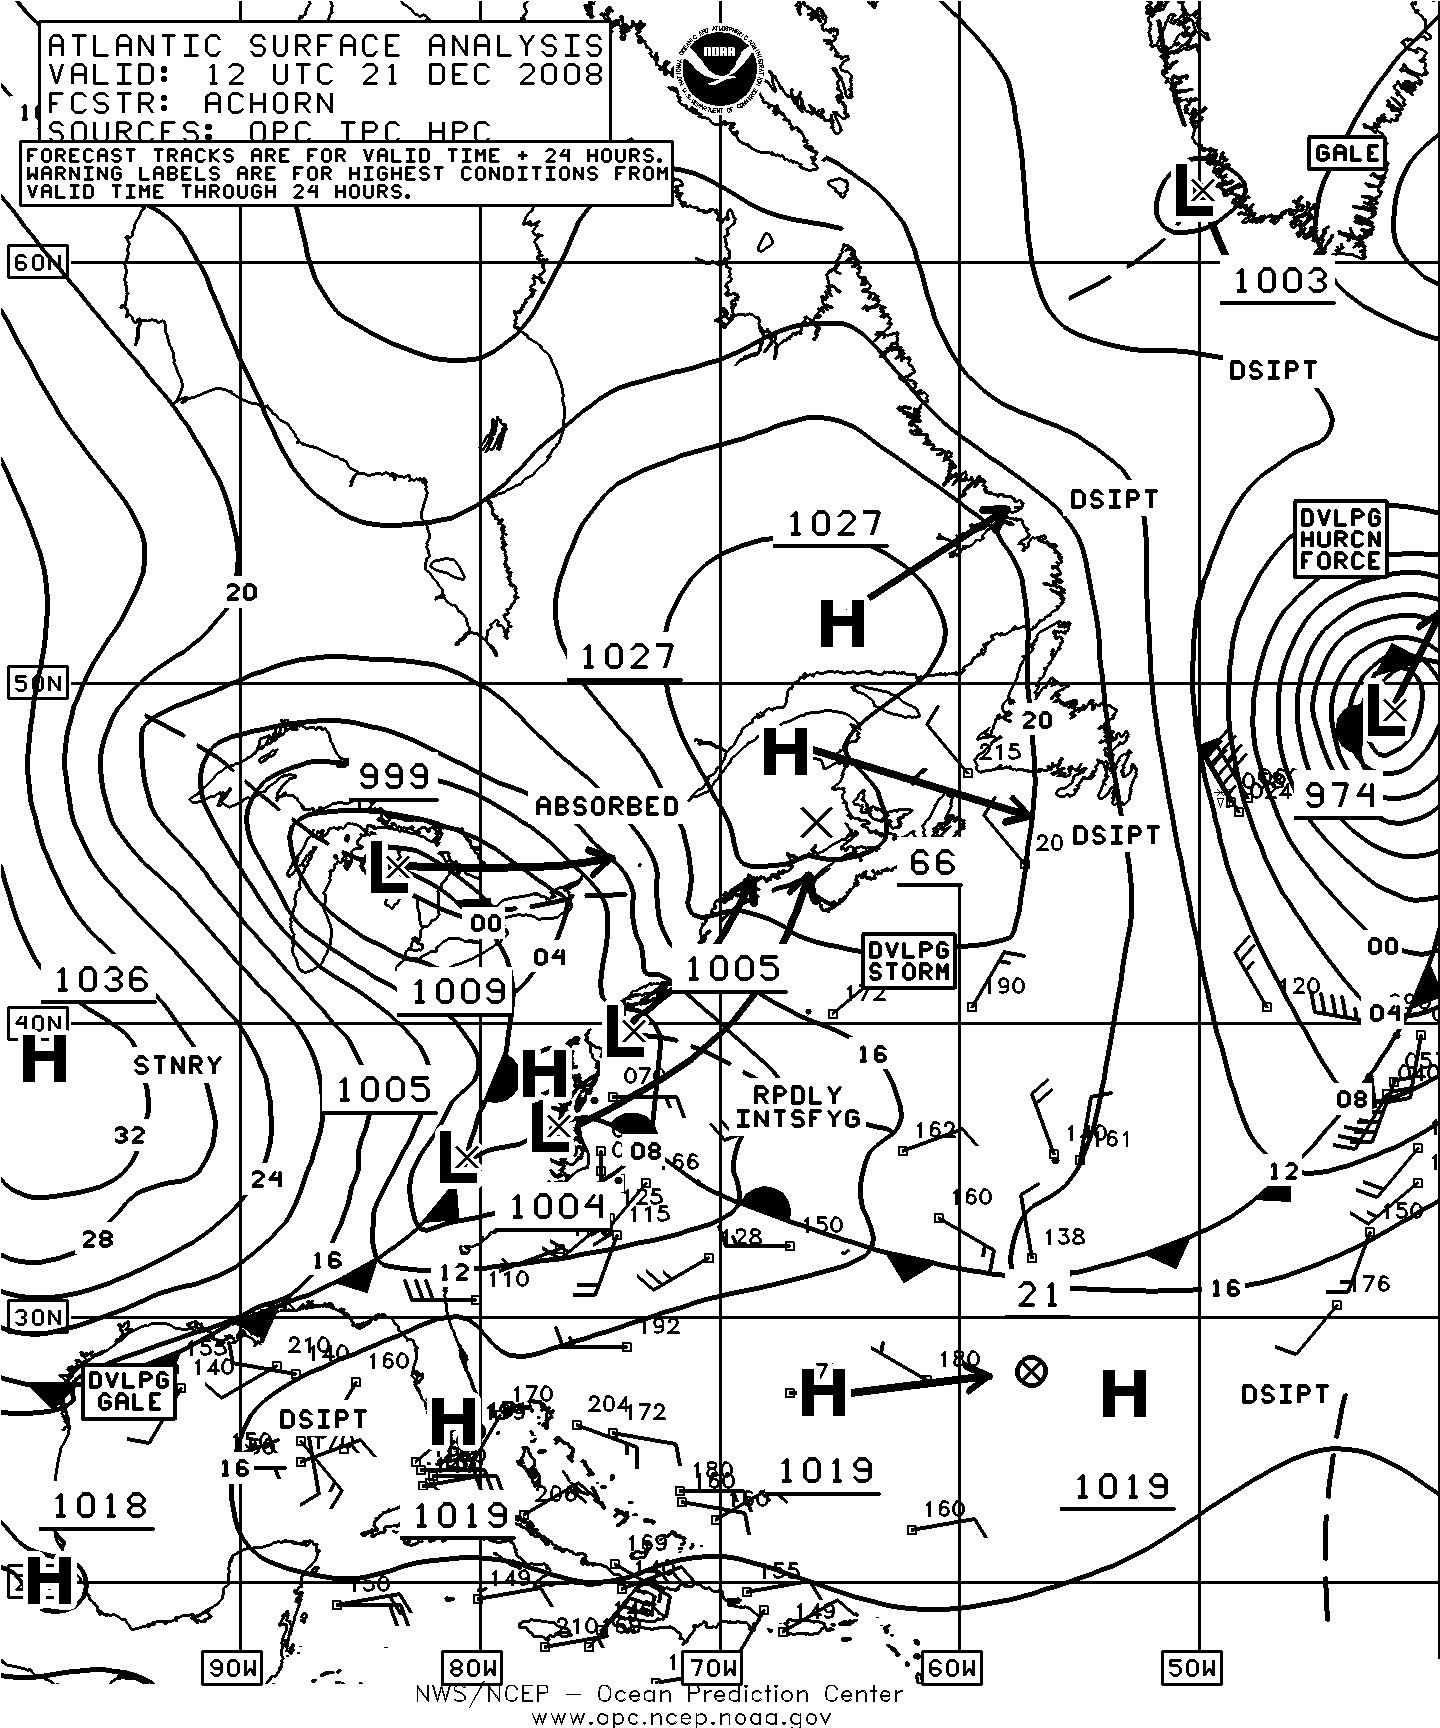
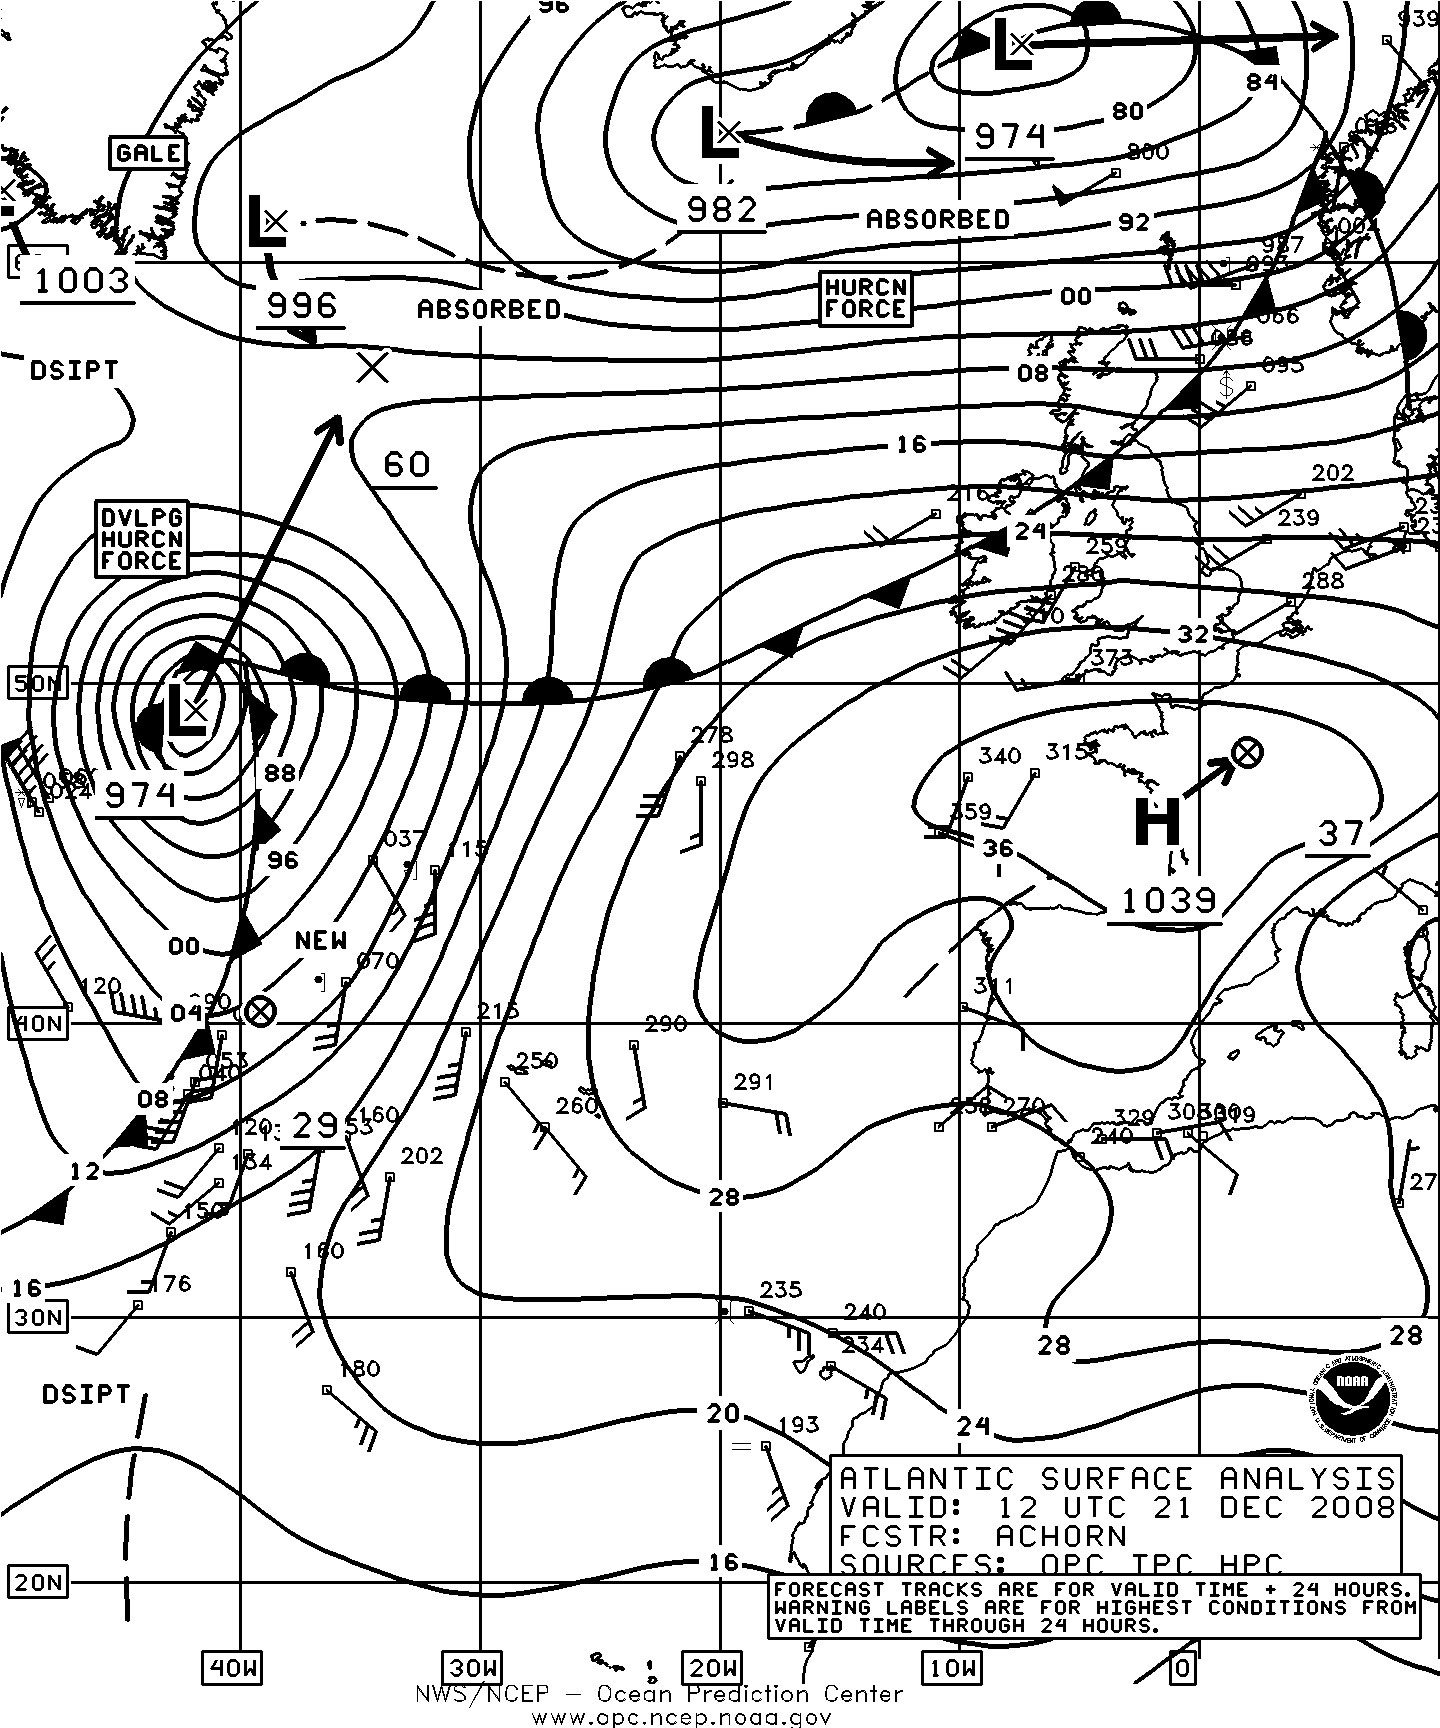
Figure 18. OPC North Atlantic Surface Analysis charts (Parts 1 and 2) valid 1200 UTC December 21, 2008.

Figure 19. OPC North Atlantic 500 hPa analysis valid 1200 UTC December 21, 2008, which is also the valid time of Figure 18. The chart is computer-generated with short-wave troughs manually added as dashed lines. (Click on image to enlarge)
North Atlantic Storm , December 21-25: The next major development off the mid-Atlantic coast of the U.S. early on the 21st Figure 18 followed a track farther west through the Canadian Atlantic provinces where it developed hurricane force winds. The central pressure dropped 40 hPa in the twenty-four hour period ending at 1200 UTC on the 22nd. Figure 19 is a 500 hPa analysis valid at the same time as Figure 18 and shows a strong short-wave trough and jet stream supporting this rapid development, along with another short-wave trough east of Newfoundland supporting the preceding cyclone development. More information on use of the 500 hPa chart can be found in a recent updated article (Reference 3). The ship PDHU (45N 59W) reported east winds of 60 kts at 1200 UTC on the 22nd and 6.0 m seas. Buoy 44141 (43N 58W) reported southeast winds of 39 kts with gusts to 52 kts at 0600 UTC on the 22nd. Nineteen hours later there was a peak gust from the west of 54 kts. Seas at the buoy reached 10.5 m (34 ft) at 0000 UTC on the 23rd. The cyclone reached southern Greenland later on the 23rd with a 950 hPa central pressure, before weakening northwest of Iceland on the 25th. The ship BATEU05 (62N 50W) reported northwest winds to 70 kts late on the 23rd.
Northwest Atlantic Storm, December 24-27: A developing hurricane force low took a northward track into the Labrador Sea in an event similar to that of mid-October. Early on the 26th a high resolution QuikSCAT pass showed northerly winds to 70 kts in the Labrador Sea while center attained a central pressure of 957 hPa. Blocked by high pressure to the east, the cyclone weakened over Greenland by the 27th.
South-Central Cut-off Storm, December July 4-5: A low pressure area blocked by high pressure to the north and east developed on December 27 and drifted northwest, developing a central pressure of 972 hPa near 43N 38W at 1800 UTC on the 28th. The ship A8IY3 (42N 37W) reported west winds of 50 kts and 10.0 m seas (33 ft) at 1200 UTC on the 22nd. DGLM (43N 36W) encountered northwest winds of 55 kts at this time. Partial coverage of high resolution scatterometer data revealed winds to 65 kts from the west and northwest late on the 28th. The cyclone began weakening on the 29th, becoming a gale on the 30th while drifting to the northeast under the unfluence of blocking high pressure.
North Atlantic Storm, December 30-31: Figure 21 shows the rapid development of the low south of Newfoundland into yet another hurricane force low. High resolution Quikscat imagery from early on December 31 revealed winds to 70 kts around the south side of the storm southeast of Newfoundland. In this very active month another significant event was taking shape off the U.S. coast late on the 31st. This will be covered in a future article.

Figure 20. QuikSCAT scatterometer image of satellite-sensed winds around the storm shown in the second part of Figure 18. The resolution is 25 km in this standard version of the imagery. The valid time of the pass is 2328 UTC December 21, 2008, or about eleven and one-half hours later than the valid time of the second part of Figure 18. The center of the cyclone appears near 52N 40W near the center of the image. Image is courtesy of NOAA/NESDIS/Office of Research and Applications. (Click on image to enlarge)
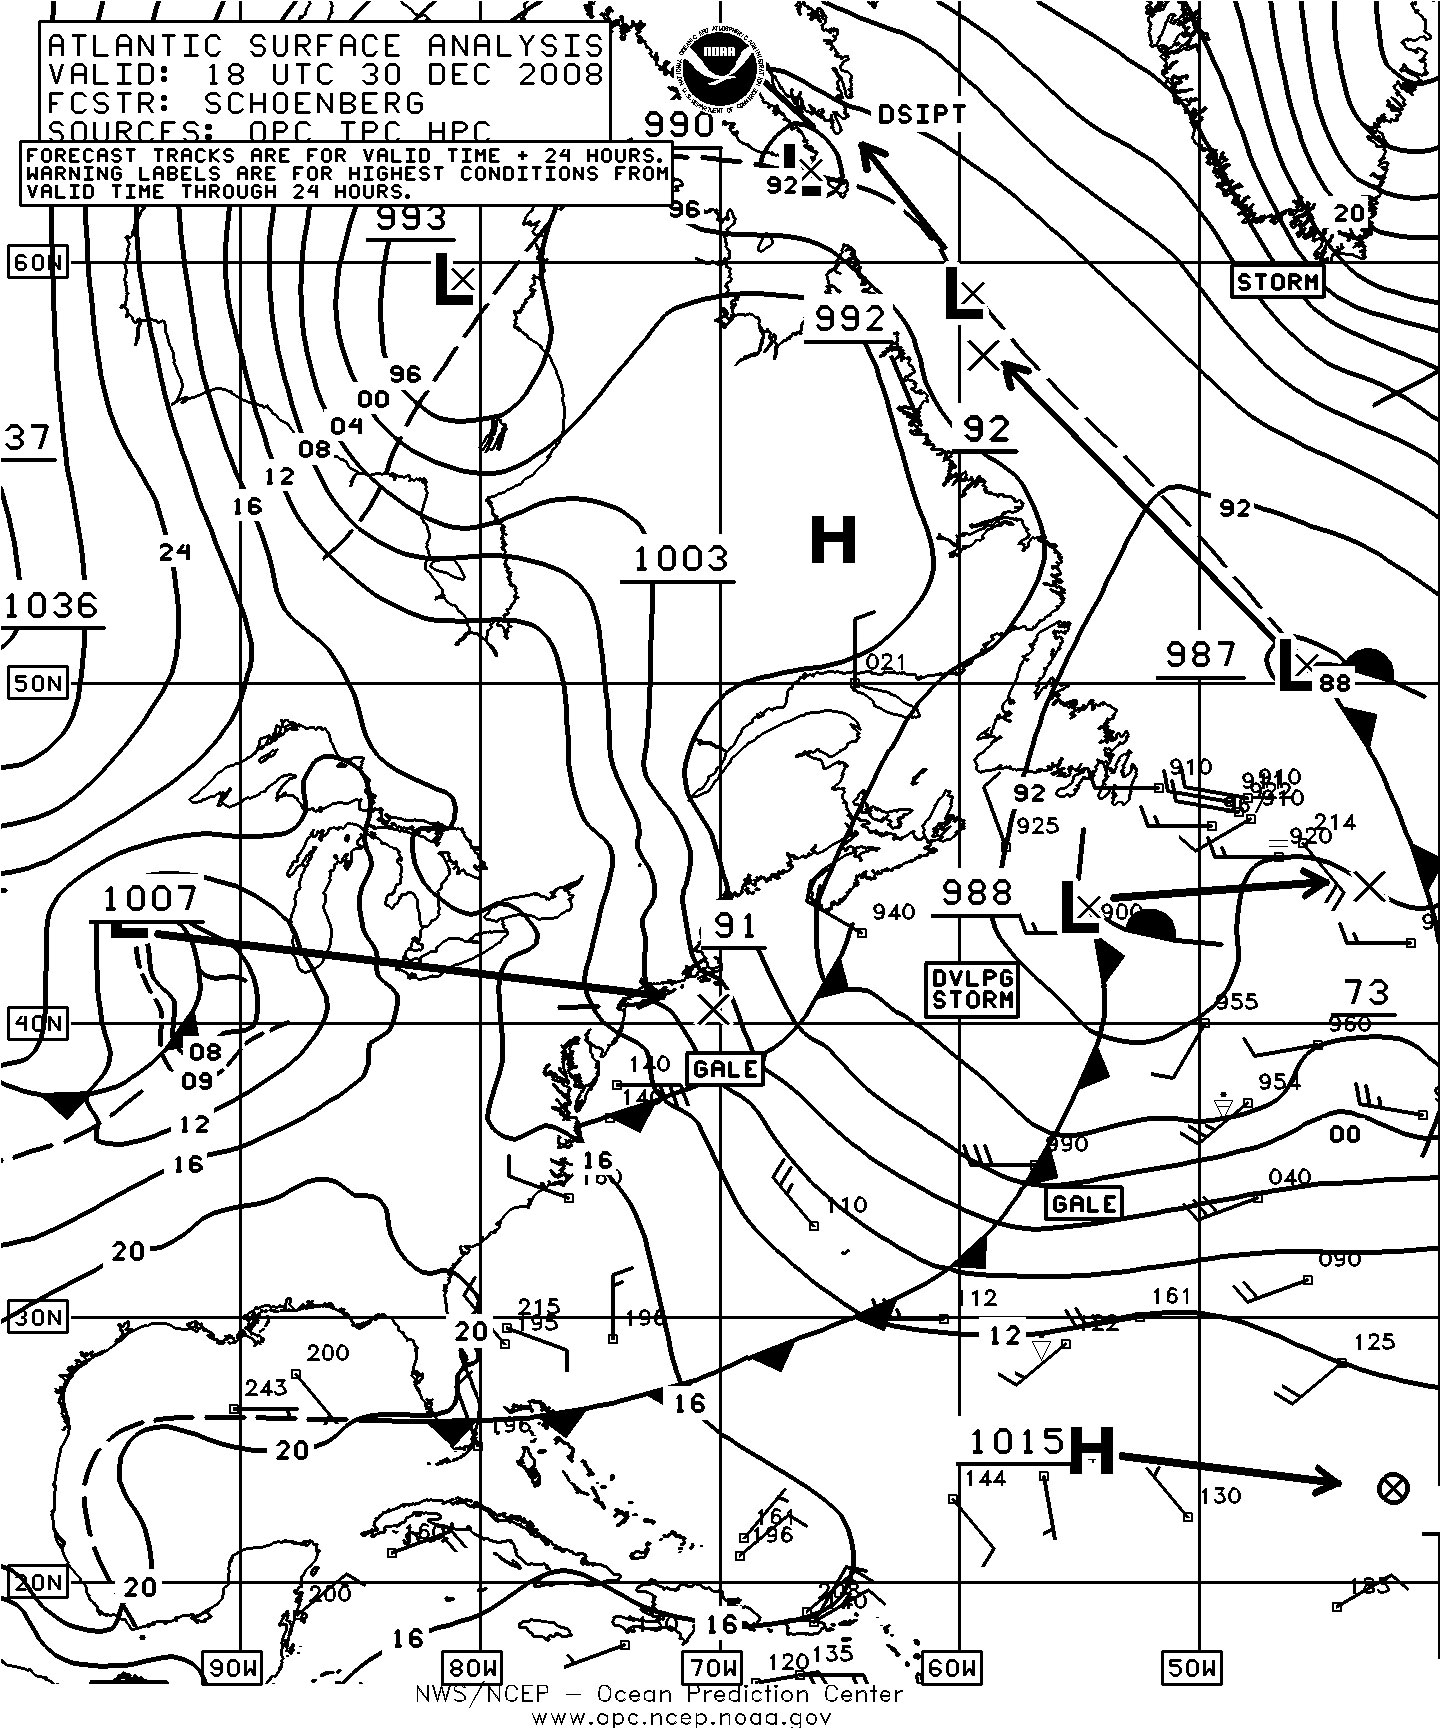
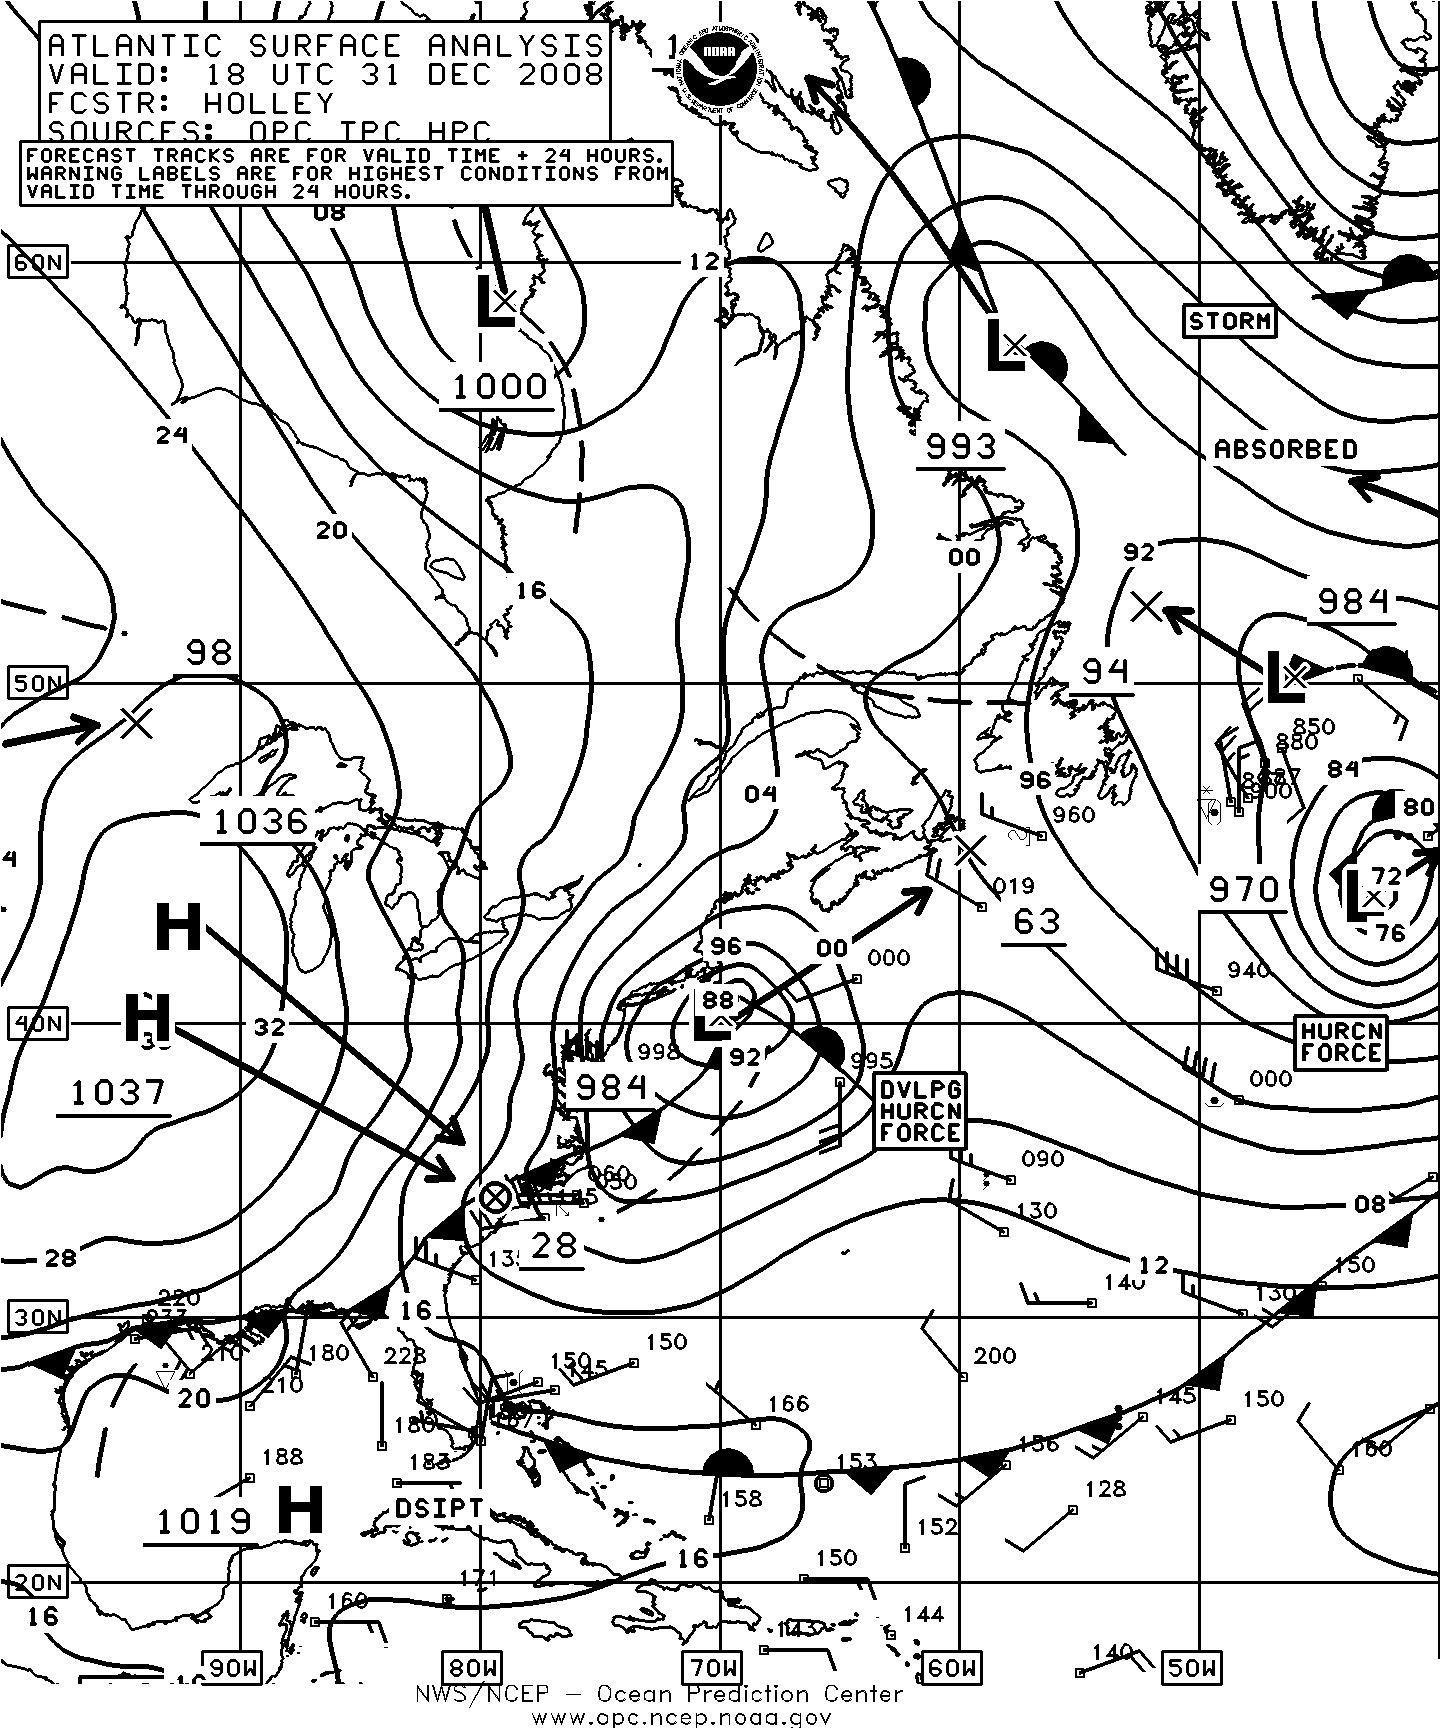
Figure 21. OPC North Atlantic Surface Analysis charts (Part 2) valid 1800 UTC December 30 and 31, 2008. (Click on image to enlarge)
References
Tropical Weather Summary, Hurricane Specialists Unit, National Hurricane Center http://www.nhc.noaa.gov/archive/2008/tws/MIATWSAT_nov.shtml
Saffir-Simpson Scale of Hurricane Intensity, http://www.nhc.noaa.gov/aboutsshs.shtml
Sienkiewicz, Joe and Chesneau, Lee, "Mariners Guide to the 500-Millibar Chart", Mariners Weather Log, December 2008.
QuikSCAT in the Ocean Prediction Center, http://www.opc.ncep.noaa.gov/quikscat/index.shtml
Back to top