Atlantic Hurricane Season of 2006
John L. Beven II and Daniel P. Brown, National Hurricane Center/Tropical Prediction Center, NOAA/NWS Miami, FL
Introduction
Individual Storms
| Tropical Storm Alberto | Hurricane Ernesto |
| Unnamed Tropical Storm | Hurricane Florence |
| Tropical Storm Beryl | Hurricane Gordon |
| Tropical Storm Chris | Hurricane Helene |
| Tropical Storm Debby | Hurricane Issac |
Acknowledgments
The 2006 Atlantic hurricane season featured near average overall activity, but activity was below the active levels of recent seasons. There were ten tropical storms, five of which became hurricanes, with two of the hurricanes becoming major hurricanes (category 3 or greater on the Saffir-Simpson Hurricane Scale). For the 40-year period 1966-2005, the averages for named storms, hurricanes and major hurricanes are eleven, six, and two, respectively. All of the hurricanes occurred during a 37-day period between 27 August and 2 October. The last tropical cyclone activity of any kind also occurred on 2 October; since the beginning of the satellite era (1966), only two seasons have ended earlier, with activity in both 1983 and 1993 ending on 30 September.
For the first time since the 2001 season, no hurricanes hit the United States. This was largely due to a mean trough over the eastern United States during September, which steered many systems away from the United States. The 2006 cyclones caused no direct deaths in the United States, and damage is estimated to have been near $500 million. Other portions of the basin were more significantly affected, however. Tropical Storm Alberto and Hurricane Ernesto produced heavy rainfall in portions of Cuba, Haiti, and the Dominican Republic, with Ernesto responsible for five deaths in Haiti. Florence brought hurricane conditions to Bermuda, and after losing tropical characteristics it also brought hurricane-force winds to portions of Newfoundland, Canada. Gordon was the first hurricane to affect the Azores since 1991.
Back to topThe statistics of the named storms of 2006 are given in Table 1, while the tracks are shown in Figure 1. In the cyclone summaries given below, all dates are based on Universal Coordinated Time.
| Name | Class* | Dates** | Maximum Winds (kts) | Minimum Pressure (hPa) | Direct Deaths | U. S. Damage ($million) |
|---|---|---|---|---|---|---|
| Alberto | TS | Jun 10-14 | 60 | 995 | 0 | Minor*** |
| Unnamed | TS | Jul 17-18 | 45 | 998 | 0 | 0 |
| Beryl | TS | Jul 18-21 | 50 | 1000 | 0 | 0 |
| Chris | TS | Aug 1-4 | 55 | 1001 | 0 | 0 |
| Debby | TS | Aug 21-26 | 45 | 999 | 0 | 0 |
| Ernesto | H | Aug 24-Sep 1 | 65 | 985 | 5 | 500 |
| Florence | H | Sep 3-12 | 80 | 974 | 0 | 0 |
| Gordon | H | Sep 10-20 | 105 | 955 | 0 | 0 |
| Helene | H | Sep 12-24 | 105 | 955 | 0 | 0 |
| Isaac | H | Sep 27-Oct 2 | 75 | 985 | 0 | 0 |
Table 1. Atlantic tropical storms and hurricanes of 2006.
* TS - tropical storm, maximum sustained winds 34-63 kts; H - hurricane, maximum sustained winds 64 kts or higher.
** Dates begin at 0000 UTC and include tropical/subtropical depression stage, but exclude extratropical stage.
*** Minor damage was reported but the extent of the damage was not quantified

Figure 1. Tracks of Atlantic tropical storms and hurricanes of 2006.
Alberto formed on 10 June in the northwestern Caribbean Sea from an interaction of a tropical wave with a persistent area of disturbed weather (Figure 1). The center of the poorly-organized depression moved northwestward through the Yucatan Channel, and the cyclone became a tropical storm over the southeastern Gulf of Mexico early on 11 June while centered about 85 nmi west-northwest of the western tip of Cuba. On 12 June, Alberto turned northeastward and abruptly strengthened to a peak intensity of 60 kts. The storm then weakened due to vertical wind shear, and it made landfall near Adams Beach in the Big Bend area of Florida on 13 June with maximum winds of 40 kts. Alberto weakened to a depression early on 14 June over Georgia and then emerged off the mid-Atlantic coast of the United States as an extratropical low that night. Accelerating northeastward, the low became a powerful extratropical storm just south of Nova Scotia. It passed over Newfoundland and then weakened as it traversed the North Atlantic Ocean, reaching the British Isles before being absorbed by a frontal system on 19 June.
The Chevron Arizona (KGBE) reported 55 kts winds and a pressure of 1001.4 hPa at 1800 UTC 12 June, while the MV Delaware Trader (WDB3258) reported 36 kts winds at 1500 UTC 11 June. NOAA buoy 42003 reported 10-minute winds of 39 kts with a gust to 49 kts at 1350 UTC 12 June. At the coast, the National Ocean Service (NOS) station at Old Port Tampa, Florida reported 6-minute winds of 42 kts with a gust to 52 kts at 0500 UTC 13 June.
Minor damage was reported, with some homes and businesses damaged by storm surge flooding in Levy and Citrus counties in Florida. There were no deaths associated with Alberto as a tropical cyclone.
Back to topAs part of its routine post-season review, the National Hurricane Center occasionally identifies a previously undesignated tropical or subtropical cyclone based on new data or meteorological interpretation. The 2006 review has identified such a system.
The unnamed tropical cyclone originated from a cold front that moved off the northeastern United States on 13 July. As an upper-level trough approached from the west, a non-tropical low formed on 16 July about 305 nmi south-southeast of Nantucket, Massachusetts. While the trough subsequently weakened, the surface low moved slowly northeastward over warm Gulf Stream waters. Thunderstorm activity increased near the low center as the associated front dissipated late on 16 July. By early on 17 July, the system acquired sufficient organization to be considered a tropical depression centered about 210 nmi southeast of Nantucket (Figure 1). Moving northeastward, the cyclone became a tropical storm and reached its estimated peak intensity of 45 kts later that day. It then encountered cooler waters and degenerated to a non-convective remnant low on 18 July. The low moved across Newfoundland, turned toward the east-northeast, and then dissipated on 19 July over the open waters of the North Atlantic Ocean.
Canadian buoy 44137 reported 10-min average winds of 31 kts with a gust to 38 kts (5 m elevation) at 2300 UTC 17 July, along with a minimum pressure of 1001.2 hPa an hour later. There were no reports of casualties or damages.
Back to topBeryl formed from the same frontal system that spawned the unnamed tropical storm. It developed into a tropical depression on 18 July about 250 nmi east-southeast of Wilmington, North Carolina (Figure 1) and reached tropical storm strength later that day. Moving generally northward, Beryl passed about 100 nmi east of Cape Hatteras and reached its peak intensity of 50 kts on 19 July. Over the next couple of days, Beryl moved toward the north-northeast and northeast with increasing forward speed, passing over Nantucket early on 21 July. The weakening storm continued to accelerate northeastward, and Beryl lost its tropical characteristics over western Nova Scotia late on 21 July. The remnants of Beryl merged with another extratropical low the next day.
The London Senator (DEDM) reported 39 kts winds at 2100 UTC 19 July, while the Albatross IV (WMVF) reported 35 kts winds at 1500 UTC 20 July. NOAA buoy 44008 reported 10-min winds of 36 kts with a gust of 49 kts at 0610 UTC 21 July. At the coast, wind gusts of 38-44 kts were reported on and near Nantucket. There were no reports of casualties or damages.
Back to topChris developed from a tropical wave, becoming a depression on 1 August about 205 nmi east-southeast of Barbuda in the Leeward Islands (Figure 1). Moving west-northwestward, the depression became a tropical storm later that day and reached a peak intensity of 55 kts on 2 August a short distance northeast of the northern Leeward Islands. However, strong vertical wind shear then caused Chris to weaken abruptly on 3 August. The system turned westward and weakened to a tropical depression later that day about 195 nmi east-southeast of the Turks and Caicos Islands. Chris degenerated into a remnant low early on 4 August and dissipated near the northern coast of Cuba on 6 August. Chris produced heavy rainfall and localized flooding over portions of Puerto Rico, the Dominican Republic, Haiti, and eastern Cuba. Damage was minor and there were no casualties reported.
Back to topDebby developed from a vigorous tropical wave that exited the west coast of Africa on 20 August. Development began almost immediately, and a tropical depression formed the next day about 225 nmi south-southeast of Praia in the Cape Verde Islands (Figure 1). The depression moved west-northwestward, passing about 100 nmi southwest of the islands on 22 August. Early on 23 August, the depression became a tropical storm about 195 nmi west of the Cape Verde Islands, and its winds reached 45 kt later that day. Little change in strength occurred during the next couple of days as Debby moved west-northwestward in a relatively dry and stable air. Southerly wind shear then caused weakening on 25 August. Debby weakened to a depression and degenerated to a remnant low the next day about 1225 nmi east-southeast of Bermuda. Turning northward, the low dissipated on 28 August ahead of an approaching frontal system. There were no reports of damage or casualties in association with Debby.
Back to topErnesto originated from a tropical wave that moved across the coast of Africa on 18 August. On 23 August, as the wave approached the Lesser Antilles, convection began to increase, and on 24 August a tropical depression formed about 40 nmi north-northwest of Grenada (Figure 1). The depression strengthened to a tropical storm the next day over the eastern Caribbean Sea about 280 nmi south of Puerto Rico. The storm turned northwestward on 26 August over the central Caribbean Sea and continued to intensify. Early the next day, while centered about 70 nmi south of the southern coast of Haiti, Ernesto briefly became a hurricane before weakening abruptly. Weakening continued on 28 August as Ernesto passed very near the southwestern tip of Haiti, and it made landfall later that day just west of Guantanamo Bay, Cuba with maximum sustained winds of 35 kts.
Ernesto crossed eastern Cuba and emerged off the north-central coast of Cuba early on 29 August. Continuing northwestward, the storm made landfall in extreme southern Florida early on 30 August with 40 kts maximum winds. It then turned northward as it maintained tropical storm status over the southern Florida peninsula. The circulation center emerged over the Atlantic Ocean near Cape Canaveral early on 31 August. Ernesto strengthened over the warm Atlantic waters while heading north-northeastward, its winds reaching 60 kts while centered about 150 nmi south-southwest of Wilmington, North Carolina. Ernesto maintained this strength until landfall early on 1 September near Oak Island, North Carolina, just west of Cape Fear. It weakened inland and became a tropical depression over North Carolina later that day, and lost its tropical characteristics by late on 1 September as it moved over Virginia. The remnant extratropical low moved slowly northward over Pennsylvania and New York and was gradually absorbed into a larger extratropical system during the following couple of days.
Several ships encountered Ernesto (Table 2). The strongest winds were from the Ever Decent (3FUO7) and the Carnival Destiny (C6FN4), both of which reported 52 kts at 0000 UTC 1 September and 1100 UTC 26 August respectively. At the North Carolina coast, the NOS station at Wrightsville Beach reported 6-min winds of 50 kts with a gust to 64 kts at 0300 UTC 1 September. A large area of high pressure centered over southeastern Canada combined with the approaching Ernesto, even before landfall, to produce sustained gale-force winds and heavy rains over and near the coasts of Virginia, Maryland, Delaware, and New Jersey. Tides were up to 6 ft above normal in portions of southern Chesapeake Bay. In Florida, the Coastal Marine Automated Network station at Fowey Rocks reported 10-minute winds of 42 kts with a gust to 50 kts (44 m elevation) at 0710 UTC 30 August. In Cuba, Punta Lucrecia reported a gust of 49 kts at 1715 UTC 28 August.
Ernesto directly caused five fatalities, all in Haiti. There were also two fatalities in Virginia associated with strong gradient winds well to the north of Ernesto. The cyclone produced heavy rains along its track, which caused flooding damage in portions of Haiti, the Dominican Republic, and the eastern United States. U. S. damage is estimated at $500 million.
| Date/Time (UTC) |
Ship name | Latitude (°N) |
Longitude (°W) |
Winddir/speed (kts) |
Pressure (hPa) |
|---|---|---|---|---|---|
| 26/1100 | Carnival Destiny | 13.9 | 68.8 | 170/52 | 1006.0 |
| 26/1200 | Marlin | 15.1 | 68.9 | 110/40 | 1008.5 |
| 26/1800 | Montemar Salvador | 14.1 | 68.0 | 110/37 | 1010.0 |
| 29/0600 | Caribbean Princess | 19.0 | 75.8 | 140/35 | 1010.6 |
| 29/0900 | ShenZhen Bay | 24.4 | 74.5 | 030/34 | 1012.9 |
| 29/1900 | ITB Mobile | 25.7 | 77.2 | 130/35 | 1011.0 |
| 01/0000 | Ever Decent | 32.3 | 77.9 | 130/52 | 987.5 |
| 01/0600 | MOL Virtue | 33.4 | 75.9 | 170/47 | 1008.0 |
| 01/1200 | British Trader | 36.1 | 73.6 | 120/50 | 1009.3 |
Table 2. Selected ship reports with winds of at least 34 kts for Hurricane Ernesto, 24 August-1 September, 2006.
Back to top
The development of Florence involved the interaction of two tropical waves, one that moved across the west coast of Africa on 29 August and progressed slowly westward, and another that crossed the coast two days later but moved westward at a more rapid rate. On 2 September, the two waves combined to form a large area of disturbed weather over the eastern tropical Atlantic Ocean. Convection increased and a tropical depression formed the next day about 855 nmi west of the Cape Verde Islands (Figure 1). The depression was large and initially poorly organized as it moved west-northwestward, and the system took two days to attain tropical storm strength. Westerly wind shear then limited development until 8 September, when Florence began to strengthen. Florence became a hurricane early on 10 September while centered about 340 nmi south of Bermuda. The hurricane turned northward, passing about 50 nmi west of Bermuda on 11 September while at its estimated peak intensity of 80 kts. After passing Bermuda, Florence turned northeastward later that day and retained hurricane strength until it became extratropical early on 13 September about 420 nmi south-southwest of Cape Race, Newfoundland. As an extratropical low, the cyclone maintained hurricane-force winds as it passed over Cape Race late on 13 September. After passing Newfoundland, the cyclone moved east-northeastward over the open North Atlantic Ocean for several days. The extratropical remnants of Florence were absorbed by another low southwest of Iceland on 19 September.
Florence was a large cyclone throughout its lifetime. Even though the center of its eye passed 50 nmi west of Bermuda, Florence brought hurricane conditions to the island. An automated station at St. David’s (48 m elevation) reported sustained winds of 71 kts with a gust to 97 kts at 1340 UTC 11 September. A wind gust to 100 kts was reported at the Bermuda Maritime Operations Centre at 1001 UTC that day. During the extratropical phase of Florence, Sagona Island, Newfoundland reported sustained winds of 66 kts with a gust to 81 kts. Only two ships reported tropical-storm-force winds during Florence’s life as a tropical cyclone—the Lykes Discoverer (WGXO) reporting 44 kts winds at 0600 UTC 12 September and the Marlene Green (PBCJ) reporting 39 kts winds at 0000 UTC 8 September.
Florence caused widespread power outages and minor damage in both Bermuda and southeastern Newfoundland. A few injuries were reported in Bermuda.
Back to topGordon formed from a well-defined tropical wave that crossed the west coast of Africa on 1 September. Westerly shear associated with the outflow of Florence initially inhibited development, but ultimately a depression formed on 10 September about 470 nmi east-northeast of the Leeward Islands (Figure 1). The depression became a tropical storm on 11 September and turned toward the northwest through a weakness in the subtropical ridge associated with Florence. Gordon strengthened into a hurricane early on 13 September, then turned northward and rapidly intensified, reaching its estimated peak intensity of 105 kts (category 3 on the Saffir-Simpson Hurricane Scale) early on 14 September while located about 500 nmi east-southeast of Bermuda (Figure 2). An upper-level trough turned Gordon northeastward over the central Atlantic, but the trough bypassed the hurricane and steering currents weakened the next day. Gordon moved little on 16-17 September while it gradually weakened. On 17 September, a building mid-to upper-level high to the east of Gordon steered the hurricane northeastward, and an approaching upper-level trough reinforced this motion the next day. Turning eastward, the cyclone re-intensified on 19 September and reached an estimated intensity of 90 kts about 420 nmi west-southwest of the Azores. Gradual weakening then occurred as Gordon approached the Azores. On 20 September, the center of Gordon passed between the Azores islands of Sao Miguel and Santa Maria, and shortly thereafter the cyclone became extratropical about 240 nmi west of the coast of Portugal. As a strong extratropical low, Gordon turned northward on 21 September and intensified. The low passed over western Ireland late that day, and then made a large cyclonic loop before dissipating between Ireland and England on 24 September.
Several ships encountered Gordon (Table 3), with the strongest winds reported by the London Senator—51 kts at 0600 UTC 20 September. In the Azores, Santa Maria reported sustained winds of 49 kts and a gust to 71 kts at 0800 UTC 20 September. As an extratropical cyclone, Gordon produced numerous hurricane-force wind gusts in northwestern Spain including one of 99 kts at Punta Candierira. Media reports indicated that damage in the Azores was minor. Minor damage was also reported in portions of Spain, Britain, and Ireland.
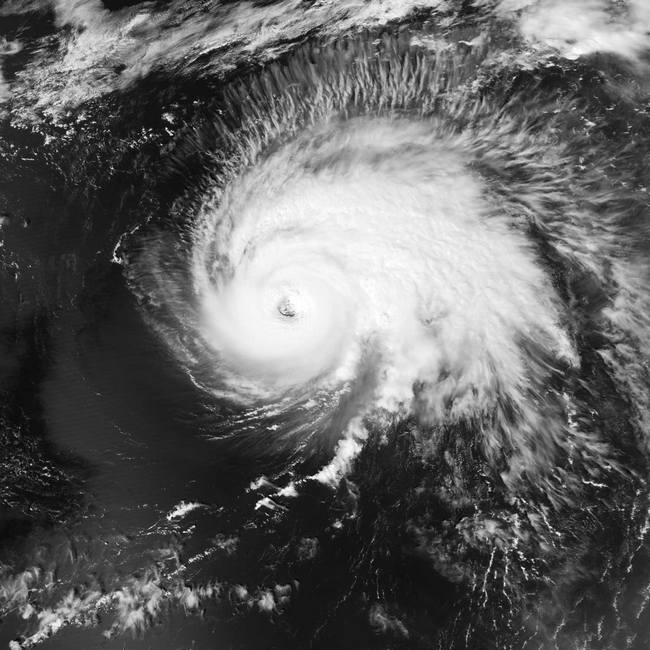
Figure 2. NASA MODIS image of Hurricane Gordon near maximum intensity from the Aqua satellite at 1710 UTC, 14 September, 2006. Image courtesy of NASA Earth Observatory, Greenbelt, MD
| Date/Time (UTC) |
Ship name | Latitude (°N) |
Longitude (°W) |
Winddir/speed (kts) |
Pressure (hPa) |
|---|---|---|---|---|---|
| 16 / 1800 | Bonn Express | 29.6 | 52.7 | 200 / 37 | 1013.0 |
| 16 / 1900 | Bonn Express | 29.5 | 53.0 | 210 / 35 | 1012.6 |
| 20 / 0000 | Shiqma | 35.4 | 29.4 | 160 / 38 | 1013.0 |
| 20 / 0600 | Schackenborg | 34.7 | 30.4 | 290 / 37 | 1013.1 |
| 20 / 0600 | London Senator | 35.6 | 27.5 | 260 / 51 | 1008.0 |
| 20 / 1200 | Green Brazil | 35.4 | 22.4 | 230 / 41 | 1006.5 |
| 20 / 1200 | Albert Oldendorf | 35.4 | 21.8 | 210 / 39 | 1008.0 |
| 20 / 1800 | Norasia Atlas | 35.9 | 21.0 | 270 / 41 | 1006.0 |
Table 3. Selected ship reports with winds of at least 34 kts for Hurricane Gordon 10-20 September, 2006.
Back to top
Helene, the longest-lived tropical cyclone of the 2006 season, developed from a vigorous tropical wave that emerged from the west coast of Africa on 11 September. The associated thunderstorm activity quickly became organized and a tropical depression formed the next day about 200 nmi south-southeast of the Cape Verde Islands (Figure 1). The depression passed about 165 nmi south of the Cape Verde Islands before strengthening to a tropical storm early on 14 September. Moving west-northwestward over the tropical Atlantic Ocean, Helene steadily intensified and became a hurricane on 16 September while located about 1000 nmi east of the northern Leeward Islands. A weakness in the subtropical ridge associated with Hurricane Gordon caused Helene to turn northwestward the next day. Helene attained category 3 status and reached its estimated peak intensity of 105 kts on 18 September (Figure 3). As Gordon moved away, a narrow mid-to upper-level ridge built to the north of Helene on 19 September and caused the hurricane to turn westward while it gradually weakened. Helene turned northward on 20 September ahead of a large deep-layer trough that was moving off the east coast of the United States. The hurricane passed about 475 nmi east of Bermuda early on 21 September and then turned east-northeastward over the open waters of the central Atlantic. Helene retained hurricane strength and became extratropical on 24 September about 275 nmi northwest of the Azores. The extratropical low gradually weakened and passed near northwestern Ireland and Scotland on 27 September. It was absorbed by a larger extratropical low late that day.
Three ships reported tropical-storm-force winds from Helene. The previously mentioned London Senator reported 49 kts winds at 0600 UTC 23 September. The Maersk Wave (S6TV) reported 39 kts winds at 0600 UTC 19 September, while the Nordon (PBHU) reported 37 kts winds at 1200 UTC 23 September. As an extratropical low, Helene produced strong wind gusts across much of Ireland and northwestern Scotland. South Uist Island in the Outer Hebrides of Scotland reported a 64 kts gust, and the Valentia Observatory in Ireland reported a 49 kts gust. There were no reports of casualties or damages from Helene.
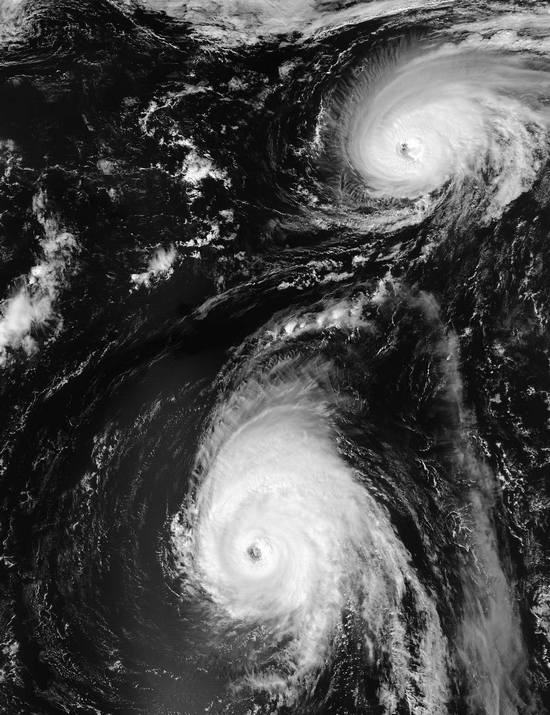
Figure 3. NASA MODIS image of Hurricane Helene near maximum intensity from the Aqua satellite at 1645 UTC, 18 September, 2006. Hurricane Gordon is seen near the top of the image. Image courtesy of the NASA Earth Observatory, Greenbelt, MD.
Back to topIsaac developed from a tropical wave that exited the west coast of Africa on 18 September, eventually becoming a depression on 27 September about 810 nmi east-southeast of Bermuda, and a tropical storm early the next day (Figure 1). Isaac was surrounded by relatively dry and stable air, and waters beneath the cyclone had been cooled by Hurricanes Gordon and Helene. This resulted in little development over the next day or so. The cyclone began to strengthen late on 29 September and Isaac became a hurricane on 30 September while centered about 325 nmi east-southeast of Bermuda. The hurricane reached its peak intensity of 75 kts on 1 October while passing about 285 nmi east of Bermuda. Later that day, Isaac accelerated around the western periphery of the subtropical ridge. The hurricane moved quickly north-northeastward on 2 October ahead of an approaching deep-layer trough, and weakened as it encountered increasing southwesterly shear and cooler waters. Late on 2 October, the center of Isaac passed about 35 nmi southeast of the Avalon Peninsula of Newfoundland. Isaac lost its tropical characteristics on 3 October and merged with a larger extratropical low later that day.
The Elektra (SIWB) reported 45 kts winds at 0600 UTC 2 October. Canadian buoy 44138 reported 45 kts winds with a gust to 56 kts at 1500 UTC 2 October, while Cape Race reported sustained winds of 40 kts with a gust to 52 kts at 1900 UTC that day. No reports of casualties or damages were received due to Isaac.
Back to topThe cyclone summaries are based on reports prepared by the authors and the other Hurricane Specialists at the National Hurricane Center: Lixion Avila, Eric Blake, James Franklin, Richard Knabb, Michelle Mainelli, Richard Pasch, Jamie Rhome, and Stacy Stewart. These reports are available online at www.nhc.noaa.gov/2006atlan.shtml. Ethan Gibney prepared the track map.