A Complete Explanation of Why Moored Buoy Winds are Less Than Ship Winds
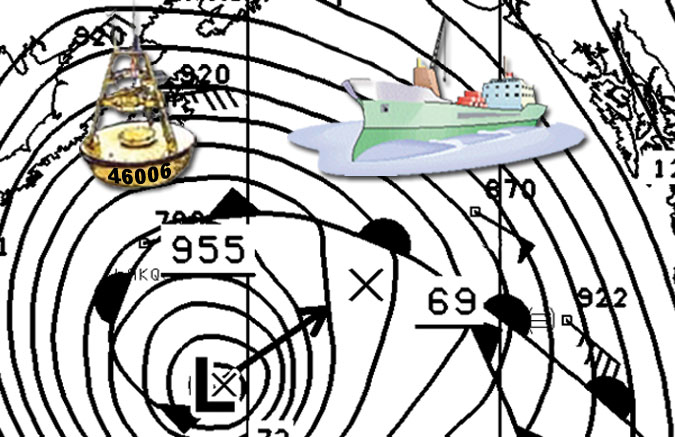
David B. Gilhousen, National Data Buoy CenterHave you ever looked at a weather map and seen a ship reporting a much higher wind speed than a nearby buoy? For example, the ship could have reported 45 kts while the buoy reports 32 kts. Mariners and forecasters have attributed the lower buoy speeds to one or more of these arguments:
- The much lower anemometer heights are on the buoy since the speed increases with height,
- Buoy motion and wave sheltering,
- Longer buoy averaging periods, or,
- Degraded sensors or "buggy" computer software on the unattended buoy.
In addition, many believe that ship anemometers, where they exist, are probably sheltered themselves, and the true, ambient wind speeds are probably higher. If this were the case, it would make the buoy bias more profound.
This article will examine each of these arguments and discover that the truth is not as simple as these blanket statements. Indeed, no one has a complete explanation for the differences. However, it does make for a catchy title.
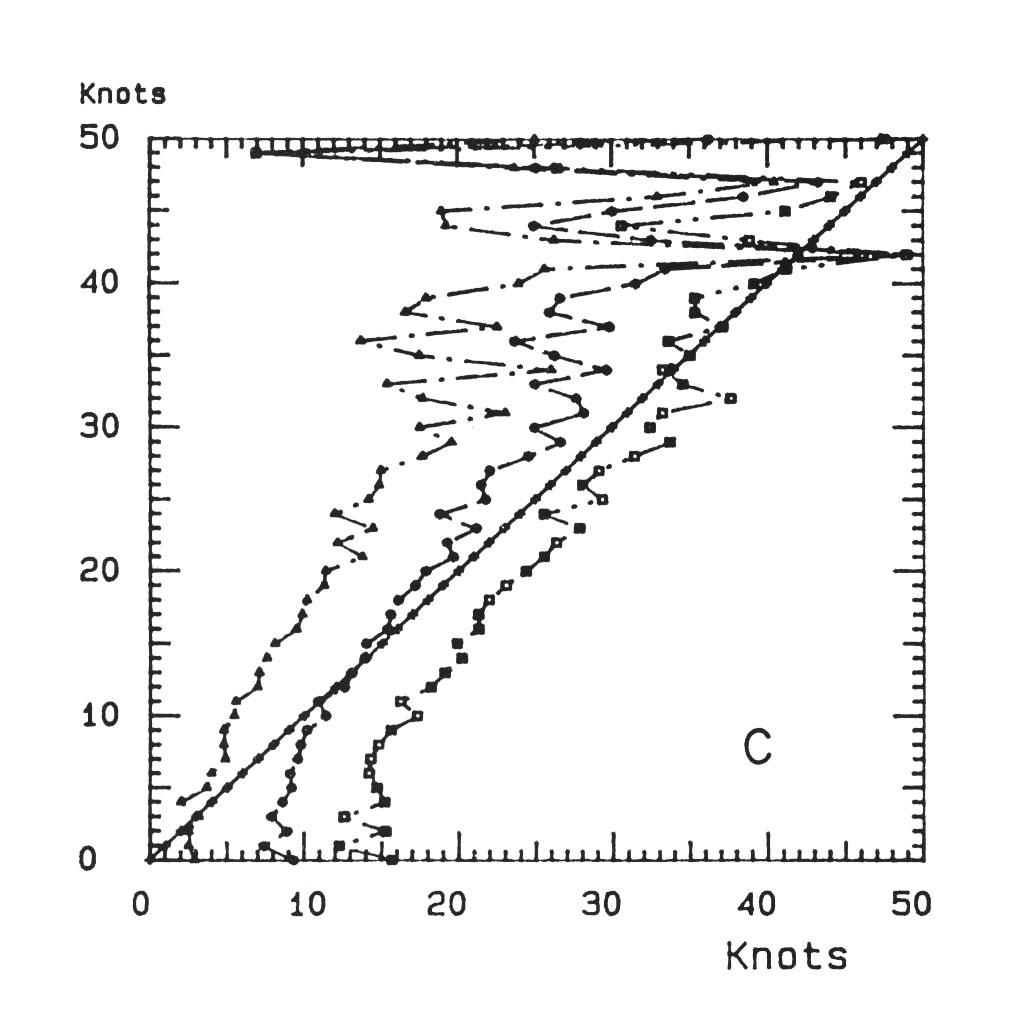
Figure 1. Counts for wind speed and direction for total sample for unclassified ships. Average plus and minus 1 standard deviation as explained in text. Marsden square 116.
Reproduced by permission of American Geophysical Union: Willard J. Pierson, Jr., Examples of Reasons for, and Consequences of the Poor Quality of Wind Data From Ships for the Marine Boundary Layer: Implications for Remote Sensing, Journal of Geophysical Research, Vol. 95, No. C8, Page 13,331, August 15, 1990.
How Buoy Speeds compare with Ship Speeds
First, before we examine each of these statements, let's look at how buoy and ship winds compare in a climatic sense. Are buoy winds always less than ship winds?
One report studied all ships reporting within 100 km of a buoy for a large area off the U.S. East Coast during a five year period (Pierson,1990). Figure 1, taken from Figure 17 of that paper, shows the average buoy speed for each one knot bin of reported wind speed by ships. The 45 degree diagonal shows the "no bias" line.
Ship observations are typically less than moored buoy winds when the buoys report less than 10 kts. Ships probably have a hard time observing really light winds because of the ship's motion. Ship and buoy winds show little mean difference in the range from 10 to 20 kts. Above 20 kts, the buoy winds exhibit a lower bias. The line gets more erratic at higher wind speed because of fewer cases of high wind.
Now, let's look at each of my earlier explanations for the lower buoy speeds:
The much lower anemometer heights are on the buoy since the speed increases with height
While this is true, the scientifically accepted profiles usually account for less than half of the observed difference in high wind speeds. When the air and sea surface temperature are about equal, or when the air temperature is colder than the sea surface temperature, the difference between the 5 m buoy height and a 30 m ship anemometer is only about 15%. This means that the 32 kts buoy report would become about 37 kts at 30 m versus the 45 kts ship observation. Consequently, the difference in anemometer height doesn't account for most of the observed differences.
Only when the air temperature exceeds the sea surface temperature by 4 degrees C or more do the profiles show that a 32 kts buoy wind would become a 44 kts 30 m wind. However, these conditions rarely happen during the higher wind speeds when the atmosphere is well mixed vertically. See http://coaps.fsu.edu/~bourassa/BVW_html/wind_profile.gif for sample vertical wind profiles.
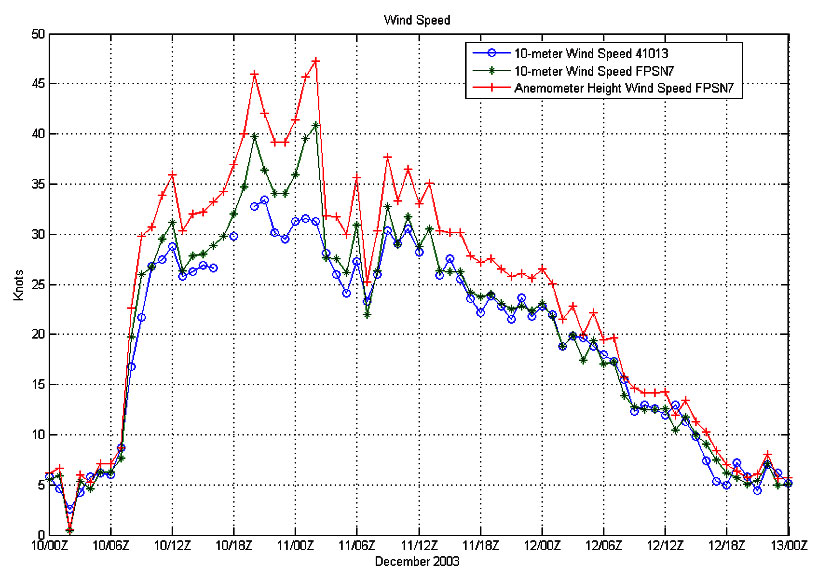
Figure 2 Time series plot of the wind speeds centered around a developing Northeaster on Dec. 11, 2003.
Buoy motion and wave sheltering
Under most typical conditions, buoy motion does not affect the wind measurements. In 1984, a 3 m discus buoy was moored next to a Coastal-Marine Automated Network (C-MAN) station at Chesapeake Light to assess just such a question. Once adjusted for height differences, 98% of the wind speeds agreed within 4 kts during a month that feature wave heights to 3.6 m (Gilhousen, 1987). In a more recent study, wind speeds measured by a 3 m discus in the Gulf of Mexico compared favorably with those measured by a more stable, University of Miami spar buoy (Graber et. al., 2000). Speeds agreed within 2 kts when the significant wave height reached 3 m.
On the other hand, many forecasters believe that when the wave heights exceed 5 m, the anemometer height of most NDBC buoys, that sheltering reduces the wind speed. Some, but not all, evidence exists to back their conclusions.
Wind speeds from 46050 were compared to those observed at the Newport, OR C-MAN station over a 10-year period (Hervey, 1999) The comparison was limited to similar onshore wind directions. The buoy speeds looked 5-10% lower than the C-MAN winds when the wind speed exceeded 35 kts. On the other hand, during the high wind cases, the differences were not related to wave height.
Another interesting data set was recently collected when winds from a 3 m discus buoy at Frying Pan Shoals, NC, 41013, were compared with those from the nearby Frying Pan Shoals Light. Figure 2 shows a time series plot of the wind speeds centered around a developing Northeaster on Dec. 11, 2003. Both the wind speed from the tower and those measured by the buoy were adjusted to 10 m. The agreement was within 2 kts until the peak of the storm when a 4-7 knot difference was observed. This correlates well to the time when the significant wave height topped 4.5 m. Since the excellent agreement resumed after the waves dropped below this height, wave sheltering is a plausible reason for the difference.
Finally, wind speeds measured by a research vessel were compared with buoy wind speeds when the ship was within 20 km of the buoy (Taylor et. al., 2002). The comparison took place off Newfoundland and included a case where the seas exceed 9 m. Once adjusted for height differences, the buoys' speeds compared quite well over the entire range of conditions and averaged only 2-3% lower than the ship's anemometer.
Longer averaging periods
Buoy winds are averaged for 8 minutes to reduce the effect of buoy motion. Many believe that a longer average results in lower mean speeds. However, 2-minute averaged wind speeds were shown to be unbiased when compared with 8-minute average wind speeds at C-MAN stations (Powell, 1993). The 2-minute averages show more hour-to-hour variability. So, longer averaging periods do not account for the bias.
Degraded sensors or "buggy" computer software on the unattended buoy
Having worked with NDBC for the past quarter century, I have collected an amusing assortment of stories on what can go wrong with automated measurements. However, a systematic and thorough program of data quality minimizes these errors (see http://www.ndbc.noaa.gov/qc.shtml). All anemometers are tested in a wind tunnel to verify performance within specifications before deployment. Two anemometers are placed on each buoy and algorithms check to make sure that the duplicate measurements track together. Gust-to-speed ratios are flagged if they are unreasonable, and wind speeds are checked with the high frequency wave energy for agreement. Buoy winds are routinely compared with model analysis winds to ensure that biases are reasonable. Data analysts daily look at the data on weather maps and suspect lists then use a variety of computer graphics to detect degradations. National Weather Service meteorologists and web users also phone or e-mail their concerns. Degraded data are removed from real-time distribution and archival.
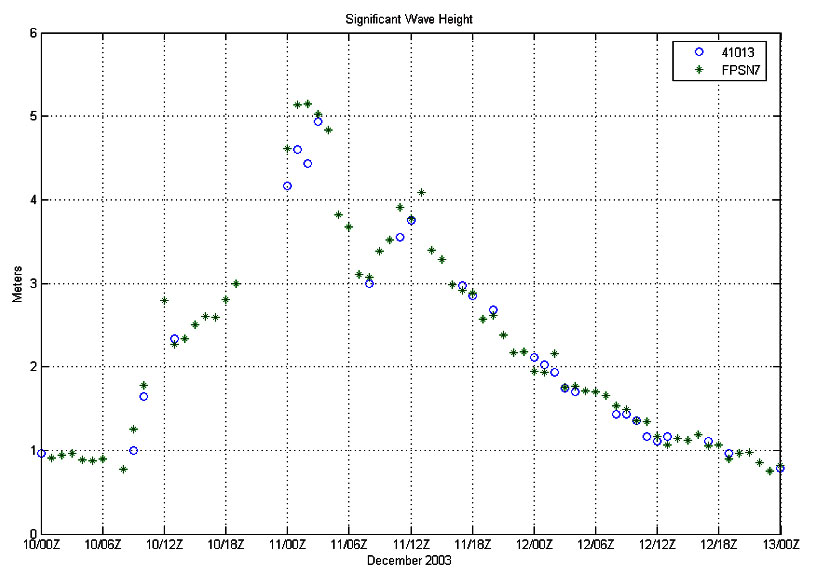
Figure 3. The ratio of the measured speed to the ambient speed.
Anemometer Exposure Issues
Finally, for those ships that do have anemometers, how does the exposure effect the measurement? Most forecasters believe that the prevalence of obstructions lower the speed, and that the ambient wind speeds are probably even higher. Recent studies by the Southampton Institute of Oceanography have modeled the airflow disturbances around a typical merchant ship. The ratio of the measured speed to the ambient speed is shown in Figure 3. Typical locations for an anemometer, above the bridge and on a foremast, are areas where the speeds would be several percent higher than the ambient. So, a small part of the reason for the difference could be the anemometer siting on the vessel.
Other Factors
What other factors could cause the differences? First, the wind can change rapidly over small distances. Many deep winter storms feature eyes or thunderstorms where the speed can change drastically in a few miles. On any given day, the differences could be the result of a natural, spatial variation. On the other hand, this will not explain why the buoy winds, on average, are lighter than the ship winds above 20 kts.
Most ships don't have anemometers, and they use the Beaufort scale to estimate the wind speed from sea state photographs. This introduces human subjectivity to the process with unknown biases. I suspect that most of the differences between buoy and ship observations result from this subjective estimate.
The conclusion is anything but clear. A simple summary is that we have two different observing processes with varying characteristics resulting in biases that can't be completely reconciled. So ponder that next time you peer at a weather map.
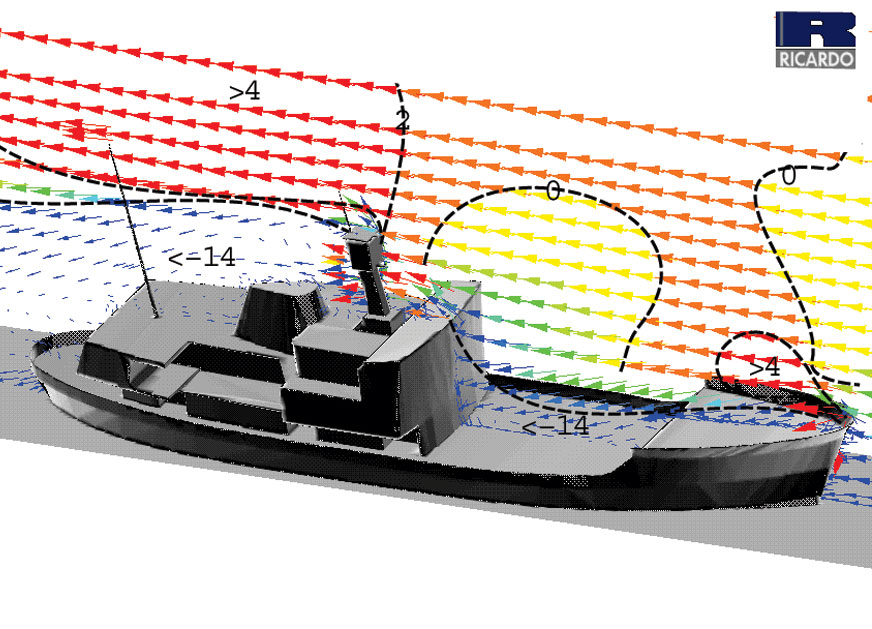
On the right, the ship disturbs the airflow-the anemometer will not measure the true value that the wind would have if the ship were not there. Using computer models, we can calculate the flow around ships and find out how big this error is, or we can place a model of the ship in a wind tunnel and measure the error for different wind directions. For further information on flow distortion studies see Yelland et al. (2002)
Yelland, M. J., B. I. Moat, R. W. Pascal and D. I. Berry, 2002: CFD model estimates of the airflow over research ships and the impact on momentum flux measurements, Journal of Atmospheric and Oceanic Technology, 19(10), 1477-1499.
References
- Gilhousen, D.B., 1987: A field evaluation of NDBC moored buoy winds. J. Amos. Oceanic Technol., 4, 94-104.
- Graber, H.C. , E.A. Terray, M.A. Donelan, W.M. Drennan, J.C. Van Leer, and D.B. Peters, 2000: ASIS-A New Air-Sea Interaction Spar Buoy: Design and Performance at Sea. J. Amos. Oceanic Technol., 17, 708-720.
- Hervey, R., 1999: Are Moored Buoy Winds Too Low in High Seas? Third Conference on Coastal Atmospheric and Oceanic Prediction and Processes, American Meteorological Society, 43-46.
- Pierson, W.J., 1990: Examples of, reasons for, and consequences of the poor quality of wind data from ships for the marine boundary layer: Implications for remote sensing. J. Geophys. Res., 95, 13,313-13,340.
- Powell, M.D, 1993: Wind Measurement and Archival under the Automated Surface Observing System (ASOS): User Comments and Opportunity for Improvement. Bull. Amer. Meteor. Soc., 74, 615-623.
- Taylor, P.K., E. Dunlap, F.W. Dobson, R.J. Anderson, and V.R. Swail, 2002: Proceedings WMO Data Buoy Cooperation Panel, available at http://www.jcommops.org/dbcp/doc/DBCP-21/TOC.htm.