When Do Ocean Waves Become 'Significant'? A Closer Look at Wave Forecasts
Tom Ainsworth, NOAA/National Weather Service Forecast Office, Juneau, AKAnyone who has spent time on a vessel, large or small, can probably recall an encounter with significant waves. Of course, the size of wave that someone considers to be 'significant' is very subjective and dependent on the size of the vessel on which that person's encounter took place. When my family and I moved to Juneau a number of years ago, we sailed on the 408-foot Alaska State Ferry 'Matanuska' from Bellingham, WA. While crossing Queen Charlotte Sound off British Columbia in gale force winds on a Saturday afternoon, the ship rolled through seas I estimated to be 15- or 20-feet high on average. We were watching a movie in a theater room on the 4th deck when, out of the blue, the port side windows were slammed by a drenching wave. As the water poured off the deck and back into the Sound, my wife and I exchanged silent glances. Not long before this power-washing wave hit, people were outside our window gripping the rail and squinting with awe into the wind that required a forward lean and wide stance to maneuver through. Until that wave, our seats were at least 15 feet above the tops of the foaming wave crests. In my opinion, that solitary wave that hit the side of the 4th deck of the Matanuska was certainly a significant one. But the term 'significant wave height' has a specific definition, and anyone using marine weather information should have a clear understanding of what it means.
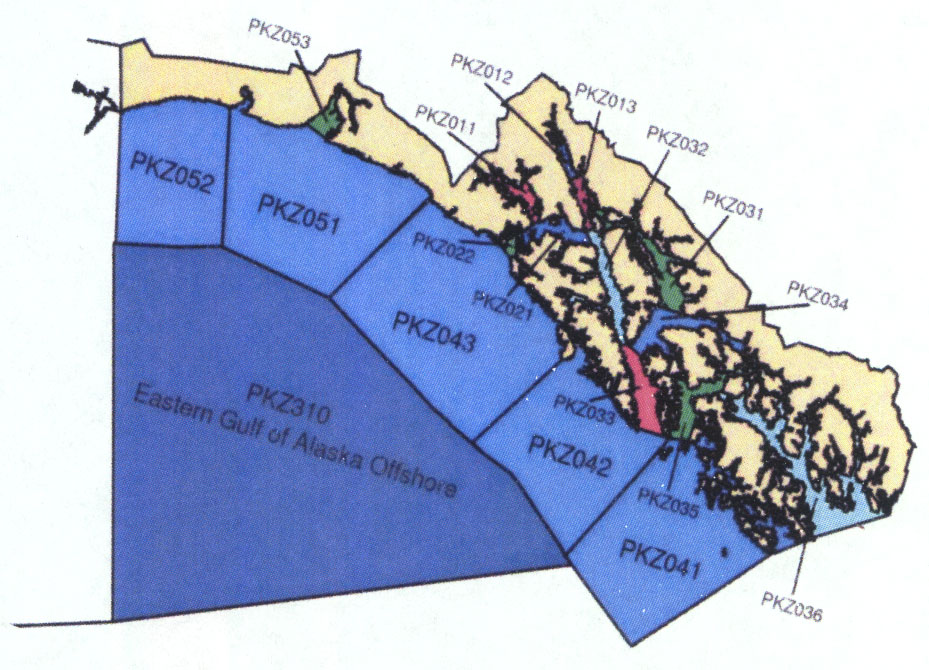
Figure 1. NOAA's National Weather Service Forecast Office (WFO) in Juneau is responsible for informing citizens about weather conditions over a 150,000 square mile area that includes the east half of the Gulf of Alaska and the entire Alaska Panhandle
NOAA's National Weather Service Forecast Office (WFO) in Juneau is responsible for informing citizens about weather conditions over a 150,000 square mile area that includes the east half of the Gulf of Alaska and the entire Alaska Panhandle. More than half of our forecast area is over water. Mariners on southeast Alaska waters comprise a large percentage of our audience and seek out weather information daily. This diverse audience is comprised of weekend recreational boaters, commercial fishers, and large passenger ships. WFO Juneau's marine weather forecasts include information about prevailing wind speed and direction and significant wave height. As we head toward the warmer months of the year, when southeast Alaska waters become more populated, let's review basic ocean wave characteristics so that mariners can interpret marine weather forecasts as NWS forecasters intended. (Figure 1.)
Wave Formation: Waves are formed by wind blowing along the water's surface. Wave height is dependent on a) wind speed; b) fetch length; and c) duration of time the wind blows consistently over the fetch. (Figure 2.)
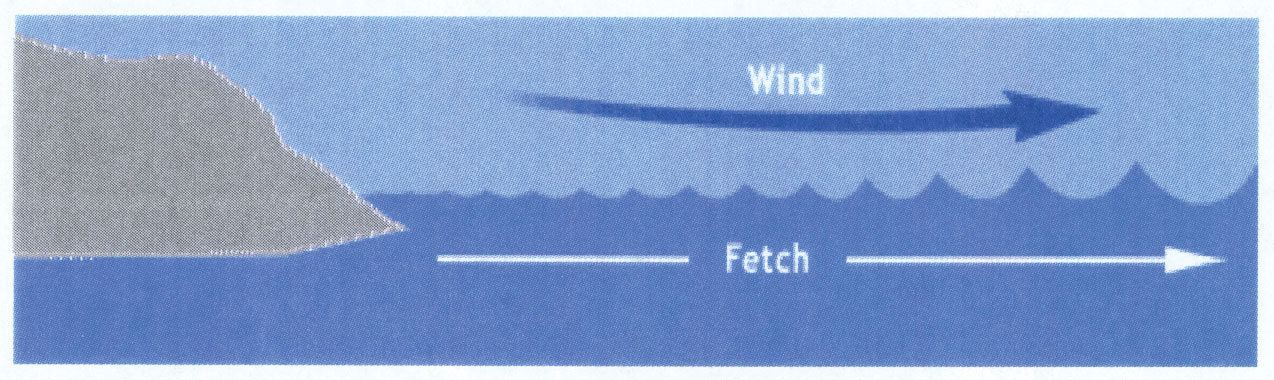
Figure 2. Wave height is dependent on a) wind speed; b) fetch length; and c) duration of time the wind blows consistently over the fetch.
Graphic courtesy of Tammy Pelletier, WA State Dept of Ecology
Wind 'fetch' is the distance the wind blows over water with similar speed and direction. Higher wind speeds blowing for long periods of time over longer stretches of water result in the highest waves. Waves that are the direct result of the local wind are called wind waves. Wind waves are short, choppy, and tend to break (white cap) when winds reach about 12 knots. These are the most common waves on lakes, ponds and in the confined, narrow stretches of southeast Alaska's inner channels.
Wave pattern considerations become more complex in the Open Ocean and Gulf of Alaska. Waves are still formed by the local wind, but, once formed, ocean waves can continue to travel along great circle routes for thousands of miles. Waves that travel outside of their generation area and are no longer the result of the local wind are called "swell." Compared to wind waves, swell have smoother crests. Over time, swell "packets" or "groups" travel great distances, converge with other waves caused by distant storms traveling in different directions, and refract off coastlines. Therefore, the ocean surface is comprised of thousands of interacting waves that originated in different places and traveled in different directions at different speeds. This is known as a "wave spectrum"-a combination of waves with different heights, frequencies and direction of movement.
In southeast Alaska, the wave spectrum, or range of wave heights, is different in the inner channels than it is in the open Gulf. The inner channels are dominated by wind waves, and, except for near entrances to the open ocean, experience fewer swell. The open Gulf contains a broader range of wave heights.

Figure 3. Wave height is the distance measured from the trough to the crest of the wave. Wave length is the distance between successive crests (or troughs).
Graphic courtesy of Tammy Pelletier, WA State Dept of Ecology
Wave Dimensions: The magnitude of a wave is determined by three components: height, length, and period (or frequency). A fourth wave component is steepness. Wave height is the distance measured from the trough to the crest of the wave. Wave length is the distance between successive crests (or troughs) (Figure 3). Wave period is the time that elapses between the passing of successive crests (or troughs). Wind waves tend to have smaller heights and have shorter periods than swell. Wave steepness is the slope determined by the ratio between wave height and wave length. When wind wave heights and periods are close to the same value (e.g., six foot seas every six seconds), wave steepness is severe and pitch poling becomes a real possibility for smaller vessels, as does capsizing in beam seas. The farther waves move away from their source region, the more their wave length and period gradually increase. Therefore, waves with long periods, greater than 10 or 12 seconds, are arriving from a distant source and are considered swell.
Significant Wave Height: By now you know a wave spectrum is an extremely complex fluid phenomenon. The spectrum is literally made up of waves on top of waves (on top of waves!). It is extremely important for mariners to understand how this spectrum of wave heights is conveyed in marine weather information. The wave height value in a forecast, and reported by ships and buoys, is called the significant wave height. Significant wave height (Hs) is defined as the average height of the highest one-third waves in a wave spectrum. This happens to correlate very well with the wave height a skilled observer perceives in a wave spectrum.
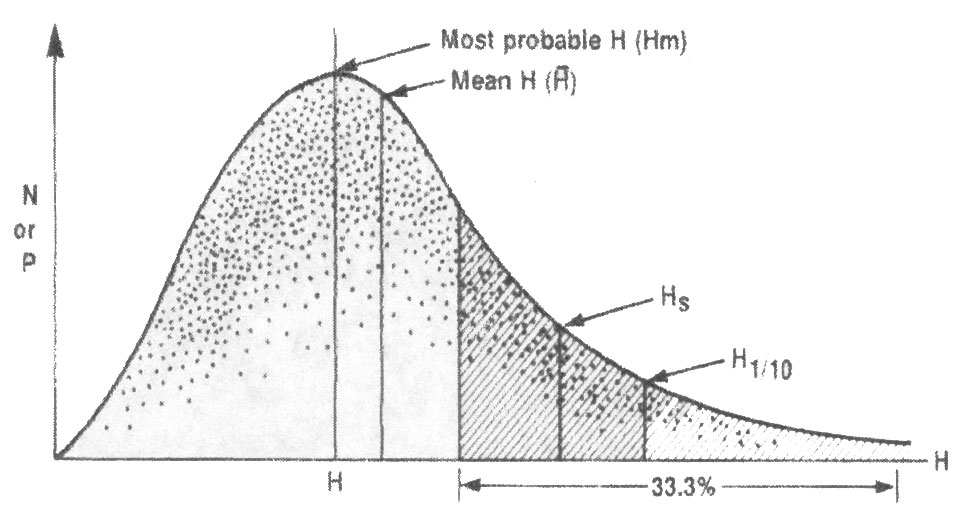
Figure 4. The statistical distribution of wave heights showing various parameters
(from Bretschneider, 1964)
What do we mean by "highest one-third waves"? Remember, a wavy water surface is comprised of thousands of interacting waves that originated in different places and traveled in different directions at different speeds. If a person could filter out and plot on a graph all of the waves that make up a spectrum, the distribution of waves with different heights would result in a "bell curve" graph similar to the one in the figure above. Each dot represents the number of waves (N) in the spectrum with a height of H. The graph shows there are a relatively low number of small waves (left side of graph) and a low number of very large waves (right side of graph). The greatest number of waves (N) in this spectrum falls in the mid range of heights (centered under Hm). The highest one-third (33.3%) number of waves in this spectrum is shaded on the graph. The average height of waves in this shaded group is the significant wave height, Hs.
Also shown are the mean wave height (H), most probable wave height (Hm), and the height of the highest 10% of waves (H1/10). The mean wave height H is approximately equal to 2/3rds (0.64) the value of Hs and H1/10 is approximately equal to 1.27 times the value of Hs. In addition, the height of the highest 1% of waves (H1/100) is approximately equal to 1.67 times Hs, and a theoretical maximum wave height (Hmax) is approximately equal to two times Hs.
Quiz Time! Let's take a minute and put all these wave heights that we have learned about into perspective by practicing how to derive pertinent wave characteristics. If you read a marine weather forecast predicting "SEAS 10 FT," what is really being conveyed in that forecast?
Hs = 10 ft
H (mean) = (0.64)Hs = 6.4 ft
H (most probable) = 6 ft
H1/10 (10% highest waves) = (1.27)Hs = 12.7 ft
H1/100 (1% highest waves) = (1.67)Hs = 16.7 ft
Hmax (highest wave you should be on the alert for) = 20 ft!
Mariners should know the physical limits of their vessels-both wind speed limits and wave height limits. The marine weather forecasts provide both wind velocity (speed and direction) information and wave height information. Wave height values, both predicted and observed, are defined as the significant wave height, denoted as Hs. Hs is not a single value by any means but rather a value which represents a range of heights occurring in a wave spectrum from approximately 60% of Hs to 200% of Hs! This range is somewhat less in narrower inland channels, where the contribution of ocean swell is less. Mariners can reduce their risk of encountering bigger than expected waves by understanding the range of wave heights in a spectrum defined by a particular significant wave height. The wave that crashed into the 4th deck of the Matanuska ferry some years ago, while crossing Queen Charlotte Sound, was within the range of Hmax for a spectrum of waves whose mean height is 15 feet. Mariners must not focus on a single significant wave height value in a forecast or observation but recognize the concept of the wave spectrum.