Marine Weather Review—North Atlantic Area September through December 2005
By George P. Bancroft, NOAA National Center for Environmental PredictionThe period started out with a late summer pattern and a continuation of a very active hurricane season. September contributed three hurricanes, which moved into OPC's marine area of responsibility north of 31N and west of 35W. Late-season tropical activity, in what would turn out to be a record season, included two hurricanes in October, a tropical storm in November and a hurricane in December. The latter two were named using letters from the Greek alphabet, since for the first time there were so many tropical cyclones in 2005 that the National Hurricane Center ran out of names from the regular list for 2005.
Non-tropical storm activity picked up as the season progressed with most of the major systems tracking in a southwest to northeast direction. Ten hurricane-force storms developed during the period, with the active months being November and December with three each. The first hurricane-force low in early September, and possibly the one late in September, appeared to have tropical origins.
Tropical Activity
Hurricane Maria: Maria formed south of OPC's marine area on September 1 and moved northwest, entering OPC's waters about 400 nmi east of Bermuda as a hurricane on the evening of September 4, with maximum sustained winds of 75 kts with gusts to 90 kts. The cyclone attained Category 3 status on the Saffir-Simpson scale of intensity (Reference 1), a major hurricane, which recurved to the NNE twenty-four hours later. The maximum strength was 100 kts with gusts to 120 kts at this time when the cyclone was located near 33N 56.5W. Maria subsequently weakened while tracking northeast, becoming a strong tropical storm on the evening of the 6th. The ship Marinus Green (PECS) near 34N 49W, reported a southwest wind of 35 kts at 1200 UTC on the 7th while Maria passed about 120 nmi to the northwest. After re-intensifying to a hurricane on the evening of the 8th, Maria weakened to a tropical storm with maximum winds 55 kts and gusts to 65 kts early on September 9, near 40N 44W, and became extratropical early the next day. Figure 1 shows Maria re-developing into a powerful extratropical storm in the thirty-six hour period ending at 1800 UTC September 11. The central pressure reached as low as 962 hPa at 0000 UTC on the 12th. In an area of sparse ship data, high-resolution QuikScat data (Figure 2) reveal several barbs in the 60 to 70 kts range on the south side of the storm center. A ship report came in later, at 0900 UTC September 12 from the Godafoss (V2XM), near 60N 32W on the north side of the storm, with northeast winds of 52 kts. The storm subsequently weakened to gale while passing east of Iceland on the 13th.
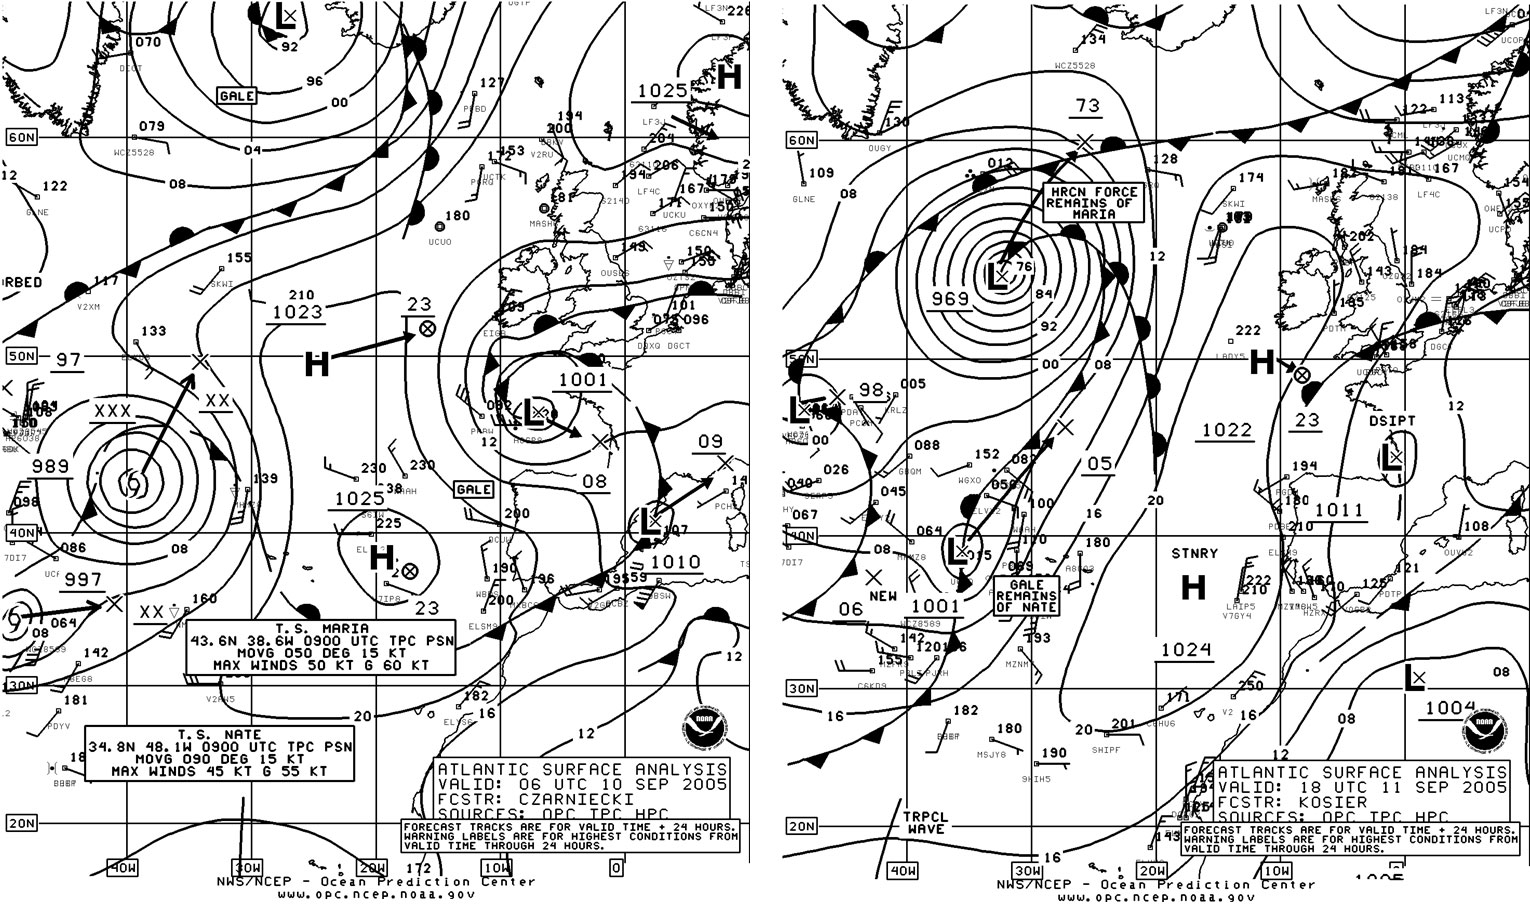
Figure 1. (above) OPC North Atlantic Surface Analysis charts (Part 1 - east) valid 0600 UTC September 10 and 1800 UTC September 11, 2005, showing Tropical Storm Maria becoming an extratropical hurricane-force storm.
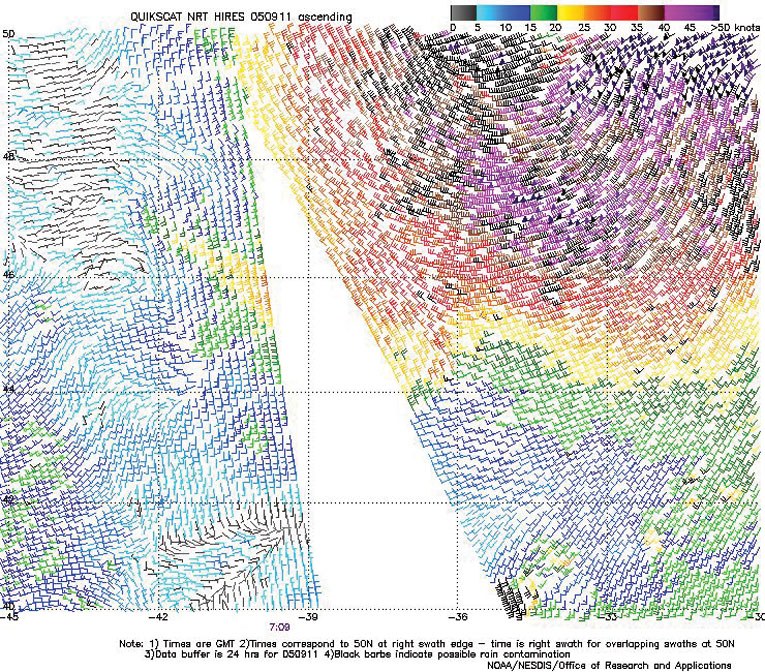
Figure 2. (left) High-resolution QuikScat scatterometer image of satellite-sensed winds on the south side of the storm shown in Figure 1, valid at about 0709 UTC September 11, 2005. The resolution of the image is 12.5 km, versus 25 km for the coarser-resolution version of the imagery. The valid time of the pass is about eleven hours prior to the valid time of the second part of Figure 1.
Image is courtesy of NOAA/NESDIS/Office of Research and Applications.
Hurricane Nate: Nate developed from a non-tropical low 300 nmi southwest of Bermuda late on September 5 and rapidly developed into a hurricane on the morning of the 7th, before crossing 31N and entering OPC's marine area near 63W at mid-day on the 8th as a hurricane with maximum sustained winds of 75 kts with gusts to 90 kts. The cyclone then began to weaken while tracking northeast, becoming a tropical storm near 34N 55W by mid-day on the 9th with maximum sustained winds 60 kts with gusts to 75 kts. Nate then weakened further and became an extratropical gale near 35N 44W on the afternoon of the 10th and merged with the front associated with the remains of Maria (Figure 1) before heading northeast and dissipating west of France late on September 12.
Hurricane Ophelia: Ophelia developed from a non-tropical low in the northern Bahamas early on September 6 and followed an erratic track off the north Florida coast, with some fluctuations in intensity between tropical storm and hurricane strength noted on the 8th and 9th, before crossing 31N near 77W as a minimal hurricane early on the 10th. Northeast winds increased in OPC's southern offshore waters in advance of Ophelia, with the Madison Maersk (OVJB2) near 31N 79W reporting northeast winds 39 kts at 1200 UTC on the 8th. The slow-moving Ophelia tracked northeast and brushed the North Carolina Outer Banks late on the 14th and on the 15th before moving away from the coast. The cyclone reached maximum intensity early on the 11th (near 32N 76W) and again late on the 14th near the Outer Banks, after briefly weakening to a tropical storm on the 12th. At maximum intensity, Ophelia packed maximum sustained winds of 75 kts with gusts to 90 kts as a Category 1 hurricane. The maximum wind and sea conditions occurred with the passage of Ophelia as shown in the ship, buoy, and automated coastal (C/MAN) reports listed in Table 1. The cyclone then accelerated northeast on the 16th and 17th as a slowly-weakening tropical storm, becoming an extratropical gale-force low on the south coast of Nova Scotia early on the 18th. The remains of Ophelia then headed across the North Atlantic before dissipating over the North Sea on September 23.
| OBSERVATIONS | POSITION | DATE/TIME (UTC) | WIND | SEAS (m/ft) |
|---|---|---|---|---|
| Singapore Bay (MRGU3) | 34N 75W | 10/1800 | E 40 | |
| CSX Liberator (KHRP) | 31.5N 78W | 13/0600 | S 50 | |
| Maersk New Orleans (ELZY3) | 32.5N 76.5W 32N 77W |
14/0600 14/1500 |
SE 60 SW 55 |
12.0/40 |
| Montebello (DGZN) | 31.5N 78W | 14/0600 | SW 50 | 9.5/31 |
| MOL Americas (V2EX) | 35N 75W | 14/2100 | SE 65 | |
| Buoy 41002 | 32.3N 75.4W | 11/1900 10/2300 |
E 47 G68 | 6.0/20 maximum 7.0/23 |
| Buoy 41004 | 32.5N 79.1W | 13/2000 14/0100 |
NW 45 G56 Peak gust 60 |
5.5/18 |
| Buoy 41013 | 33.4N 77.7W | 14/1800 | W 54 G64 Peak gust 68 |
6.5/21 |
| Buoy 41035 | 34.5N 77.3W | 14/2000 | NE 47 G56 | |
| Peak gust 62 | 14/0700 14/2100 |
5.5/18 |
||
| Cape Lookout (CLKN7) | 34.6N 76.4W | 14/2200 14/2300 |
SE 54 G66 Peak gust 75 |
|
| Buoy 41025 | 35.0N 75.4W | 15/1600 15/1900 |
SE 51 G 64 Peak gust 70 |
6.5/21 maximum 7.0/23 |
| Buoy 44004 | 38.5N 70.5W | 17/0800 | SW 37 G47 Peak gust 52 |
7.0/23 |
| Buoy 44008 | 40.5N 69.4W | 17/1200 17/1500 |
NE 29 G39 Peak gust 45 |
4.0/13 maximum 4.5/15 |
| Table 1. Ship, buoy and coastal C/MAN station observations taken during Ophelia. Winds, gusts and peak gusts are given in knots. | ||||
Hurricane Vince: A non-tropical low which had been nearly stationary in the far eastern Atlantic between the Canary Islands and the Azores developed tropical characteristics at mid-day on October 9 and was named as a tropical storm with maximum sustained winds of 45 kts with gusts to 55 kts. Vince then developed an eye and became a hurricane late that day with maximum sustained winds of 65 kts with gusts to 80 kts, despite sea surface temperatures reported by a nearby drifting buoy (13604, 34.6N 18.4W) of only 23 degrees Celsius. Vince accelerated northeast as a frontal system approached from the northwest and weakened to a tropical storm early on October 10. After further weakening, Vince passed just south of Portugal before making landfall as a tropical depression in southern Spain early on October 11, becoming the first tropical cyclone to make landfall on the Iberian Peninsula (Reference 2).
Hurricane Wilma: Wilma, after moving off the Florida coast early on October 24, entered OPC's southwest waters as a major hurricane on the evening of the 24th, near 32N 74W, with maximum sustained winds of 110 kts with gusts to 135 kts (Category 3 on the Saffir-Simpson scale). This made Wilma the strongest hurricane to affect OPC's waters during the 2005 Atlantic season. Wilma then accelerated northeast in the warm sector of a developing non-tropical low-pressure area while weakening, but remaining a hurricane through late afternoon on the 25th before becoming extratropical at 0000 UTC October 26 (Figure 3). The ship Pirate Expeditions (WDC5736), well southeast of Wilma, near 32N 63W reported south winds of 35 kts and 8.0 m seas (27 ft) at 1200 UTC on the 25th. Other reports were closer to Wilma, but on the cold side of the extratropical low northwest of Wilma, and are shown in Table 2. Wilma's remains dissipated just south of the island of Newfoundland late on the 26th, while the parent low near the New England coast moved to the Canadian Maritimes as a gale.
| OBSERVATION | POSITION | DATE/TIME(UTC) | WIND(kt) | SEAS(m/ft) |
|---|---|---|---|---|
| Undine (SHJC) | 40N 70W | 25/1200 | NE 58 | |
| Buoy 41002 | 32.3N 75.4W | 25/0300 25/0800 |
N 35 G43 | 3.0/10 maximum 7.5/25 |
| Buoy 41001 | 34.7N 72.7W | 25/1000 25/1400 |
W 29 G39 | 2.5/8 6.5/21 |
| Buoy 44008 | 40.5N 69.4W | 25/1400 25/1500 25/1300 |
E 39 G 47 Peak gust 52 |
7.5/25 maximum 8.5/28 |
| Buoy 44005 | 43.2N 69.2W | 25/1700 25/1800 25/2300 |
NE 39 G49 Peak gust 51 |
6.0/20 maximum 7.5/25 |
| Buoy 44137 | 42.3N 62.0W | 25/2100 | NE 43 G 56 | 7.5/25 |
| Isles of Shoals (IOSN3) | 43.0N 70.5W | 25/1600 | NE 46 G 56 | |
| Table 2. Some ship, buoy and coastal C/MAN observations taken during passage of Wilma and associated extratropical low. | ||||
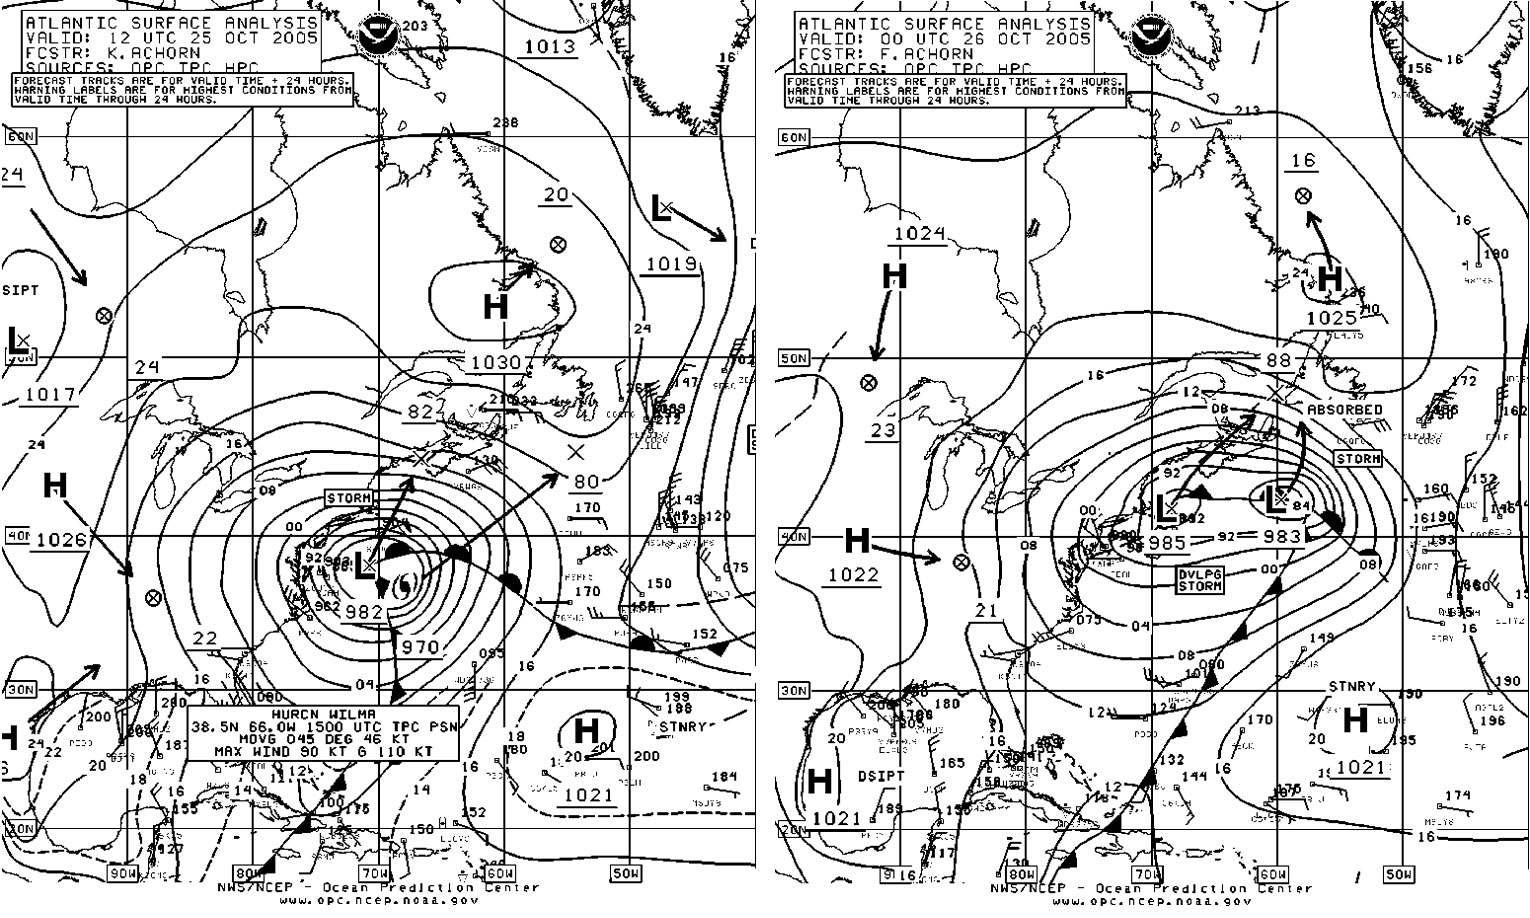
Figure 3. OPC North Atlantic Surface Analysis charts (Part 2 - west) valid 1200 UTC October 25 and 0000 UTC October 26, 2005. Hurricane Wilma is shown in transition to an extratropical storm.
Tropical Storm Delta: A strong cutoff low developed near 31N 40w early on November 21, remained nearly stationary through the 22nd while slowly intensifying, and then moving south of the waters. The Chiquita Belgie (C6KD7) near 31N 44W reported north winds of 45 kts at 1800 UTC on the 22nd. The low developed tropical characteristics south of the area late on the 23rd and was named Tropical Storm Delta, near 26N 40W. The cyclone drifted south, before accelerating northeast on the 26th and 27th. Although the center was well south of 31N prior to the 27th, the large circulation extended into OPC's high seas area. Delta became extratropical late on the 28th as it turned east along 30N and merged with a frontal zone. The ship (V2QL) (31N 12W) reported a north wind of 40 kts and seas 2.5 m (9 ft) at 1200 UTC November 29 as extratropical Delta was moving into Morocco.
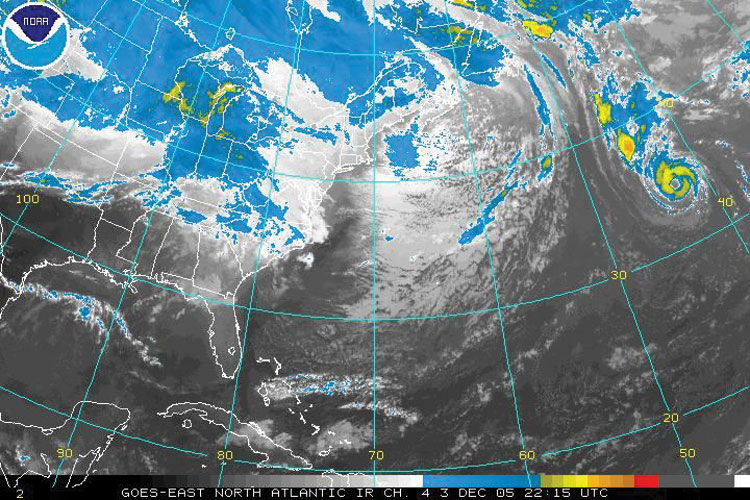
Figure 4. GOES-East enhanced infrared satellite image valid at 2215 UTC December 3, 2005, showing late-season Hurricane Epsilon near maximum intensity. Satellite senses temperature on a scale from black (warm) to white (cold) in this type of imagery, with the colder higher-topped clouds computer-enhanced.
Hurricane Epsilon: Epsilon formed from another non-tropical cutoff low near the southern edge of OPC's high seas area 700 nmi east of Bermuda on November 29. The low was upgraded to a tropical storm at 1500 UTC that day with maximum sustained winds of 40 kts with gusts to 50 kts. The cyclone drifted erratically westward through November 30 before turning more north and then northeast on December 1, while intensifying. Epsilon became a hurricane early on December 2 near 34N 48W with maximum sustained winds 65 kts with gusts to 80 kts. Figure 4 shows Epsilon near maximum intensity with a well-defined eye surrounded by a ring of cold-topped (enhanced) clouds. Although fronts are apparent in the image, especially the stronger one moving southeast of Newfoundland, Epsilon remained cut off from the westerlies. After weakening briefly to a tropical storm early on the 4th, Epsilon attained maximum intensity as a hurricane at 1500 UTC on the 4th with maximum sustained winds of 75 kts with gusts to 90 kts. The cyclone then turned more southeast, reaching 33N 34W late on the 5th before turning southwest and passing south of the area as a hurricane late on December 6. Epsilon then weakened to a tropical storm south of the area late on the 7th (Figure 12) and to a remnant low on the 8th.
Other Significant Events of the Period
North Atlantic Storm, September 28-30: The developing low and trailing cold front seen in the first part of Figure 5 had absorbed the remains of Tropical Depression Rita over the central U.S. twenty-four hours earlier. The system rapidly intensified, especially after passing northeast of Newfoundland, with the second part of Figure 5 showing the storm near maximum intensity. Available ship reports were mainly in the Labrador Sea on the 28th, with the vessel Lykes Pioneer (PDHW) reporting north winds of 40 kts near 53N 51W at 1200 UTC on the 28th. Six hours later, the ship Sloman Provider (DLBJ) (55N 51W) encountered north winds of 40 kts and 4.5 m seas (15 ft). The storm moved through an area of sparse ship data, but a QuikScat pass taken near the time of maximum intensity (Figure 6) reveals winds to 75 kts on the northwest and southwest sides of the storm. The wind directions appear to be dubious on the lower right side of the image. The southern tip of Greenland is near the upper left corner. The storm subsequently began to weaken and passed east of Iceland late on September 30.
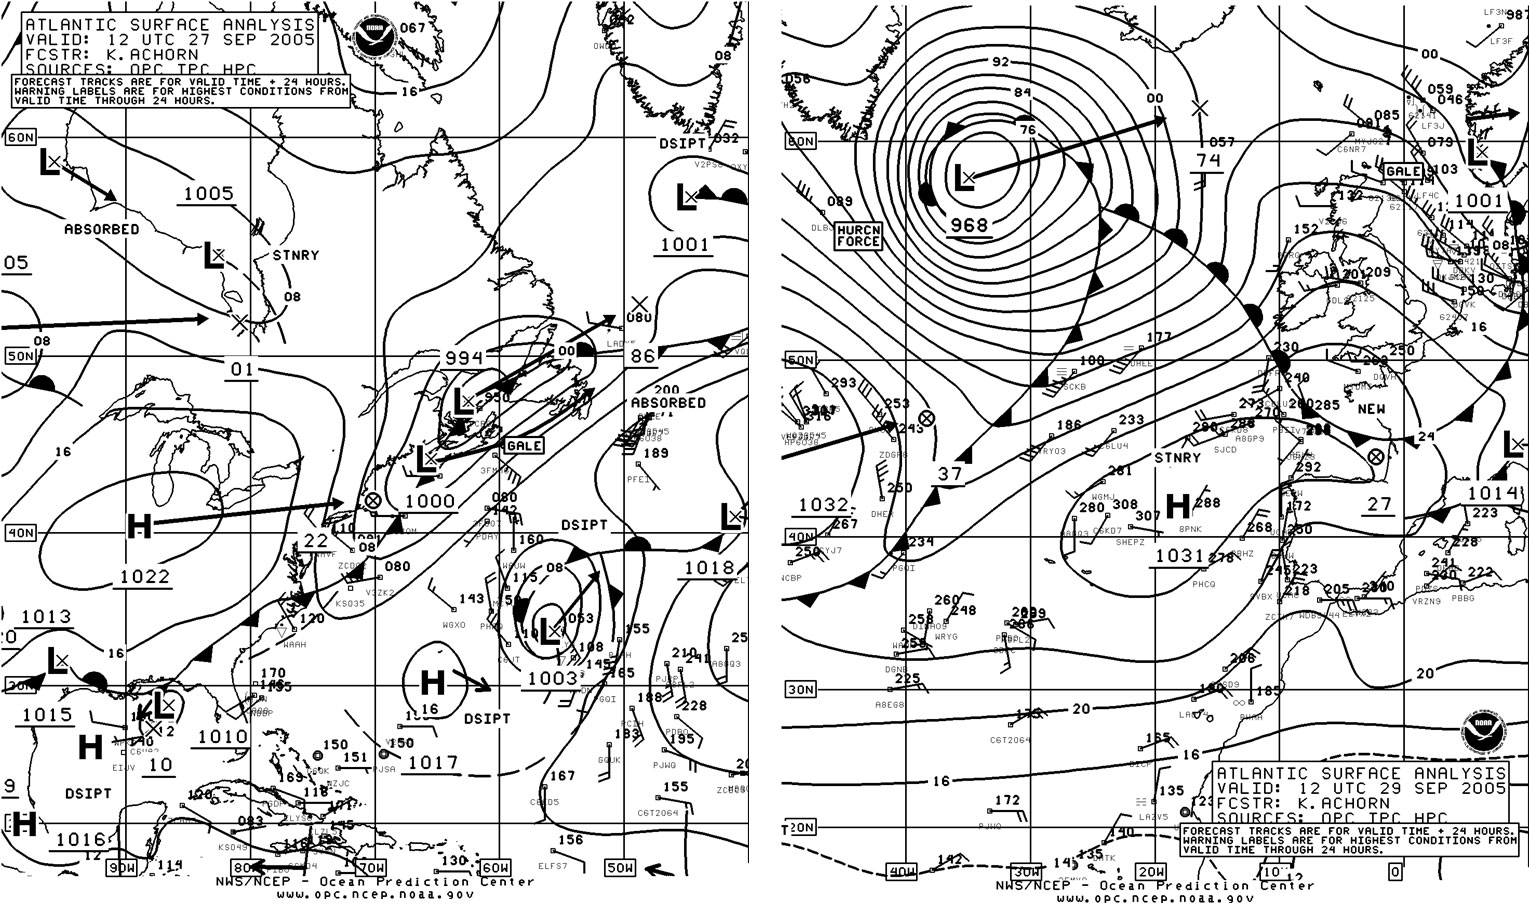
Figure 5. OPC North Atlantic Surface Analysis charts valid 1200 UTC September 27 (Part 2) and 1200 UTC September 29, 2005 (Part 1).
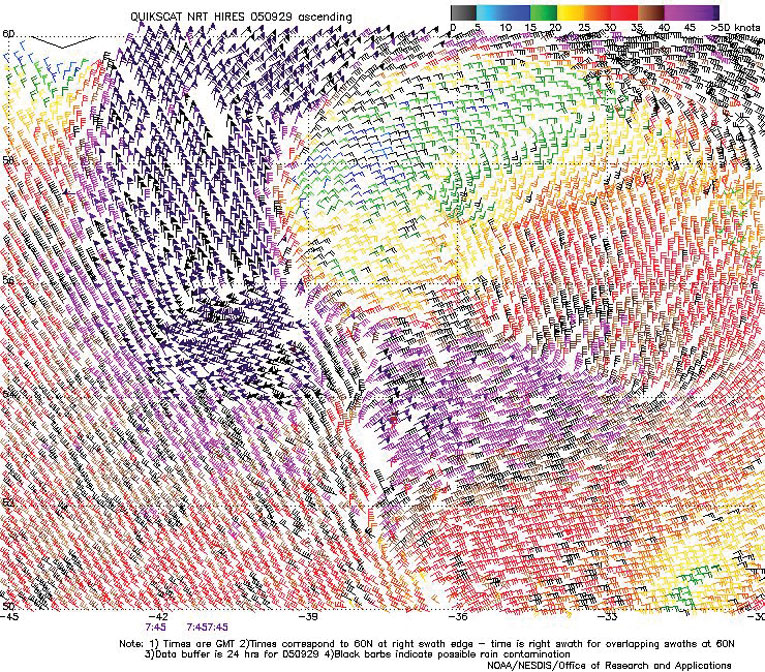
Figure 6. High-resolution QuikScat scatterometer image of satellite-sensed winds around the storm shown in Figure 5. The valid time of the pass is 0745 UTC September 29, 2005, or four and one-quarter hours prior to the valid time of the second part of Figure 5.
Image is courtesy of NOAA/NESDIS/Office of Research and Applications.
Northeast Atlantic Storm, October 8-10: This development was similar to the previous but about 20 degrees of longitude farther east. The low center moved from 53N 42W to 57N 18W while the central pressure dropped 27 hPa, from 1000 hPa to 973 hPa, in the twenty-four hour period ending at 1200 UTC October 9. The Charles Darwin (GDLS) near 57N 10W reported south winds of 50 kts at this time. OPC briefly classified the system as a hurricane-force low six hours later when the low passed northwest of Great Britain, with a 969 hPa center. There was one wind barb with 65 kts in the afternoon high-resolution QuikScat pass on the 9th near northern Scotland (not shown). At 0000 UTC October 10 the Nuka Arctica (59N 9W) and the buoy 62138 (58.5N 2W) reported south winds of 50 kts. The system then weakened and passed northeast of Iceland on the 10th.
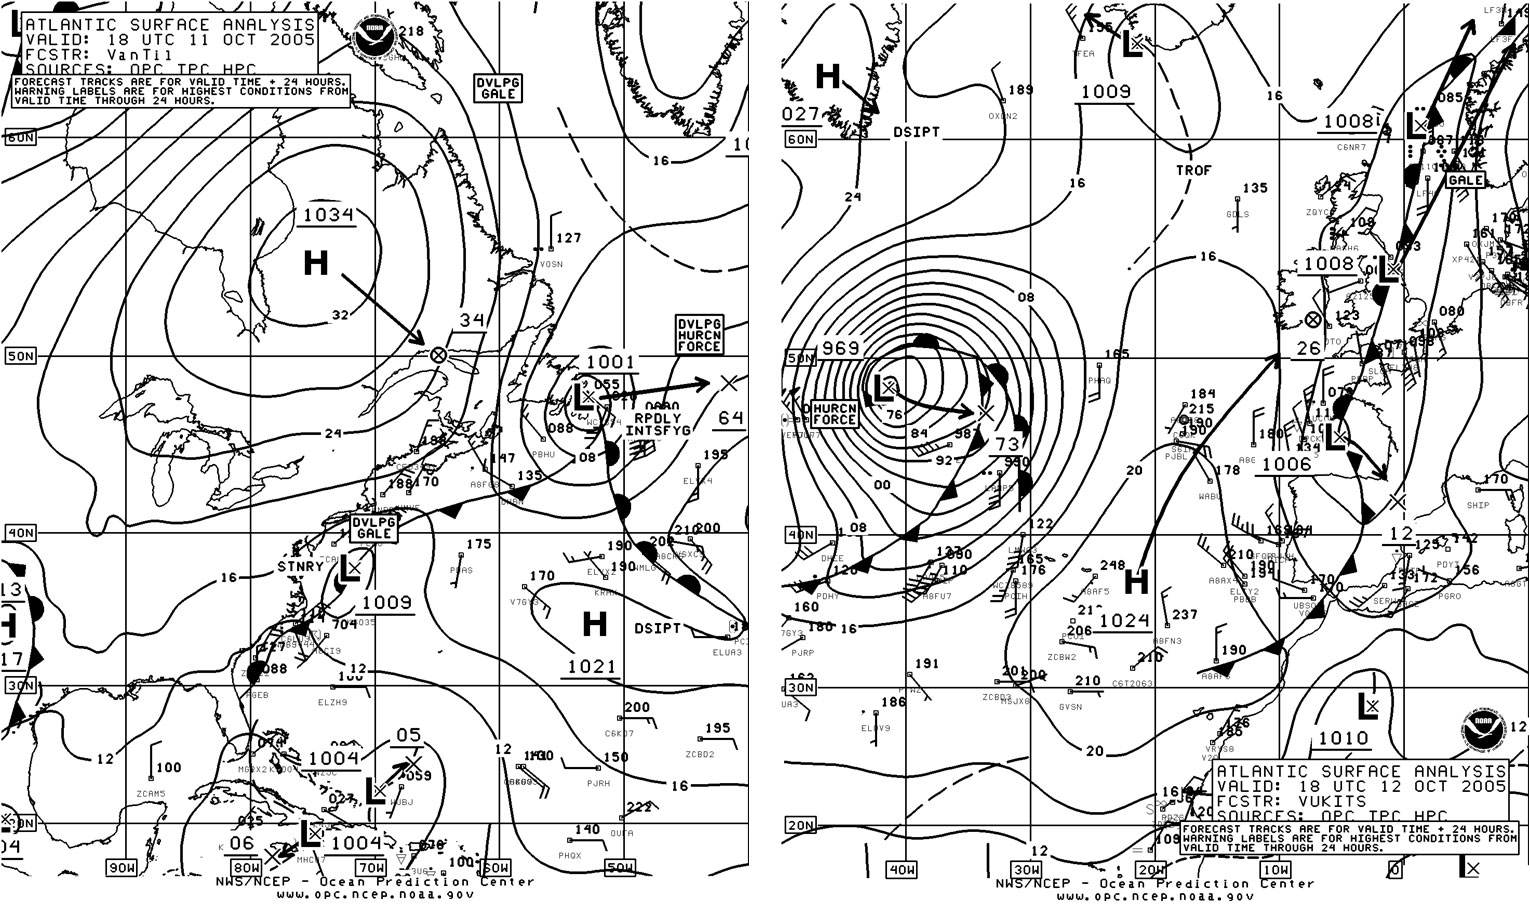
Figure 7. OPC North Atlantic Surface Analysis charts valid 1800 UTC October 11 (Part 2) and 1800 UTC October 12 (Part 1), 2005.
North Atlantic Storm, October 11-15: The development of this storm is shown in Figure 7, with a track farther south than in the previous two events. The central pressure dropped an impressive 32 hPa in the twenty-four hours covered in Figure 7, or more than 1 hPa per hour. The track took the rapidly deepening system over the Grand Banks platforms, with Platform (VEP717) (46.7N 48.7W) encountering northwest winds of 65 kts at 1800 UTC October 12, while nearby HP6038 (46.4N 48.4W) reported northwest winds of 55 kts. A high-resolution QuikScat pass taken a few hours later showed a swath of 50 to as high as 70 kts on the west northwest sides of the storm center. The system then moved east near 47N until late on the 13th, when it turned north. At 1200 UTC October 13 the Atlantic Companion (44N 40W) reported northwest winds of 60 kts. The system subsequently made a loop east of Greenland before stalling and weakening to a gale in the northeast Atlantic on the 16th.
Northwest Atlantic Storm of November 3-5: Low pressure moving off the Labrador coast absorbed another low riding north up the front during the twenty-four hour period ending at 0600 UTC November 4 (Figure 8). The primary low deepened 36 hPa in the twenty-four hour period ending at 0000 UTC on the 4th, while the secondary low intensified by an even more impressive 40 hPa in the twenty-four hour period ending at 1800 UTC on the 3rd, before merging with the main Labrador Sea low. The second part of Figure 8 shows the storm at maximum intensity (943 hPa or 27.85 in), making it the most intense storm of the period not only in the North Atlantic, but in both oceans. Platform (VEP717) (46.7N 48.7W) reported south winds of 75 kts ahead of the front at 0600 UTC on the 3rd. Behind the frontal system, the ship Atlantic Cartier (SCKB) (49N 44W) encountered west winds of 60 kts, but south of the area of strongest winds as shown in Figure 9 with a valid time close to that of the second part of Figure 8. A few 80 kts wind barbs appear in the northwest flow over the Labrador Sea, an area of sparse ship data. The storm subsequently weakened to a gale-force low while passing southeast of Greenland late on the 5th, before dissipating south of Iceland late on the 7th.
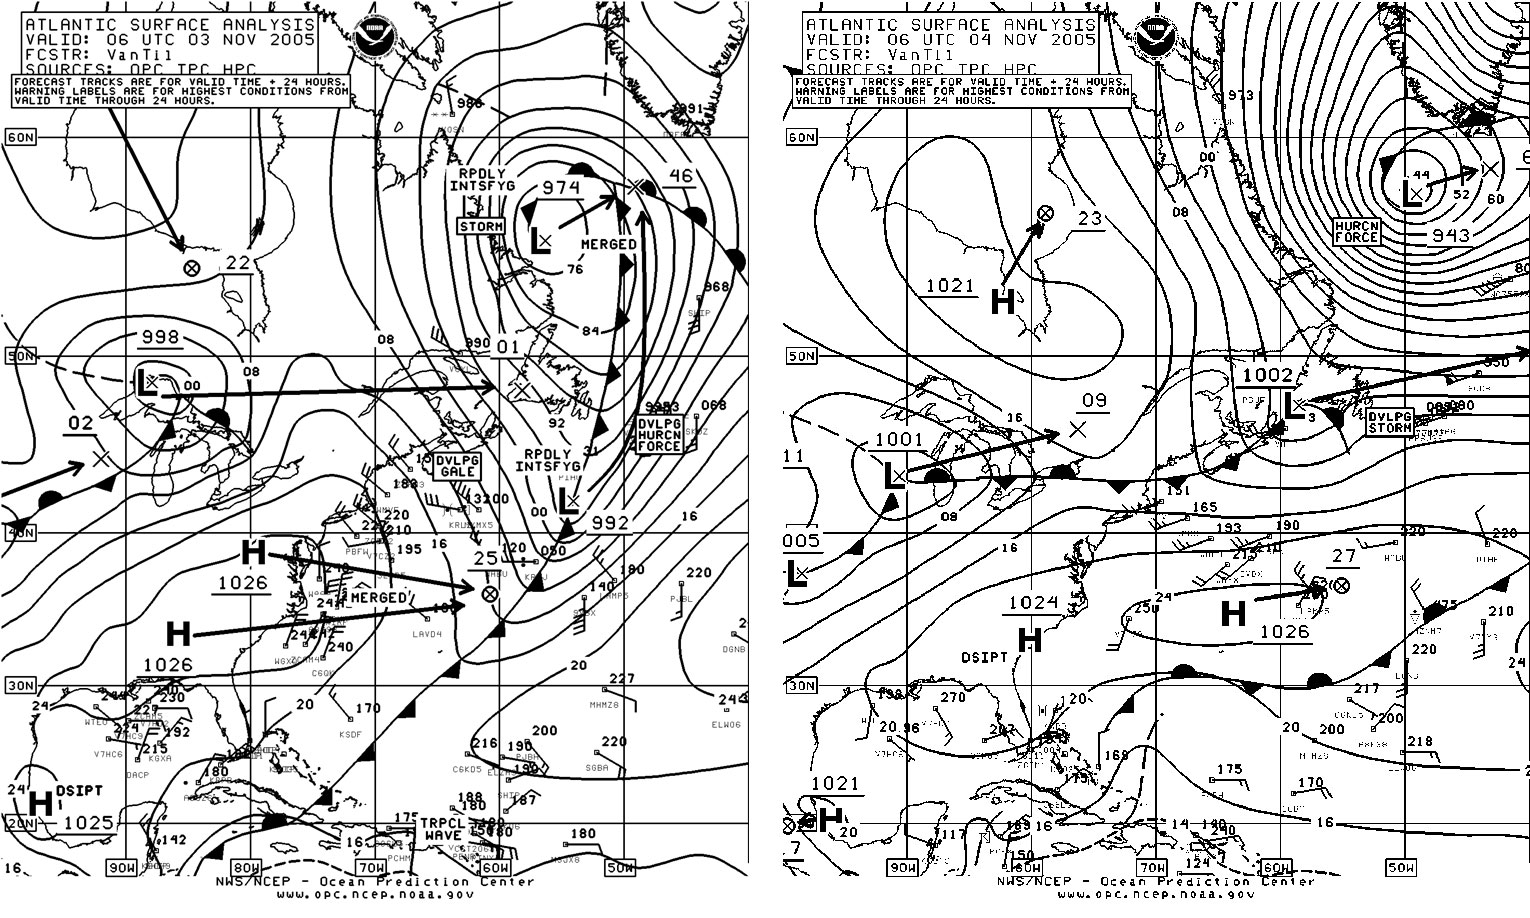
Figure 8. OPC North Atlantic Surface Analysis charts (Part 2) valid 0600 UTC November 3 and 4, 2005.
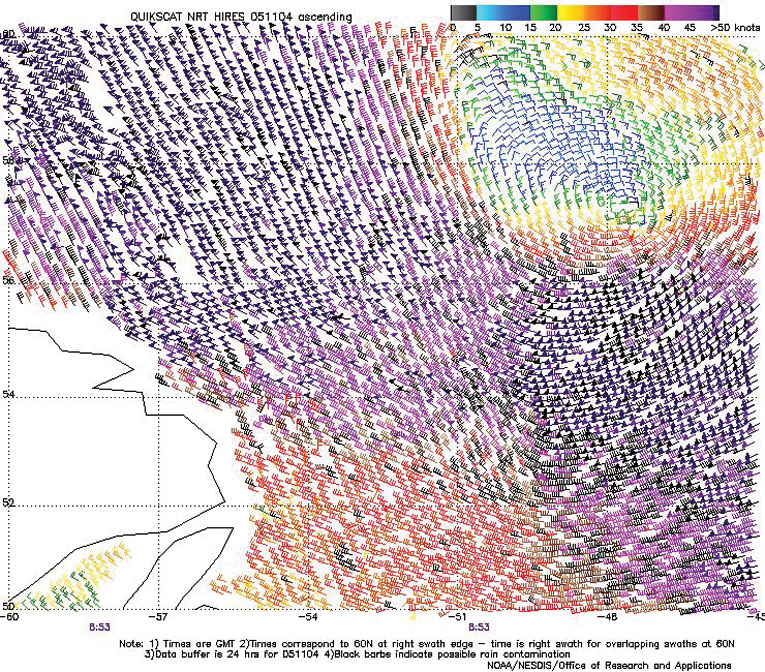
Figure 9. High-resolution QuikScat scatterometer image of satellite-sensed winds displaying the stronger winds around the south and west sides of the storm in the second part of Figure 8, valid at 0853 UTC November 4, 2005. The valid time of the pass is about three hours later than the valid time of the second part of Figure 8.
Image is courtesy of NOAA/NESDIS/Office of Research and Applications.
North Atlantic Storms, November 8-12: The primary system, like the preceding storm described above, developed in the Labrador Sea on November 8 but was not nearly as intense. This low deepened to 964 hPa while passing east of Greenland near 61N 31W early on the 9th. The first part of Figure 10 depicts the Greenland system after completing a loop, briefly developing hurricane-force winds before heading southeast, while a secondary low develops west of Great Britain. The second part of Figure 10 shows the secondary low becoming the main system with hurricane-force winds. Figure 11 is a high-resolution QuikScat image revealing hurricane-force west winds on the back side of the storm, including one 80 kts wind barb. The ship (MHN06) (49N 15W) reported west winds of 50 kts at 0600 UTC on the 11th, and Buoy 62105 (55.4N 12.5W) had west winds of 50 kts and 9.0 m seas (30 ft) four hours later. The storm subsequently weakened and continued on a northeast track into Norway late on the 12th.
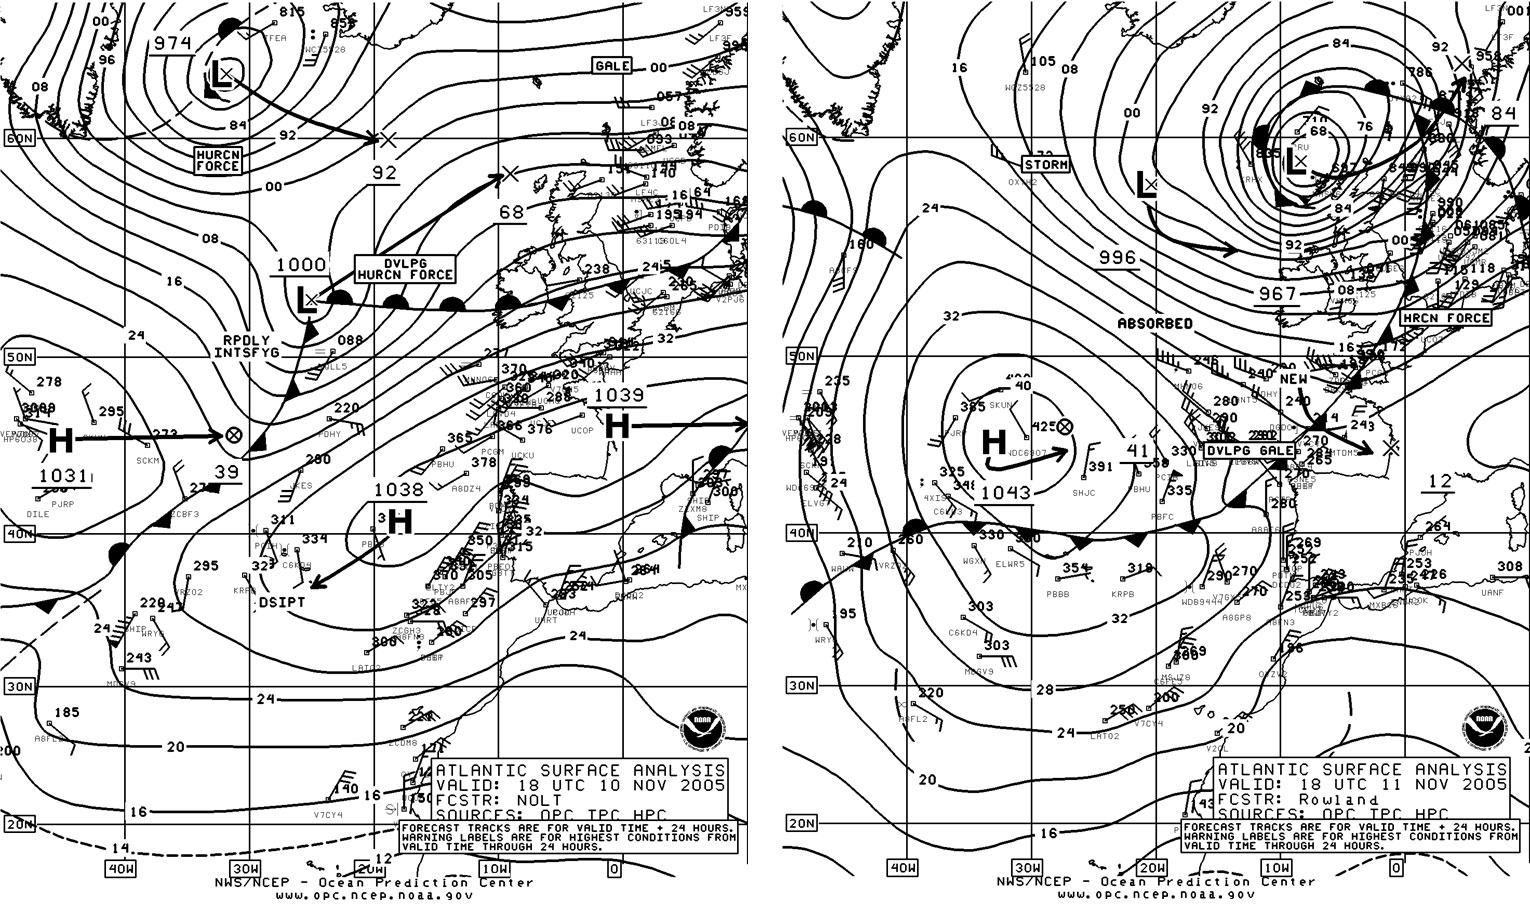
Figure 10. (above) OPC North Atlantic Surface Analysis charts (Part 1) valid 1800 UTC November 10 and 11, 2005.
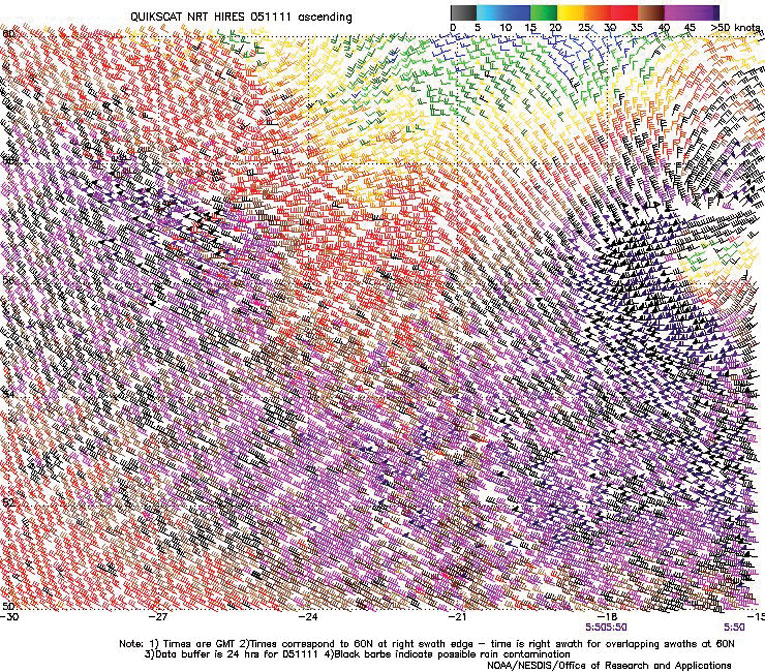
Figure 11. (left) High-resolution QuikScat scatterometer image of satellite-sensed winds around the west semicircle of the storm shown in Figure 10. The valid time of the pass is 0550 UTC November 11, 2005, or about twelve hours prior to the valid time of the second analysis in Figure 10.
Image is courtesy of NOAA/NESDIS/Office of Research and Applications.
North Atlantic Storms, December 5-9: With increased blocking in the eastern Atlantic from late November into early December, the three major storms described in the remainder of this article followed more northward tracks toward the Greenland area after initiating near or off the U.S. East Coast. The first low originated south of Nova Scotia near 41N late on December 4 and deepened rapidly over a thirty-six hour period, leading to the 952 hPa hurricane-force storm in the first part of Figure 12. The central pressure dropped an impressive 38 hPa in the twenty-four hour period leading up to 1200 UTC December 6. The system that followed, shown developing from an open frontal wave of low pressure off the U.S. mid-Atlantic coast, appears with a 952 hPa central pressure in the second part of Figure 12, also down 38 hPa in the preceding twenty-four hours. The central pressure bottomed out at 947 hPa six hours later, making the storm the second deepest of the period in the North Atlantic. With the passage of the first low, winds at the platform VEP717 (46.7N 48.7W) reached 60 kts from the southwest at 0000 UTC December 6, accompanied by seas of 7.5 m (24 ft). The second low produced winds as high as 55 kts from the west at the same platform. The QuikScat data in Figure 13 reveals hurricane-force winds as high as 70 kts on the south and southeast sides of the well-defined storm center near 58N 37W, in an area lacking in ship reports. High-resolution QuikScat winds from the first storm near 0000 UTC December 6 revealed winds of similar strength south of the center. The second storm absorbed the first east of Greenland on the 8th, and then weakened to a gale while passing between Greenland and Iceland early on the 9th. The third storm in the series, with different impact, is described below.
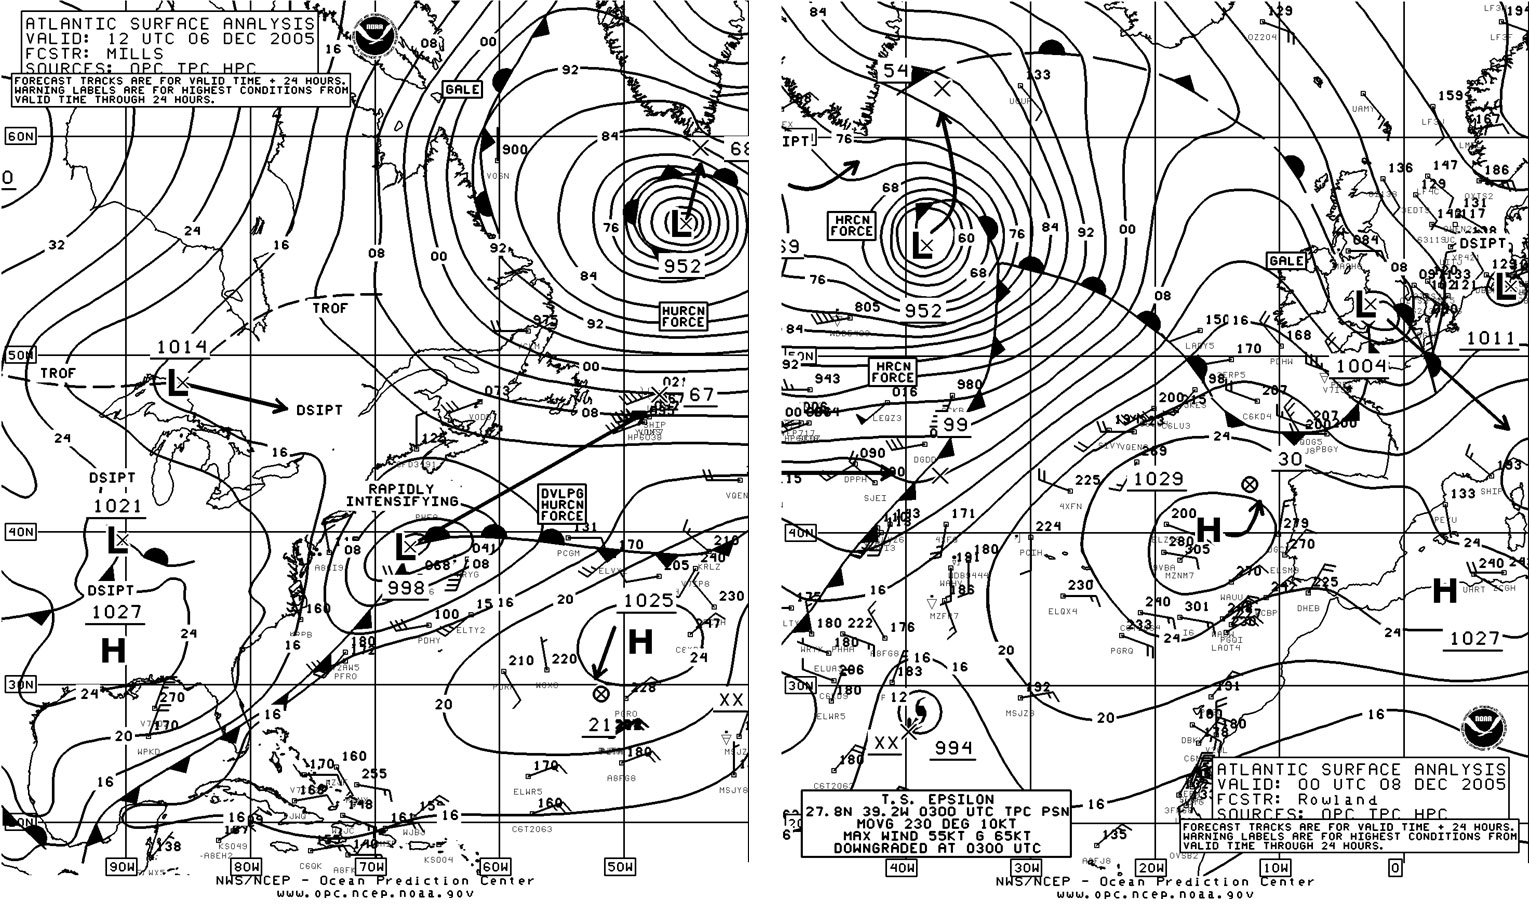
Figure 12. OPC North Atlantic Surface Analysis charts valid 1200 UTC December 6 (Part 2) and 0000 UTC December 8, 2005.
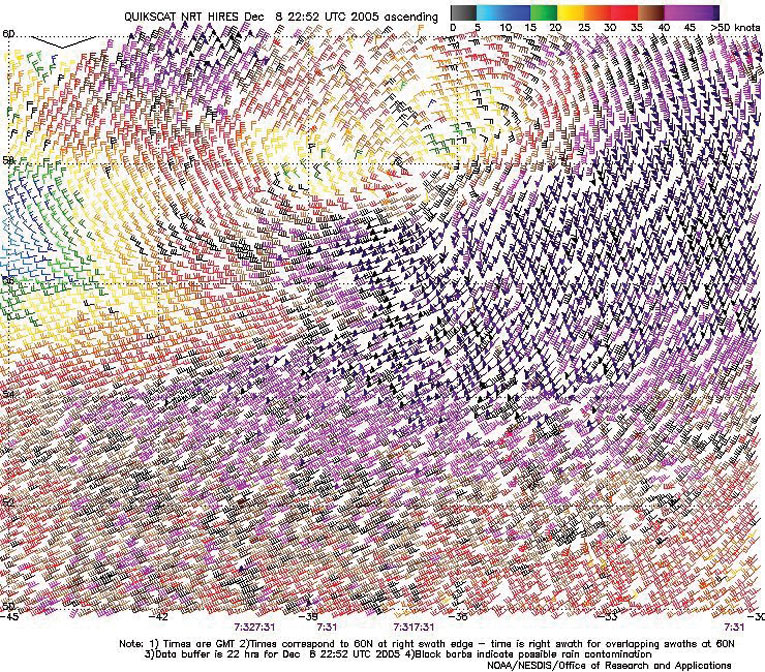
Figure 13. (left) High-resolution QuikScat scatterometer image of satellite-sensed winds around the storm shown in the second part of Figure 12. The southern tip of Greenland is near the upper-left corner of the figure. The valid time of the pass is 0731 UTC December 8, 2005, or about seven and one-half hours later than the valid time of the second part of Figure 12.
Image is courtesy of NOAA/NESDIS/Office of Research and Applications.
Coastal Storm, December 9-10: Unlike the two predecessors, the next low underwent very rapid initial intensification in the first twelve hours after leaving the U.S. mid-Atlantic coast, as shown in Figure 14. The central pressure dropped 26 hPa in only twelve hours and winds quickly increased to hurricane force from the eastern New England waters to south of Nova Scotia late on the 9th. High-resolution scatterometer winds were available for 2234 UTC on the 9th, revealing west winds 50 to 65 kts and as high as 70 kts from the southern Gulf of Maine to east of Cape Cod. These winds are reflected in the gust speeds reported at some of the buoys and C/MAN stations in the area as shown in Table 3. The cyclone attained a maximum intensity of 978 hPa while passing 180 nmi south of Newfoundland early on the 10th, and then turned more north and began to weaken, passing northwest of Iceland as a gale on December 12.
| OBSERVATION | POSITION | DATE/TIME(UTC) | WIND(kt) | SEAS(m/ft) |
|---|---|---|---|---|
| Maersk Skagen (ELVX2) | 40N 72W | 09/1800 | W 44 | |
| Nordon (PBHU) | 46N 58W | 10/1200 | N 55 | |
| Buoy 44004 | 38.5N 70.5W | 09/1600 | S 37 G47 | 3.0/10 |
| Buoy 44017 | 40.7N 72.0W | 09/1800 09/1900 |
W 41 G49 Peak gust 58 |
2.5/8 maximum 4.0/13 |
| Buoy 44008 | 40.5N 69.4W | 09/2100 10/0100 |
W 41 G52 | 4.5/15 maximum 6.5/21 |
| Buoy 44029 | 42.5N 70.6W | 09/2000 09/2100 |
NW 47 G72 | 2.5/8 maximum 3.0/10 |
| Buoy 44018 | 41.3N 69.3W | 09/2100 09/2300 |
W 43 G54 Peak gust 58 |
4.0/13 maximum 5.5/18 |
| Buoy 44005 | 43.2N 69.2W | 09/2200 10/0100 10/0200 |
N 33 G41 Peak gust 45 |
2.5/8 maximum 3.5/11 |
| Buoy 44137 | 42.3N 62.0W | 10/0600 10/0700 10/0900 |
W 52 G64 Peak gust 66 |
7.0/23 maximum 9.5/31 |
| Buzzards Bay (BUZM3) | 41.4N 70.9W | 09/1900 | NW 59 G 69 | |
| Table 3. Some ship, buoy and coastal C/MAN observations taken during passage of the coastal storm of December 9-10. | ||||
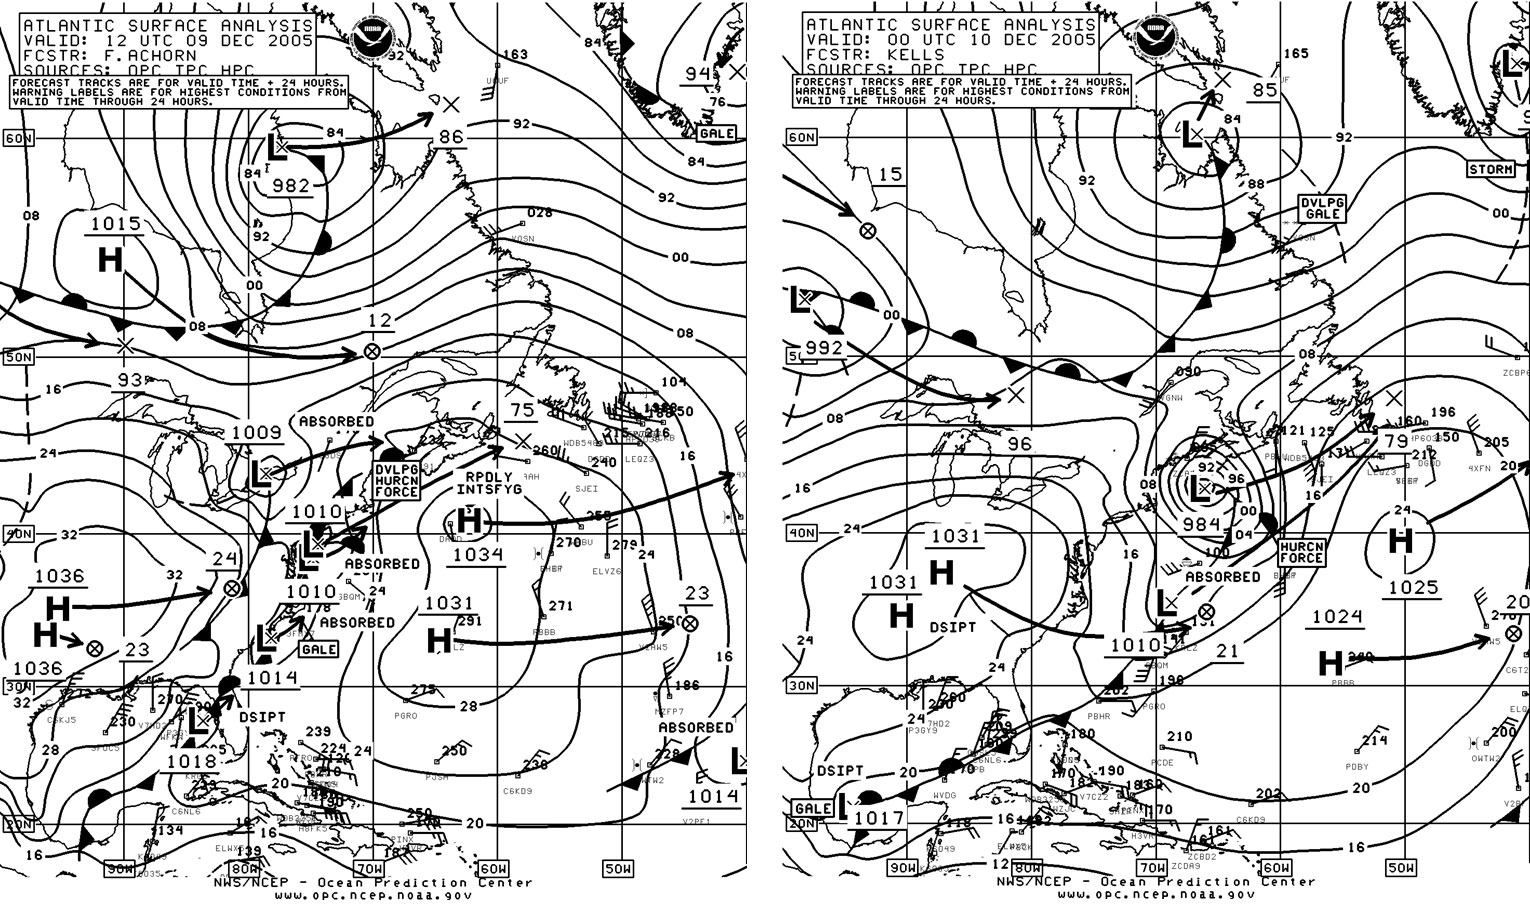
Figure 14. (below) OPC North Atlantic Surface Analysis charts (Part 2) valid 1200 UTC December 9 and 0000 UTC December 10, 2005.
References
- From Tropical Prediction Center website, http://www.nhc.noaa.gov/aboutsshs.shtml
- From Tropical Prediction Center website, http://www.nhc.noaa.gov/archive/2005.
- Sienkiewicz, J. and Chesneau, L., Mariner's Guide to the 500-Mb Chart (Mariners Weather Log, Winter 1995).