Marine Weather Review - North Atlantic Area
January to April 2016
George P. Bancroft
Ocean Forecast Branch, Ocean Prediction Center, College Park,
MD
NOAA National Center for Environmental Prediction
Introduction
The weather pattern over the North Pacific was very active especially during January and February, in stark contrast to a year ago when there was only one hurricane force low during February and March 2015. Developing cyclones generally tracked east and northeast across the central waters after originating near or south of Japan, before weakening near or in the Gulf of Alaska. Some cyclones moved into the Bering Sea, with one strong system moving into the Bering Sea in January. There was at times a secondary storm track out of the south central waters toward the U.S. Pacific Northwest or British Columbia. There were nine hurricane force lows each in January and February, the most active months, followed by six in March and three in April. During the heavy weather season ending in April Ocean Prediction Center (OPC) detected a record number of hurricane force lows, fifty. Four of the January events developed central pressures below 950 hPa. There were no tropical cyclones appearing on OPC oceanic analysis charts during the four month period.
Significant Events of the Period
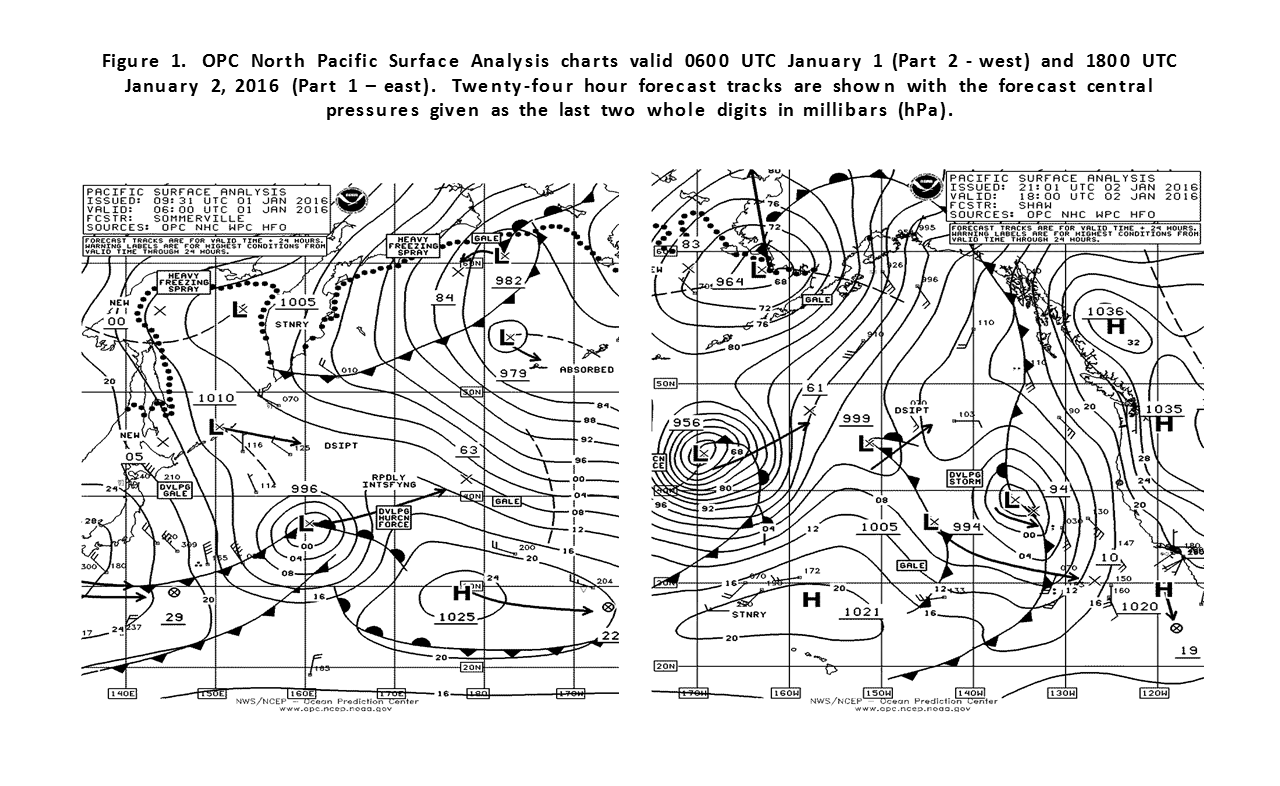
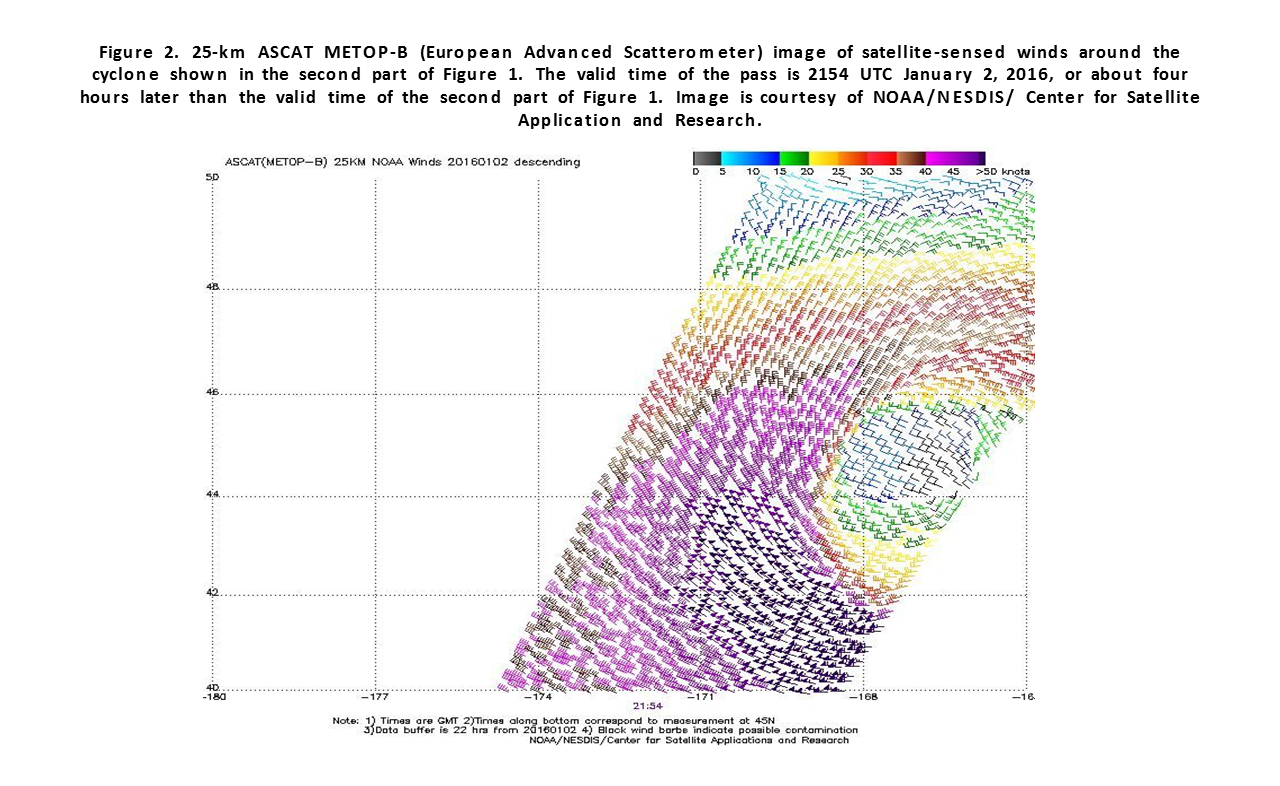
North Pacific Storm, January 1-5: This cyclone actually formed near Japan late in December 2015 and moved into OPC's high seas area past 160E as a rapidly intensifying low as January began (Figure 1). The second part of Figure 1 shows the cyclone at maximum intensity. A scatterometer image from near that time (Figure 2) shows a partial view of the northwest semicircle of the cyclone with wind retrievals of 50 to as high as 65 kts, from an area where there is usually sparse ship reports. The cyclone then moved northeast and then east with a weakening trend and dissipated on the 6th.
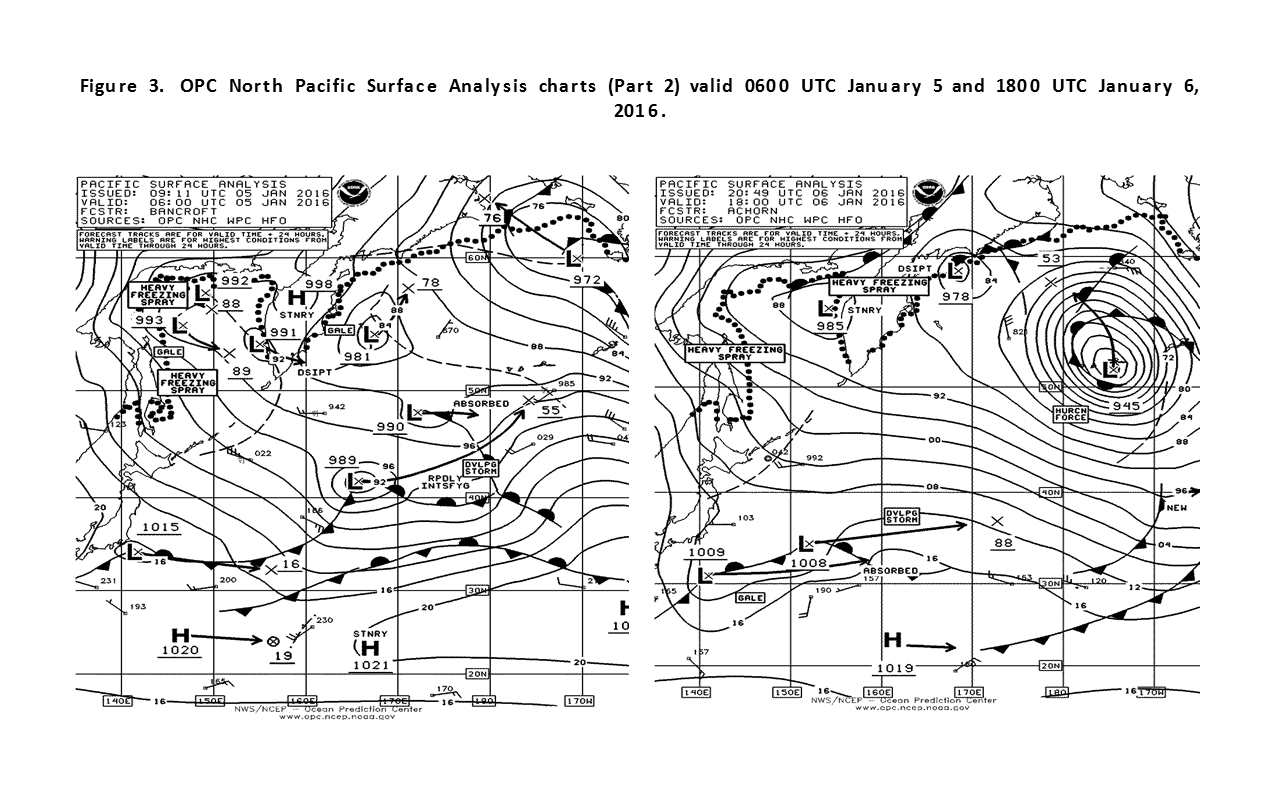
North Pacific / Bering Sea Storm, January 5-7: One of few strong cyclones to move into the Bering Sea during this period, this storm developed a lowest central pressure of 945 hPa near the central Aleutian Islands 1800 UTC on January 6 (Figure 3) after originating near Japan early on the 4th. The central pressure fell 40 hPa in the 24 hour period ending at 0600 UTC on the 6th. An ASCAT scatterometer pass from 2209 UTC on the 6th showed 50 kts wind retrievals in the southeast semicircle at the edge of a pass. The system then weakened and moved into the northwest Bering Sea, where it dissipated on the 9th.
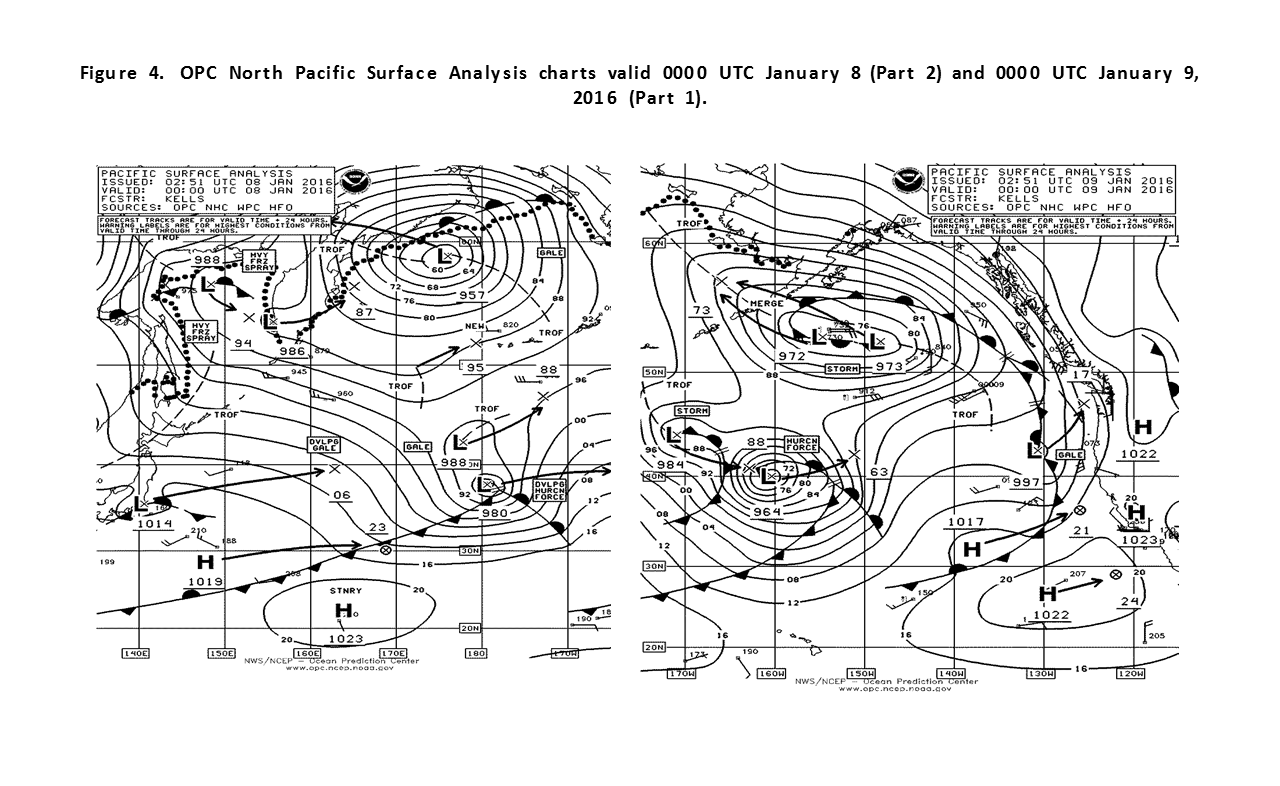
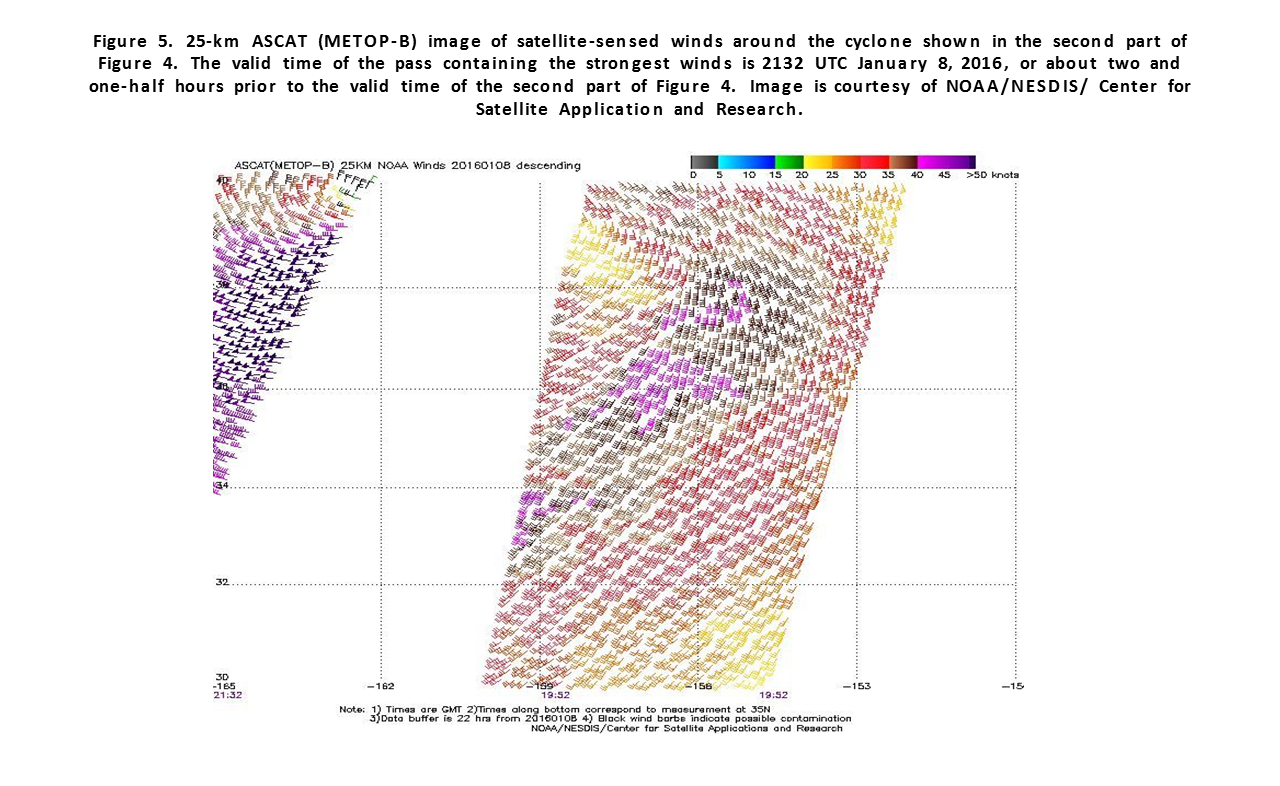
North Pacific Storm, January 6-9: This cyclone followed a track more typical of other significant storms of the period. Originating southeast of Japan late on the 5th, this system moved across the south central waters well south of the Aleutian Islands from the 6th through the 9th before turning north toward the Gulf of Alaska on the 11th. It developed hurricane force winds with central pressures as low as 961 hPa while moving along 40N between 170W and 150W on the 8th and early on the 9th (Figure 4). Figure 5 is an ASCAT-B pass from near the time of maximum intensity with only partial coverage of the south side of the cyclone where the strongest winds are often found, revealing winds to 60 kts near the pass edge. The cyclone later dissipated in the Gulf of Alaska on the 12th.
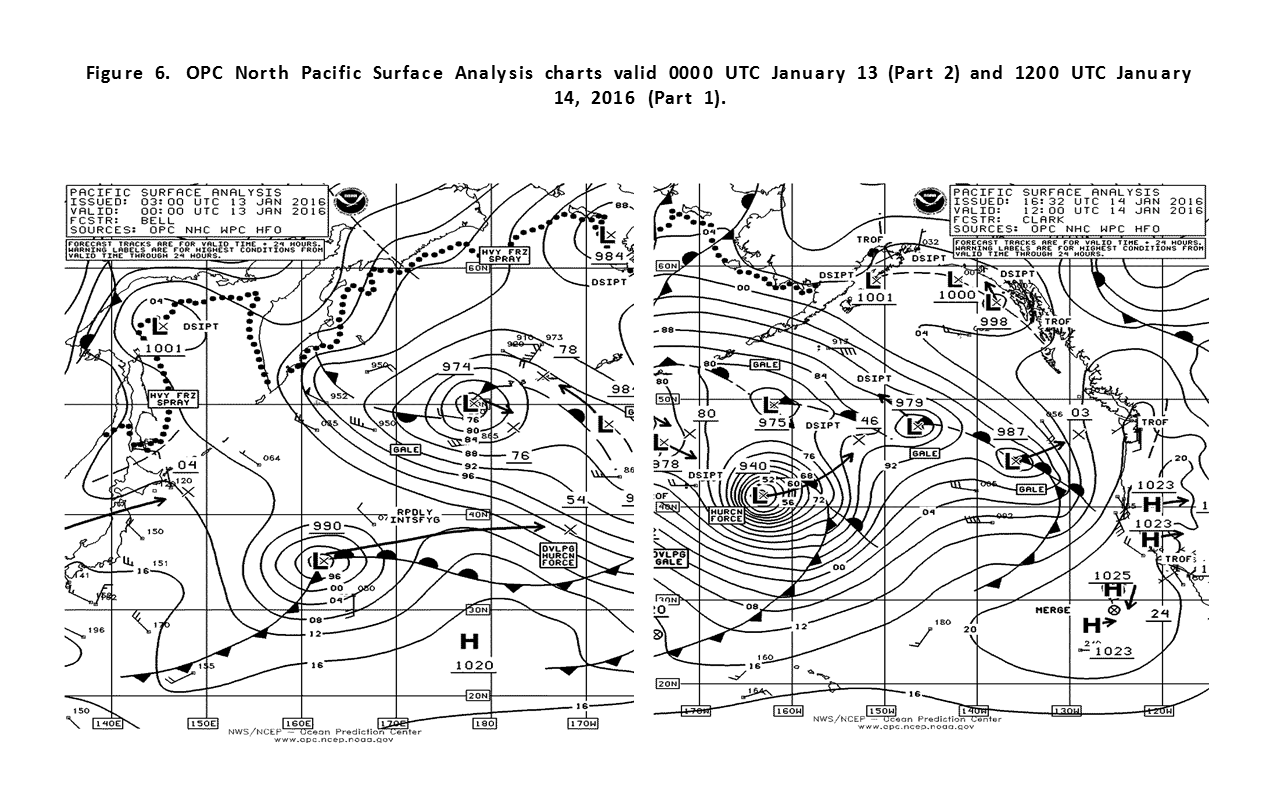
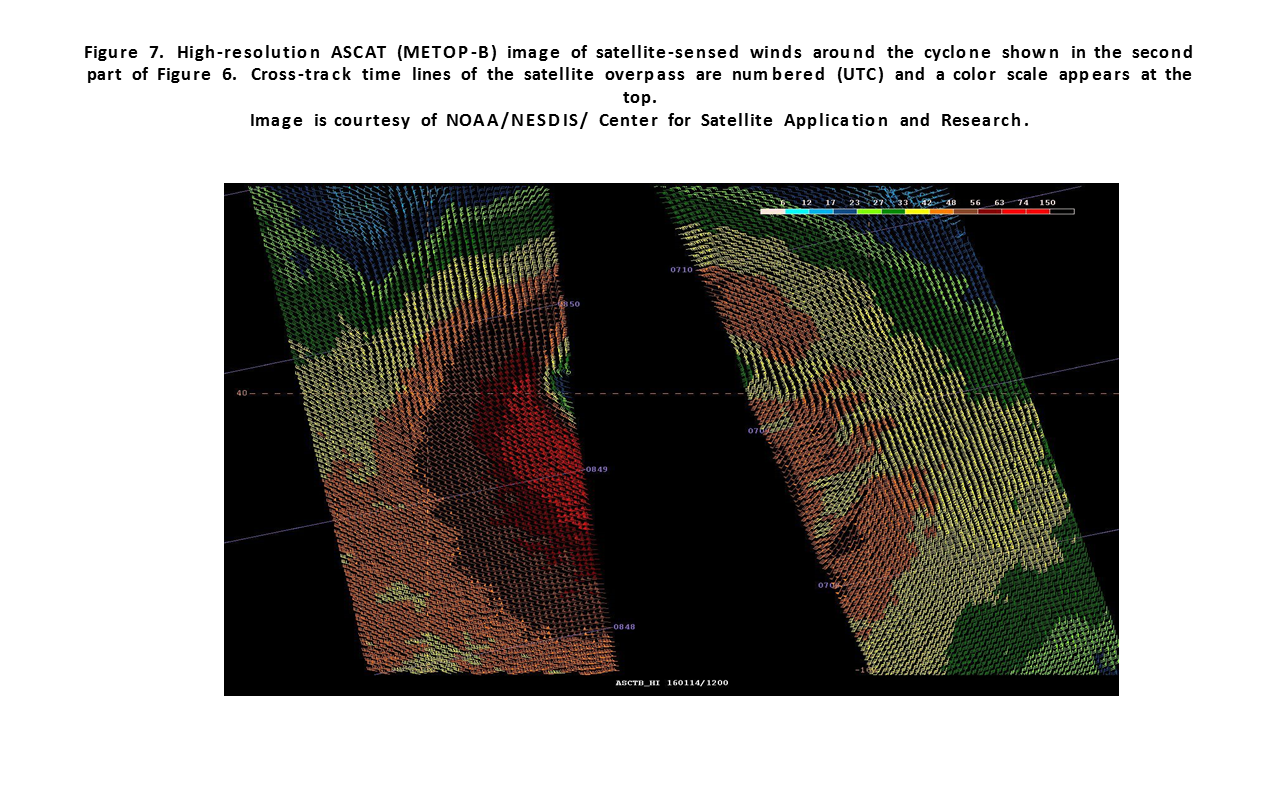
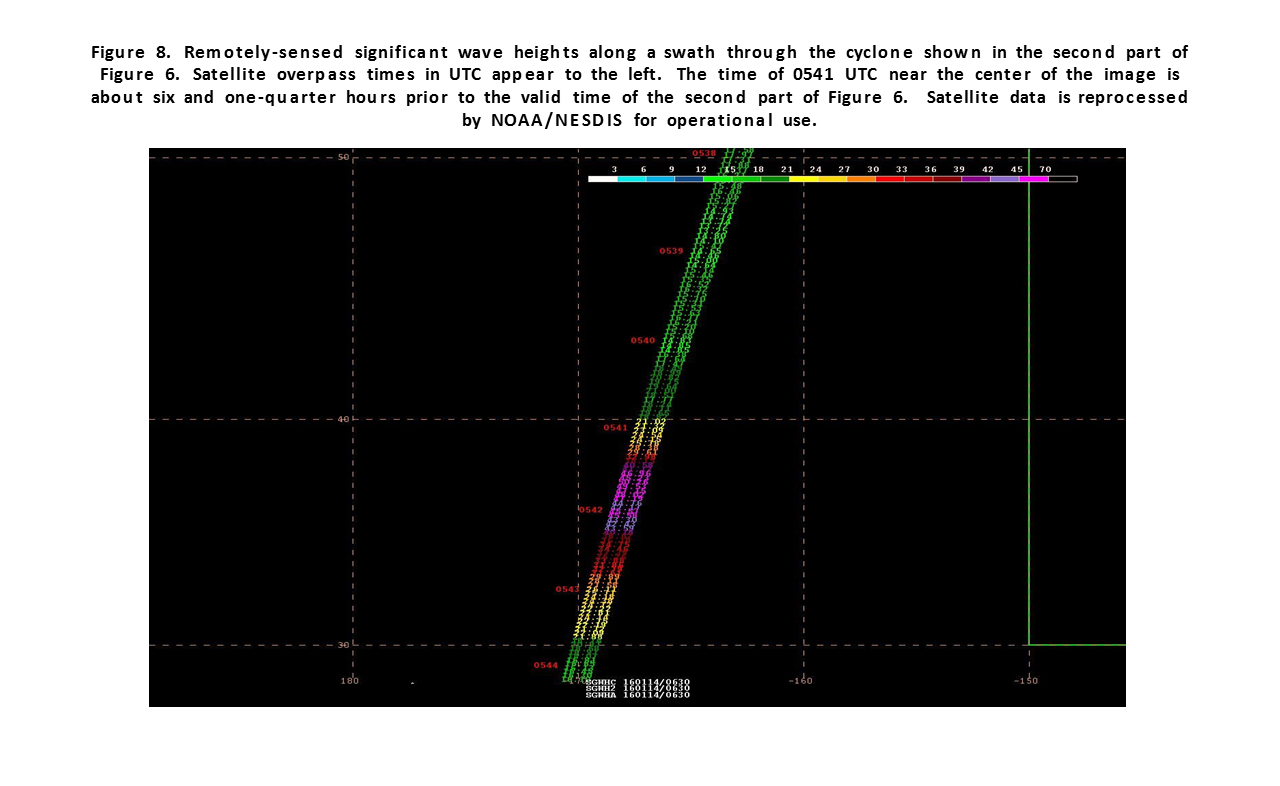
North Pacific Storm, January 12-16: The development of the most intense cyclone of the period (lowest pressure 940 hPa) over a 36 hour period is depicted in Figure 6. It originated well south of western Japan early on the 11th. The central pressure fell 38 hPa in the 24 hour period ending at 0600 UTC on the 14th. The ASCAT-B image in Figure 7 indicated that this cyclone likely had winds of at least 80 kts. The image does miss the south side of the cyclone and wind retrievals to 50 kts or more surround the cyclone except on the east side. A satellite altimeter pass in Figure 8 which cuts through the south side of the cyclone revealed wave heights as high as 50 ft (15.2 m). The ship HATSU EXCEL (VSXV3) near 54N 162W encountered northeast winds of 52 kts at 0000 UTC on the 16th, and seas of 10.1 m (33 ft) six hours prior. Buoy 46075 (53.9N 160.8W) reported northeast winds of 37 kts with gusts to 49 kts and 7.5 m seas (25 ft) at 2100 UTC on the 15th, and three hours later reported 8.5 m seas (28 ft). The cyclone then moved northeast and gradually weakened, moving into the southern Gulf of Alaska as a gale force low by the 18th.
Eastern North Pacific Storm, January 15-17: This low formed on a front over the south central waters, well south of the western Aleutian Islands late on the 14th and developed hurricane force winds before turning north just west of the offshore waters of the U.S. Pacific Northwest on the 16th, with central pressures as low as 962 hPa. There were some reports of winds gusting to near hurricane force and seas above 30 ft (9 m) in that area. Buoy 46036 (48.4N 133.9W) reported southwest winds of 45 kts with gusts to 60 kts at 1200 UTC on the 17th, and seas 10.0 m (33 ft) one hour later. Buoy 46208 (52.5N 132.7W) reported southeast winds of 41 kts with gusts to 51 kts at 1600 UTC on the 17th, a peak gust of 56 kts five hours prior, and seas of 10.0 m (33 ft) at 2100 UTC that day. The cyclone then turned northwest into the Gulf of Alaska late on the 17th, and dissipated on the 18th.
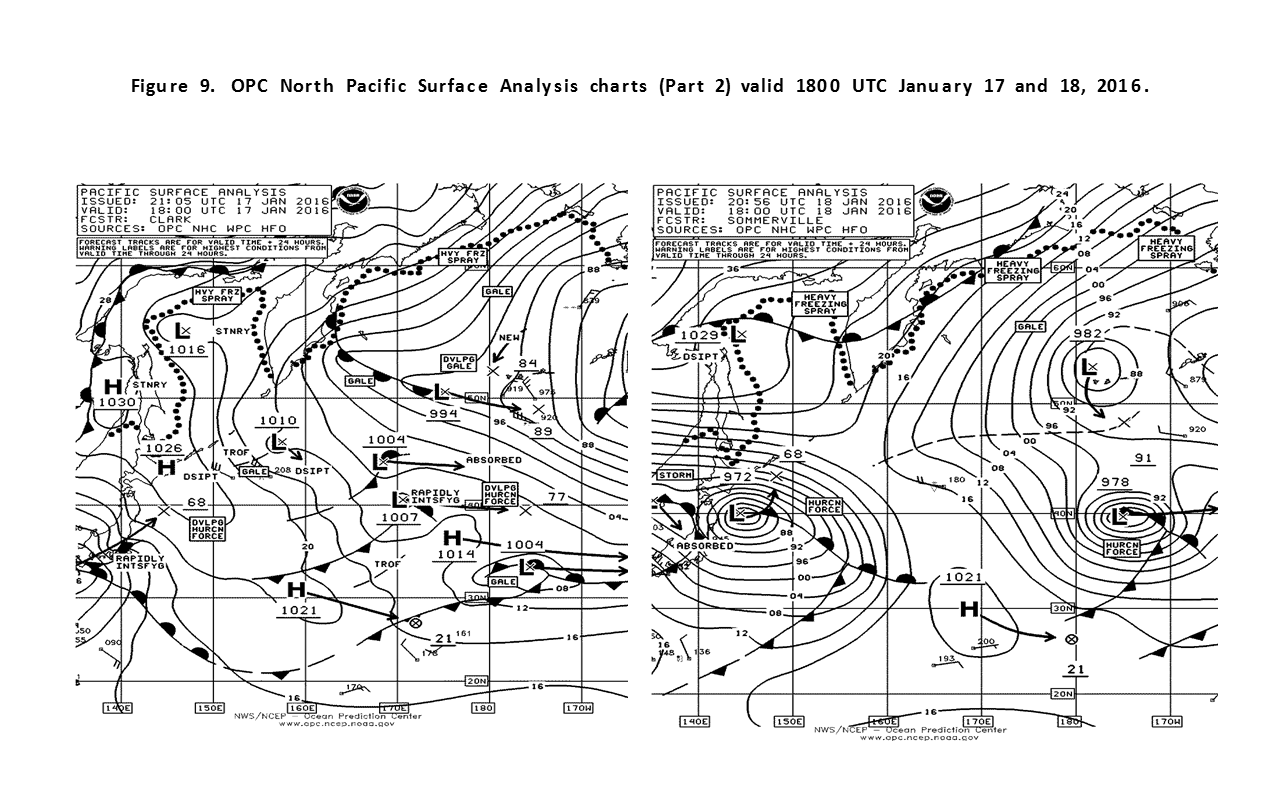
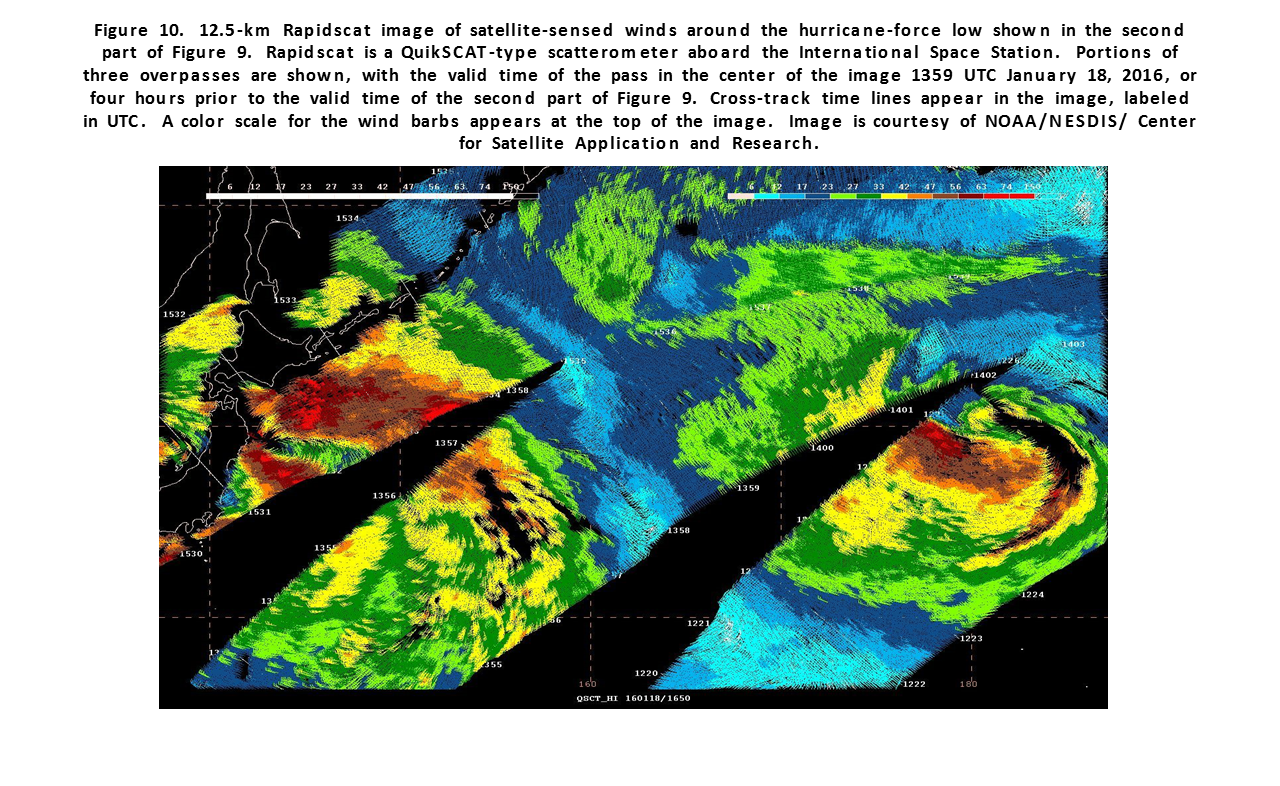
Western Pacific Storm, January 17-19: Figure 9 shows two hurricane force cyclones that formed at about the same time in mid- January 2016. The first to develop was the western system originating south of western Japan early on January 17 and developing hurricane force winds just east of Japan the next day. The Rapidscat image in Figure 10 reveals winds to hurricane force north of the center along the occluded front and also a smaller area in westerly flow south of the center. The ship BATFR05 (33N 138E) reported west winds of 50 kts at 1300 UTC on the 18th, and 8.5 m seas (28 ft) seven hours prior near the same location. A vessel with a Masked call sign encountered east winds of 55 kts and 8.2 m seas (27 ft) near 37N 143E at 0600 UTC on the 18th. The cyclone drifted northeast and developed a lowest central pressure of 964 hPa at 0600 UTC on the 19th, before stalling near the southern Kurile Islands late on the 19th, when its winds diminished to gale force.
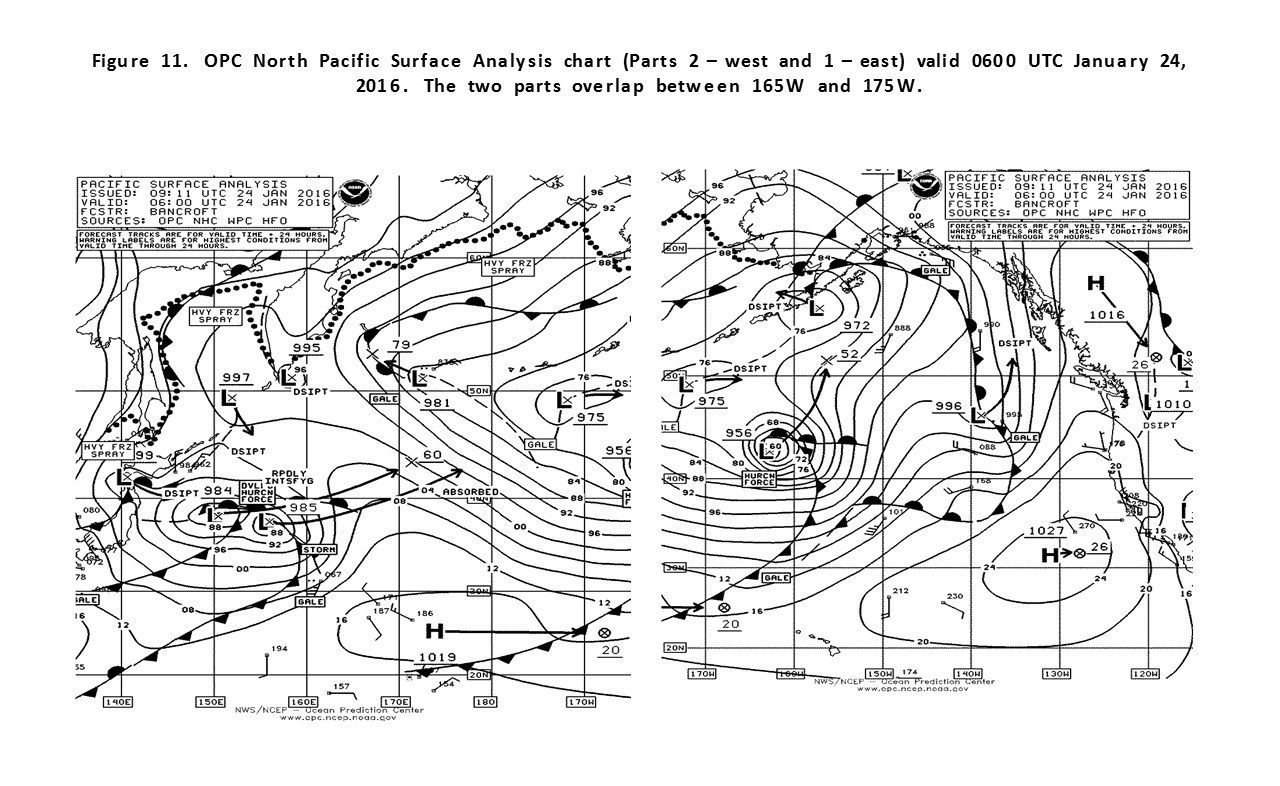
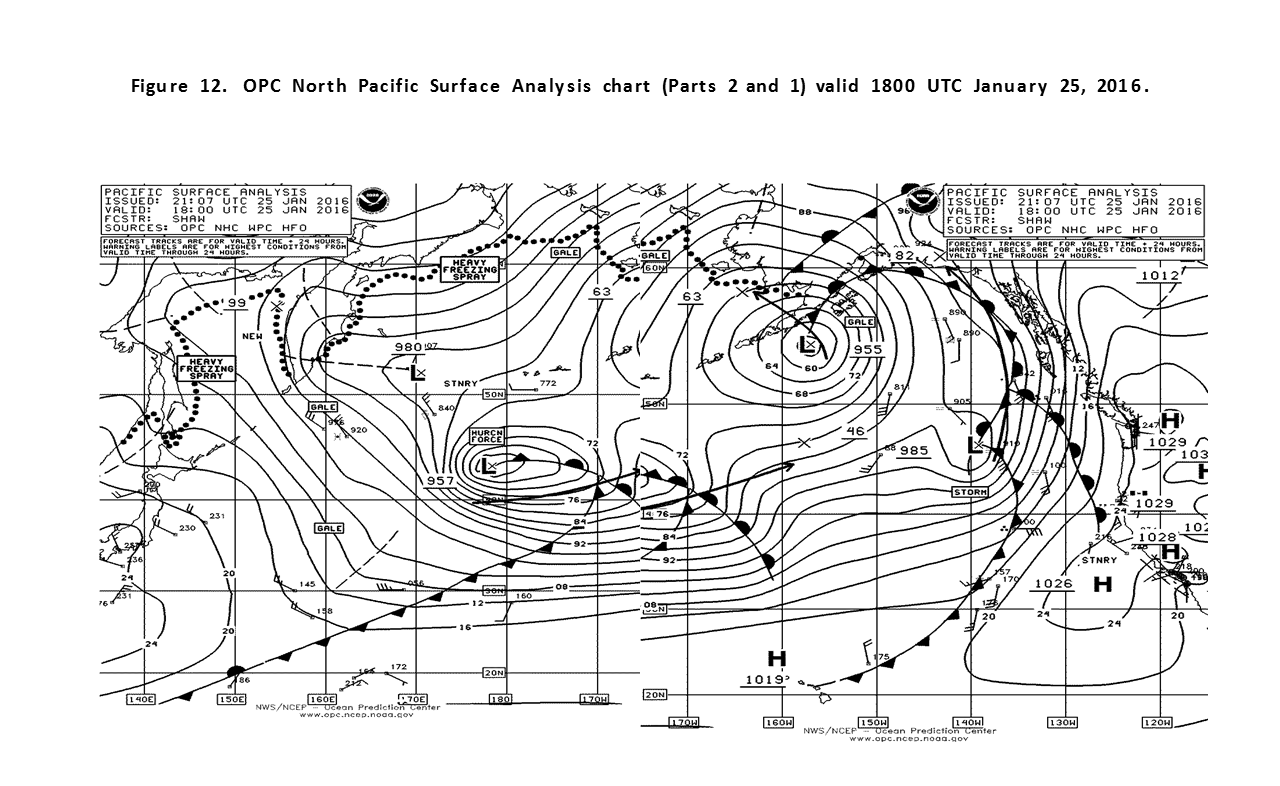
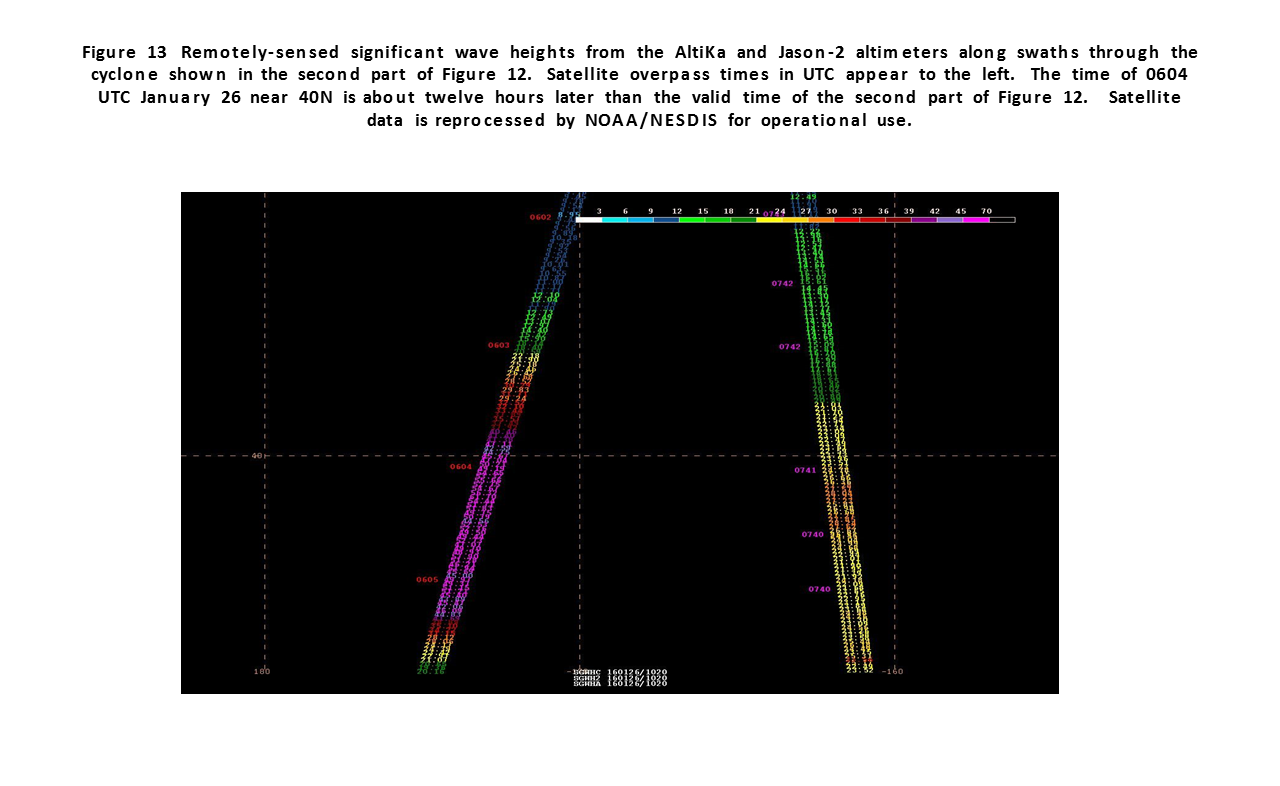
North Pacific Storms, January 22-28: Figure 11 and Figure 12 display the development of another pair of hurricane force lows at nearly the same time in late January. The first of these is shown in Figure 11 in the eastern waters after a period of rapid intensification, with the pressure falling 36 hPa in the preceding 24 hour period. It originated east of Japan near 160E early on the 22nd and developed a lowest central pressure of 949 hPa while turning north into the Gulf of Alaska after its winds had peaked. Figure 12 shows the system as a weakening gale in the western Gulf of Alaska. The stronger of the two cyclones developed from the merging of two cyclones east of Japan (Figure 11 and Figure 12 ) and followed a more southern track and developed winds estimated at 80 kts, almost as strong as January 12-16 event. An AltiKa altimeter pass through the southwest side of the storm (Figure 13) revealed wave heights as high as 62 ft (18.9 m). The lowest central pressure of 945 hPa late on the 26th came as winds were weakening. The cyclone weakened in the Gulf of Alaska on the 27th and 28th.
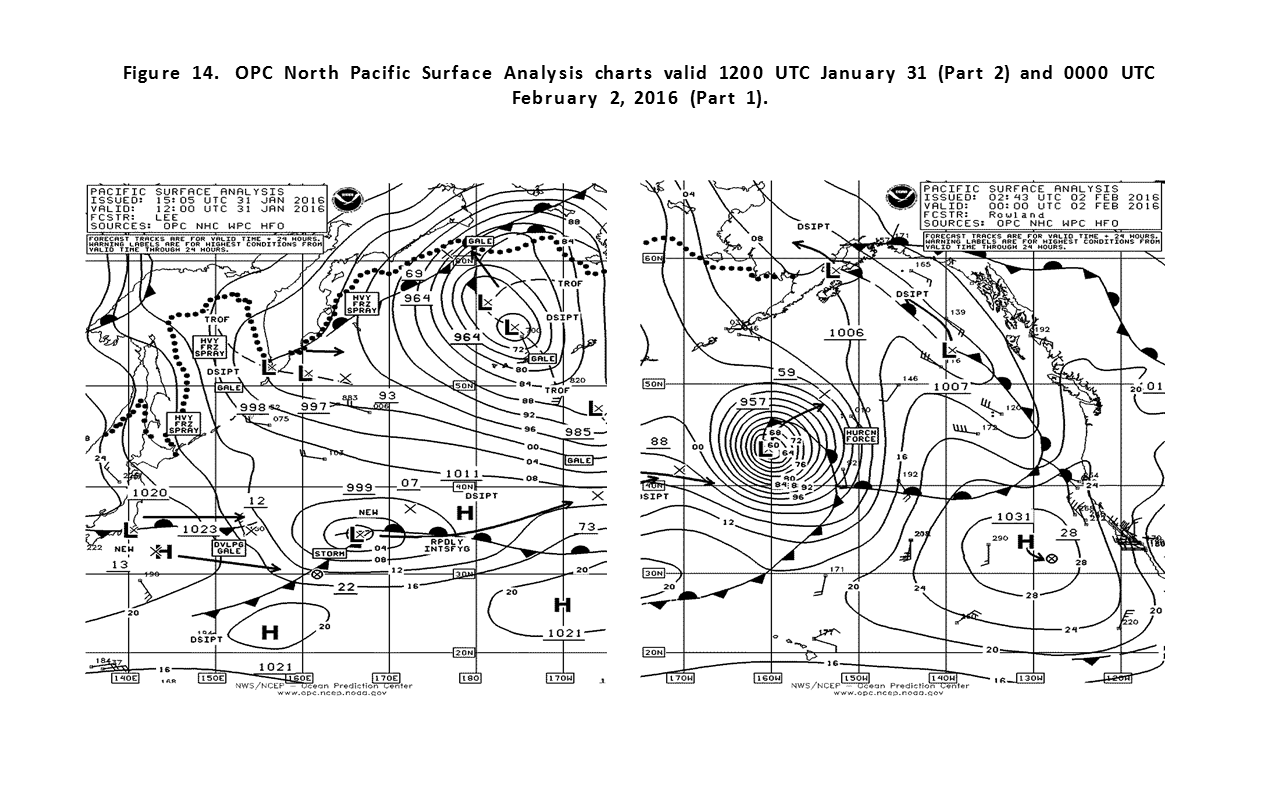
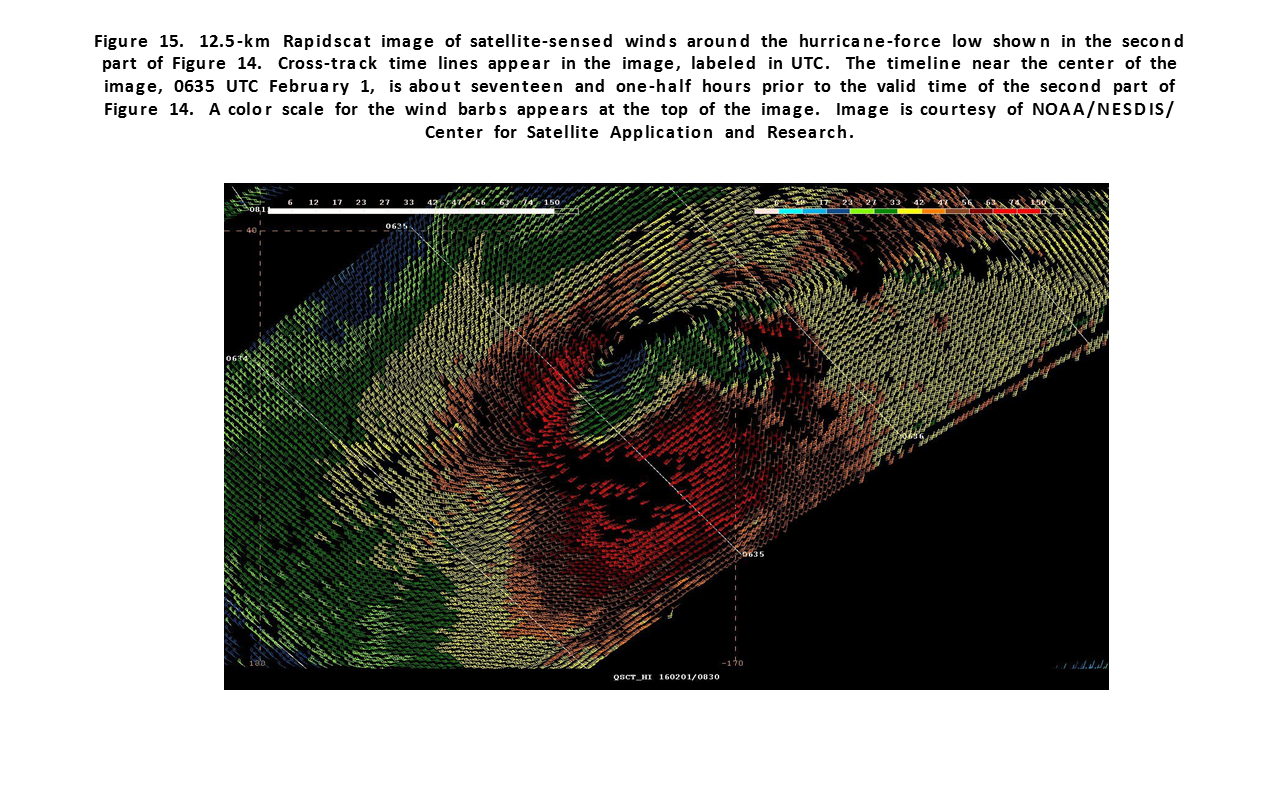
North Pacific Storm, January 30-February 2: Low pressure originating southeast of Japan early on January 30th moved northeast and rapidly intensified to become yet another powerful Pacific cyclone (Figure 14). In initial development the central pressure dropped 29 hPa in the 24 hour period ending at 0600 UTC February 1st, impressive for that low latitude. The Rapidscat image in Figure 15 shows numerous wind retrievals exceeding 65 kts south of the cyclone center and winds as high as 85 kts. The image was available when the cyclone was still intensifying. As evident from prior events, the highest winds in a cyclone may occur before the lowest central pressure is reached. The cyclone is shown at maximum (957 hPa) in the right panel of Figure 14. The MAERSK STOCKHOLM (41N 152W) reported south winds of 50 kts at that time. OPC analysis showed the system to be below hurricane force six hours later. The system then weakened and turned northwest into the southeast Bering Sea, where it dissipated.
Eastern North Pacific Storm, February 4-5: This event was short lived, originating as a new low 43N 142W early on the 4th and briefly developing hurricane force winds of 65 kts mainly as southerly winds along the Canadian coast north of Vancouver island as seen in Rapidscat imagery near 0500 UTC on the 6th. The HORIZON ANCHORAGE (KGTX) near 50N 129W reported north winds of 55 kts at 0000 UTC on the 5th. The center moved inland on the 5th.
Eastern North Pacific Storm, February 5-7: This was the first of two powerful cyclones that developed in close succession early in February. Originating in the south central waters early on the 4th, it developed a lowest central pressure of 959 hPa near 46N 154W at 1200 UTC on the 6th. An ASCAT image at 0640 UTC on the 6th returned an area of southwest winds to 60 kts on the southwest side at a pass edge. The system then weakened and moved into the Gulf of Alaska by the 8th.
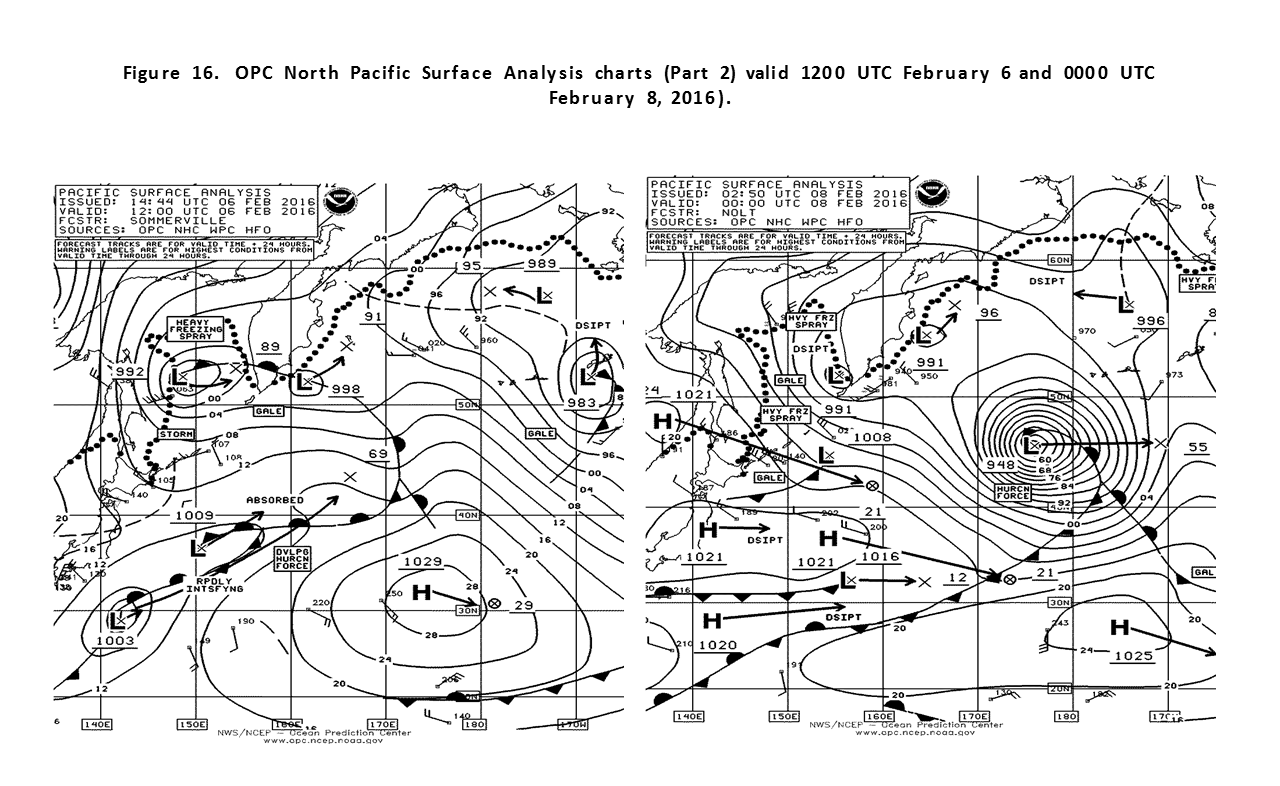
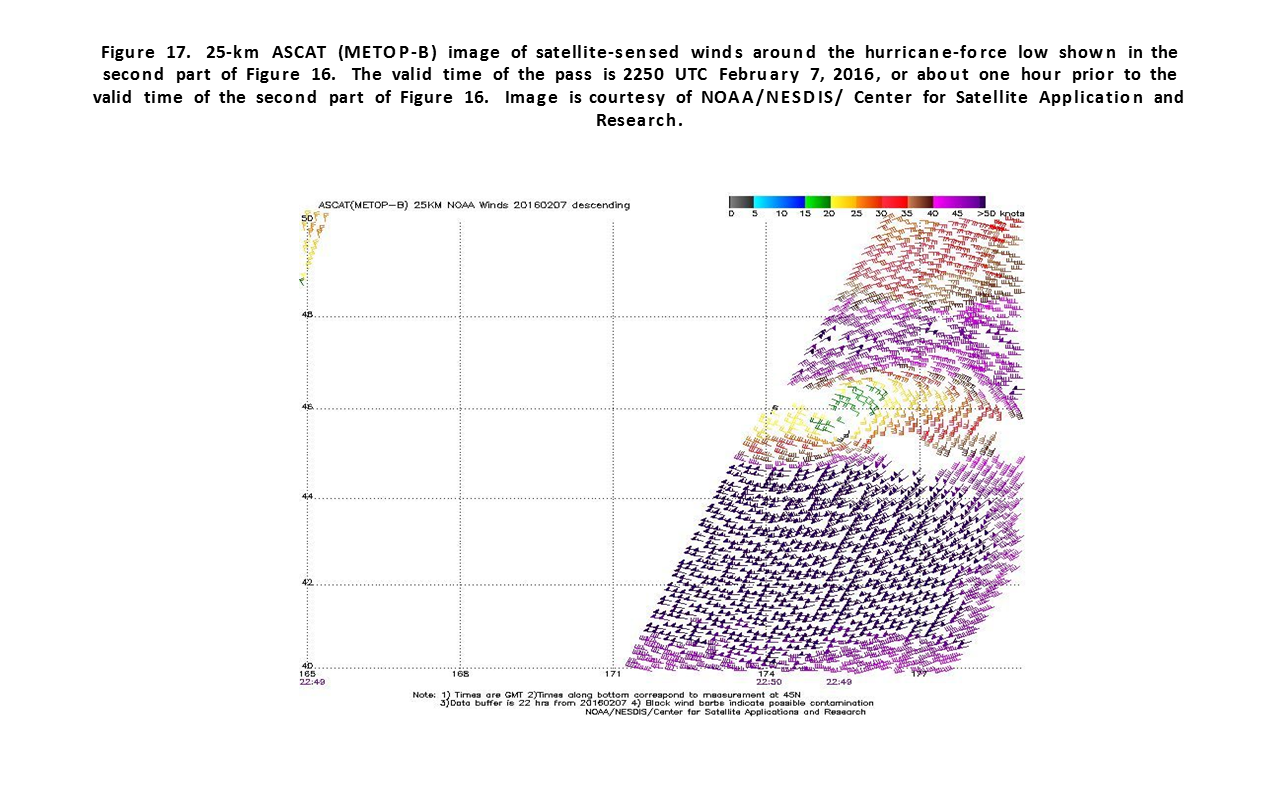
North Pacific Storm, February 6-10: The stronger of the two powerful cyclones mentioned above developed as depicted in Figure 16. The second part of Figure 16 shows the cyclone at maximum intensity. The central pressure fell 46 hPa in 24 hour period ending at 1800 UTC on the 7th. This is almost twice the “bomb” rate at 60N (Sanders and Gyakum, 1980). The ASCAT-B image in Figure 17 shows a large area of 50 to 70 kts winds south of the center and even some 50 kts barbs on the north side. The cyclone then moved east with a gradual weakening trend, and its top winds lowered to storm force by the 9th.
Northwest Pacific Bering Sea Storm, February 17-19: This was one of few cyclones to move into the Bering Sea during the period. It moved from the northern Kurile Islands early on the 17th to the northwest Bering Sea by 1800 UTC on the 18th, where it briefly developed hurricane force winds with a 964 hPa center. It then weakened near the Russian coast the next day.
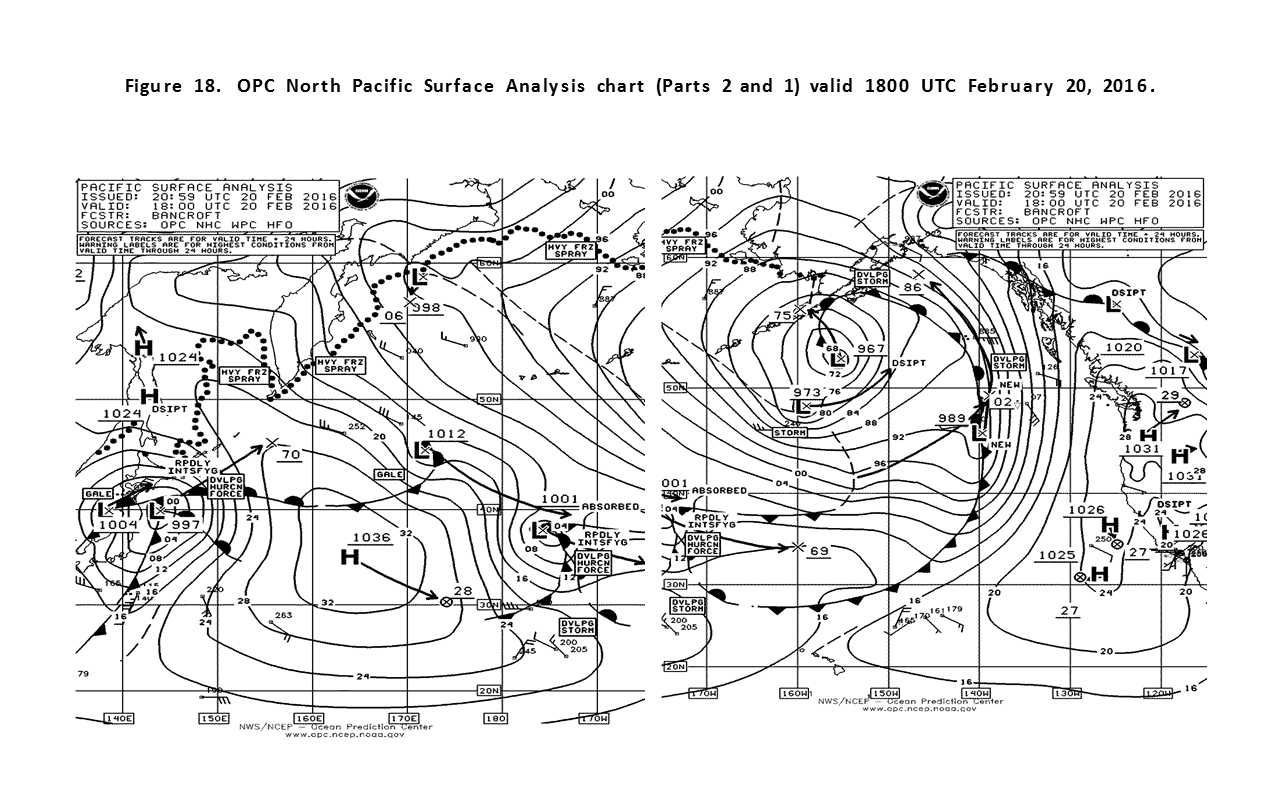
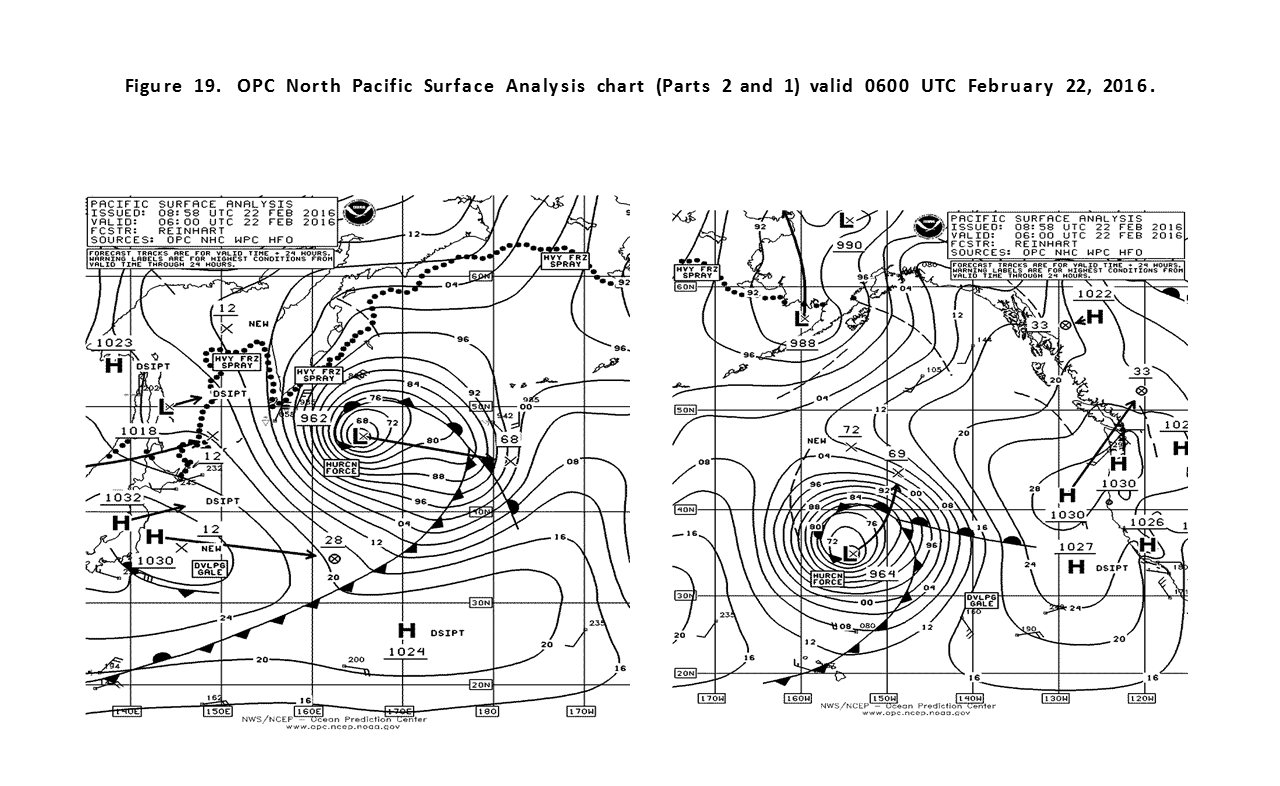
North Pacific Storms, February 19-24: Once again in a very active month, two powerful cyclones developed about at the same time. Figure 18 and Figure 19 depict the developments over a thirty six hour period, leading to two intense hurricane force lows of about the same intensity at 0600 UTC on the 22nd. With the development of the eastern system at low latitude, an ASCAT pass from 2029 UTC on the 21st showed a swath of northwest winds 50 to 60 kts but at a pass edge with the image likely missing the strongest winds south of the storm. The central pressure of the eastern system dropped 33 hPa in the twenty four hour period ending at 1800 UTC on the 21st. The ship TANGGUH HIRI (C6XC2) near 30N 178W encountered northwest winds of 45 kts and 5.8 m seas (19 ft) at 2200 UTC on the 20th. The western cyclone subsequently tracked east southeast and the eastern low northeast, with both weakening to gale force in the eastern waters on the 24th.
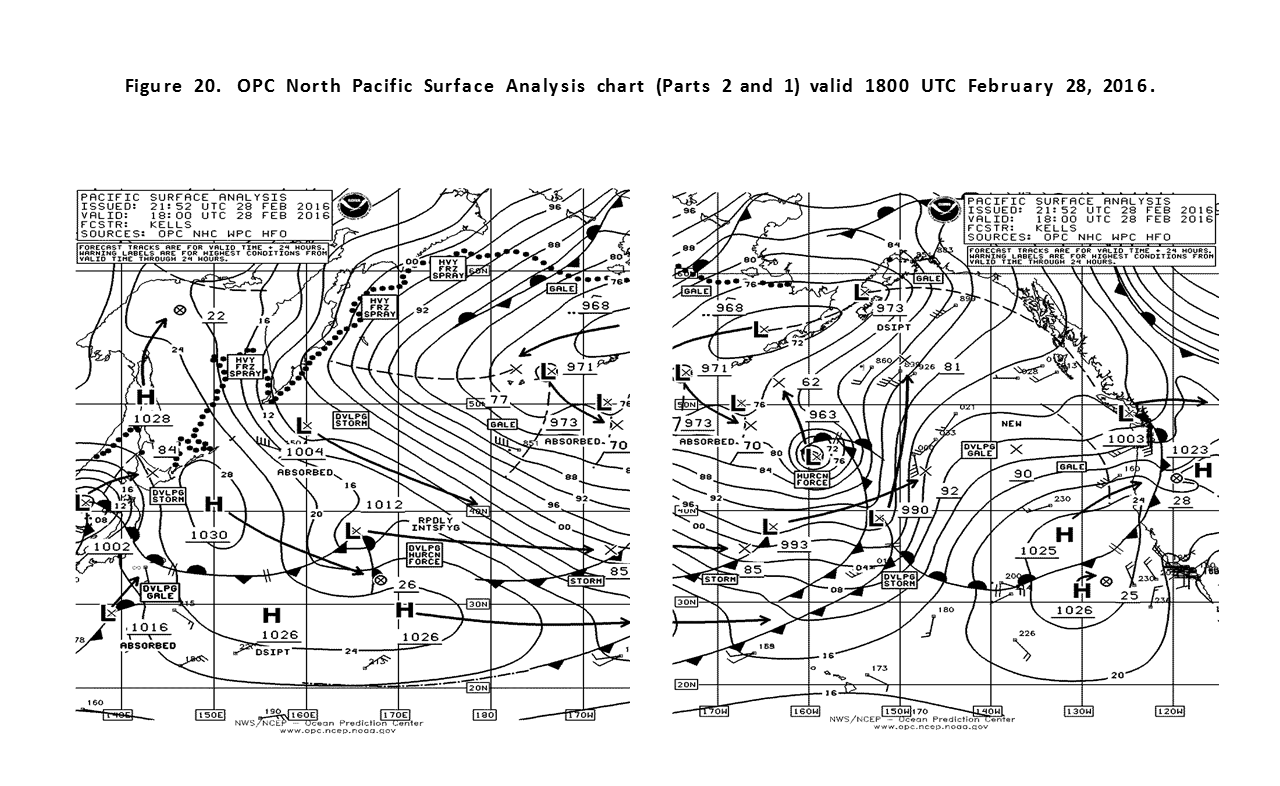
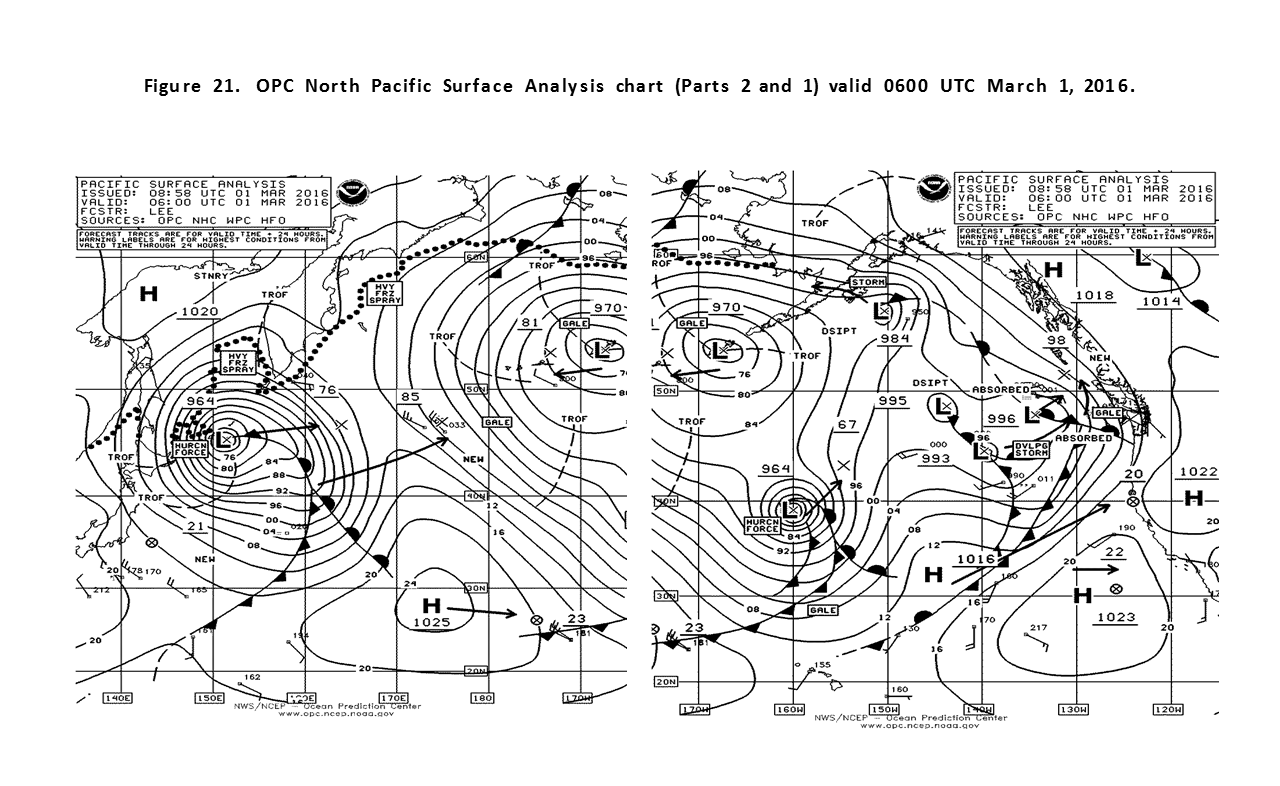
North Pacific Storms, February 27-March 2: Figure 20 and Figure 21 covering a 36 hour period depicts three hurricane force lows of varying size that formed late in February and the beginning of March. The eastern systems were strong and relatively compact lows with the one in Figure 20 originating near 39N 173E late on the 26th and developing hurricane forcewinds early on the 28th before moving northwest and weakening near the eastern Aleutians by March 1st. This was replaced by the low latitude development east of Japan (Figure 20). The development of a larger system of similar intensity near the Kurile Islands is also shown in Figure 20 and Figure 21. The southern storm near 39N 160W deepened by 38 hPa in the 24 hour period ending at 0600 UTC March 1st. An ASCAT pass from 0822 UTC on the 1st returned a swath of northwest winds 50 to as high as 65 kts at a pass edge, missing the area of strongest winds (Figure 23).
Eastern North Pacific Storm, March 6-9: A cyclone coming from the south central waters on the 5th moved northeast and briefly developed hurricane force winds near 47N 152W with a central pressure as low as 962 hPa at 0000 UTC March 8th. An ASCAT pass from 0559 UTC on the 8th revealed a swath of west winds 50 to 55 kts and isolated 60 kts south of the low center. The ship BASLE EXPRESS (DGWD2) located near 49N 136W encountered southwest winds of 55 kts at 1100 UTC on the 8th. The cyclone then weakened and became a weakening gale in the Gulf of Alaska late on the 8th.
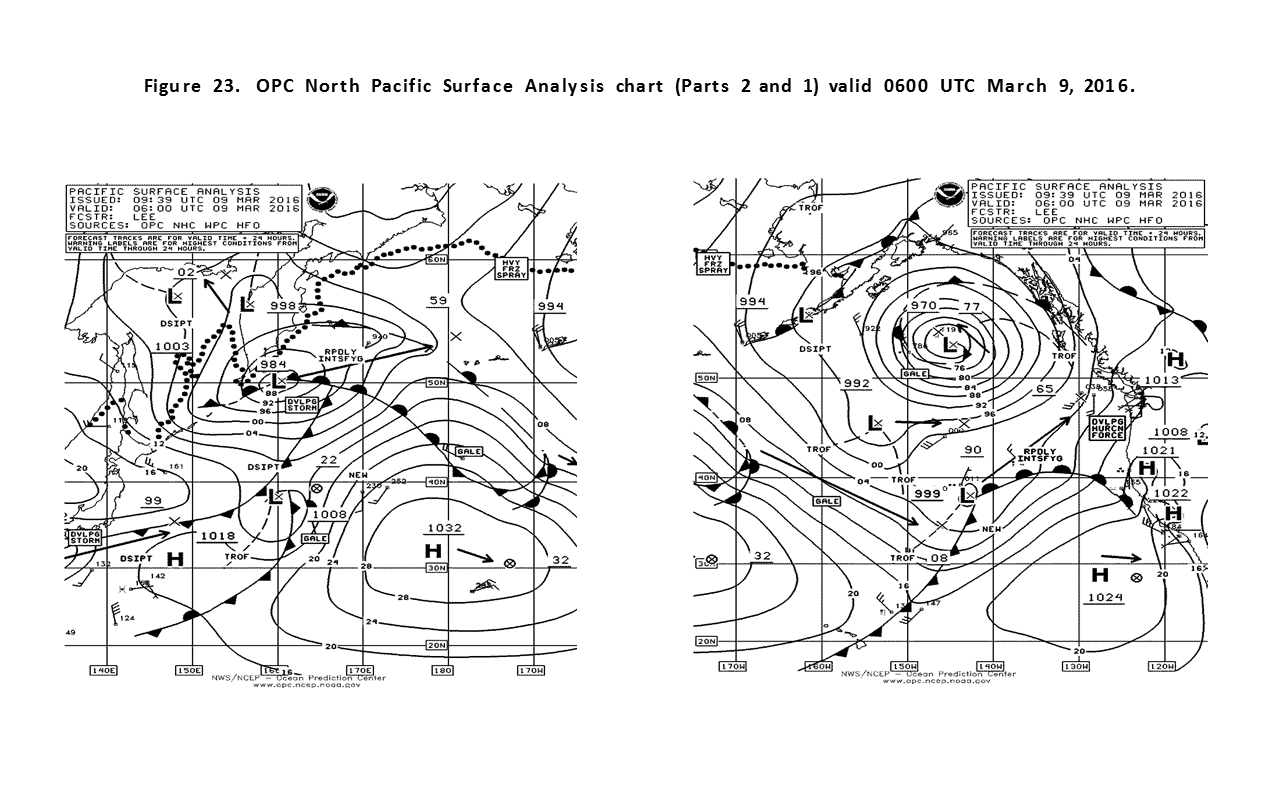
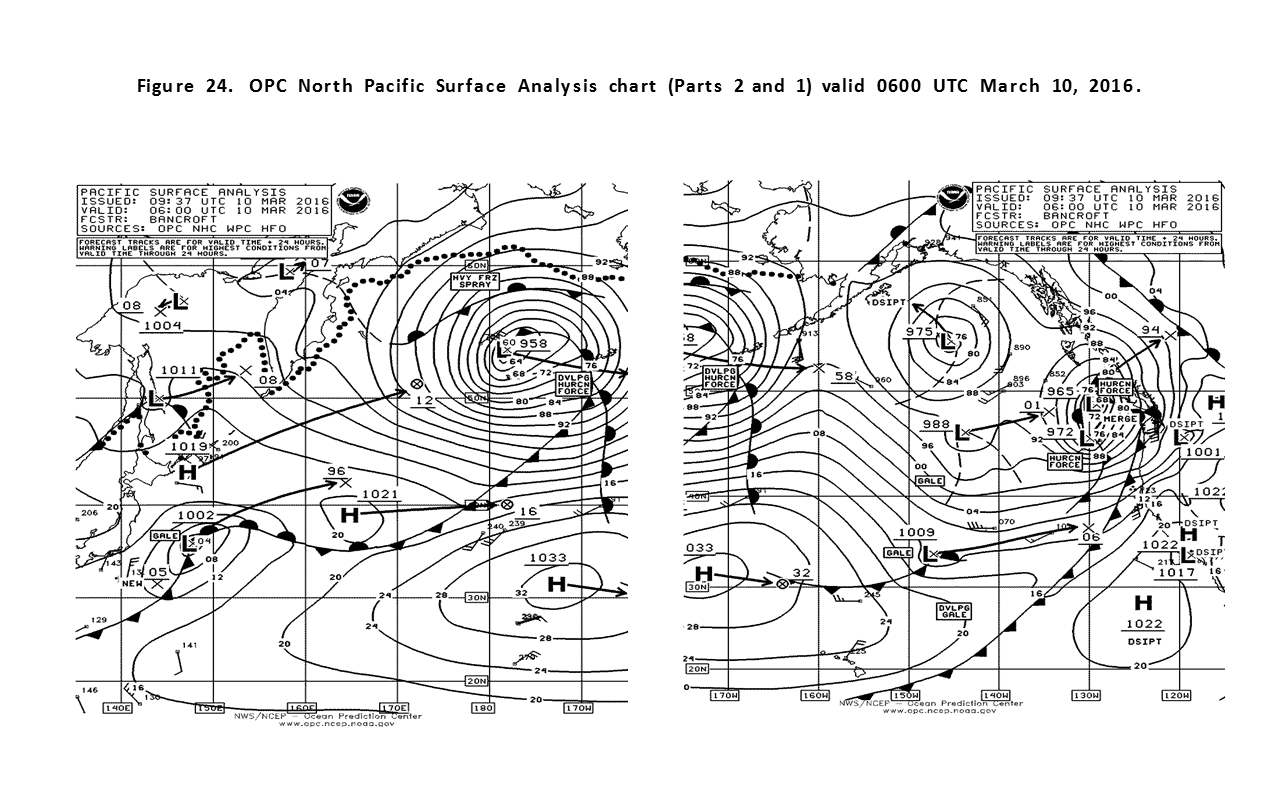
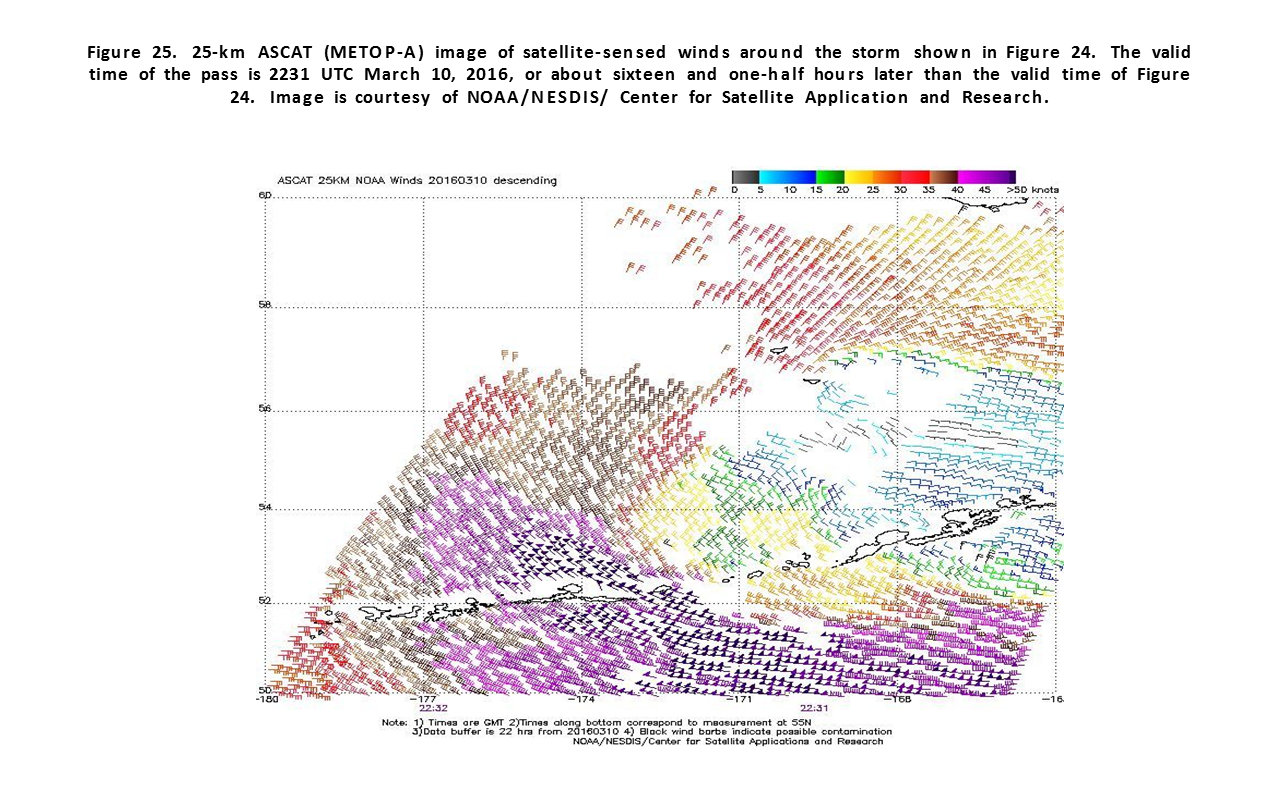
North Pacific Bering Sea Storm, March 8-11: The development of this storm is depicted in Figure 23 and Figure 24 , taking a northern track from the Kurile Islands to the southern Bering Sea over a 24 hour period. It developed a lowest central pressure of 957 hPa and hurricane force winds while turning east to cross the eastern Aleutian Islands 12 hours later. The ASCAT A image in Figure 25 shows a swath of west to northwest winds to 50 kts south and southwest of the cyclone center. Ships in the area reported winds 45 kts or less. Buoy 46035 (57.0N 177.7W) reported northeast winds of 37 kts with gusts to 47 kts and 7.5 m seas (25 ft) at 1200 UTC on the 10th. The system then weakened to a gale while moving across the southern Gulf of Alaska over the next two days.
Eastern North Pacific Storm, March 8-10: Figure 23 and Figure 24 also depict the quick development of a low pressure wave into a complex hurricane force system late on March 9th. Destruction Island C-MAN (47.7N 124.4W) reported south winds of 57 kts with gusts to 67 kts at 1100 UTC on the 10th and a gusts of 74 kts two hours later. Buoy 46089 (45.9N 125.8W) reported southwest winds 41 kts with gusts to 54 kts and a peak gust of 60 kts, and 10.5 m seas (34 ft). The storm complex then moved inland on the 10th.
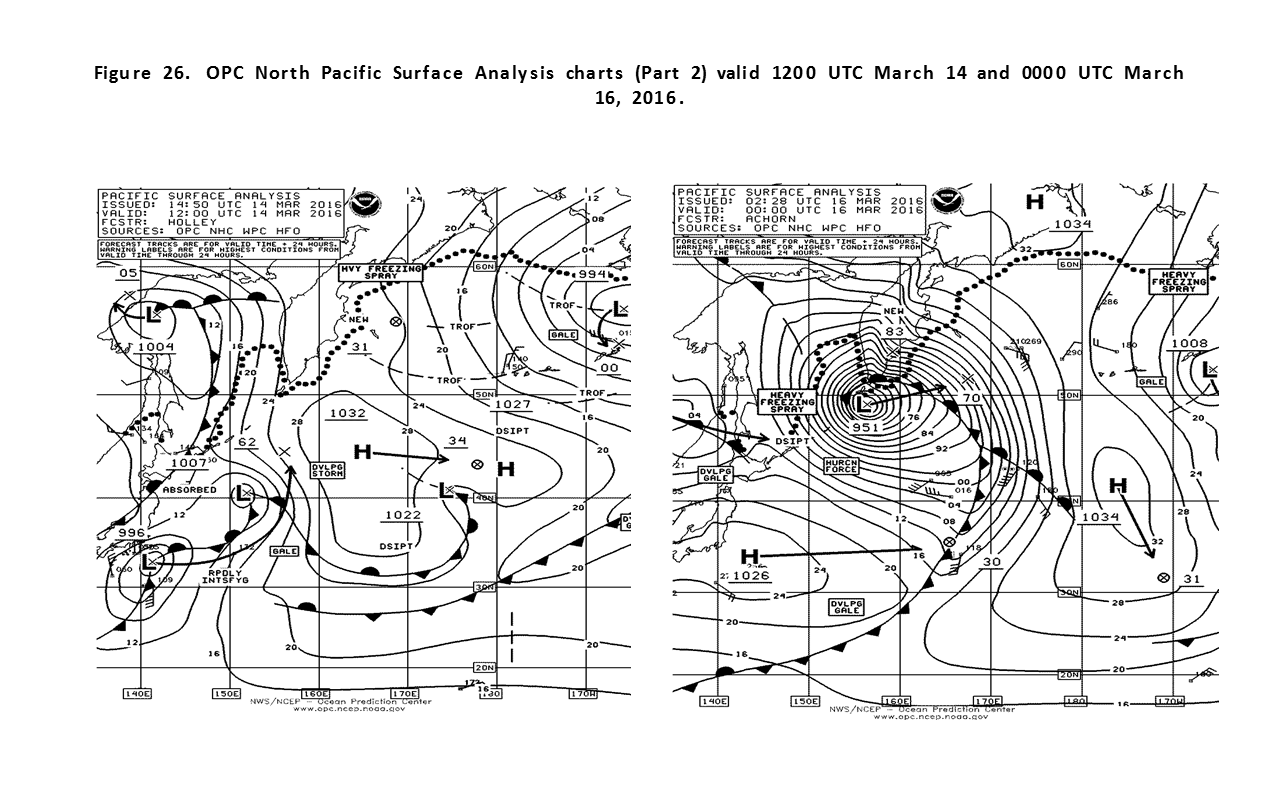
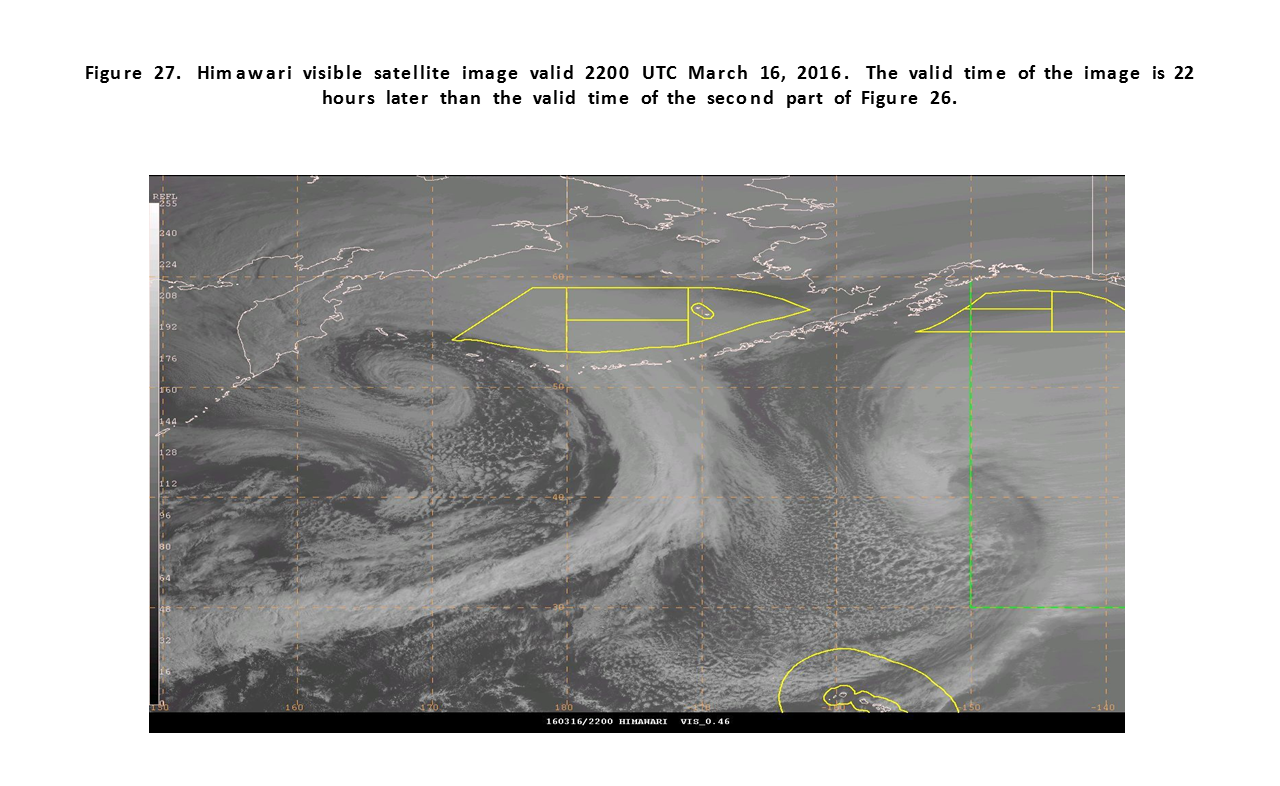
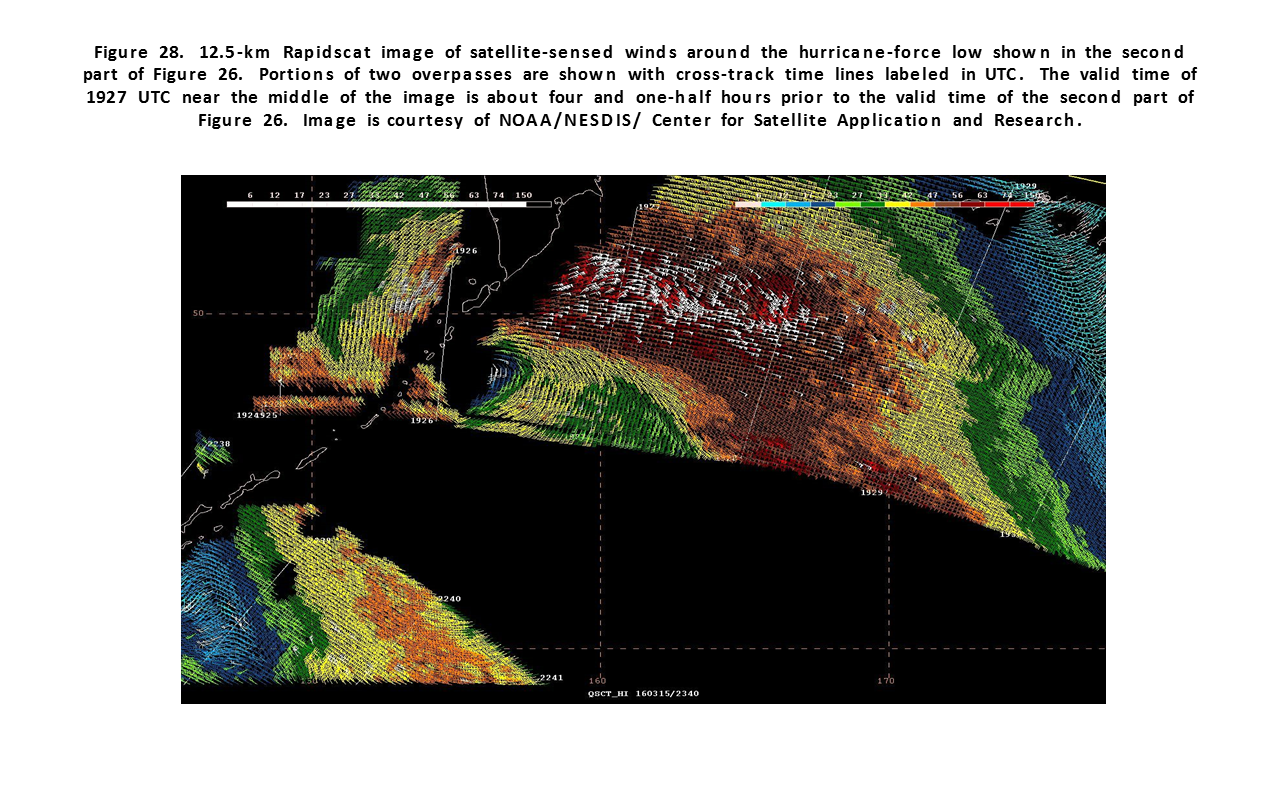
Western North Pacific Storm, March 13-16: Figure 26 depicts the development of this intense system (pressure as low as 951 hPa) from a complex area of low pressure east of Japan over a thirty six hour period. The central pressure dropped 35 hPa in the 24 hour period ending at 1800 UTC on the 15th. The INDIGO LAKE (VROY7) near 42N 161E reported southeast winds of 58 kts at 0600 UTC on the 15th, while APL THAILAND (WCX8882) near 34N 143E encountered north winds of 50 kts and 7.9 m seas (26 ft) six hours prior. Figure 27 is a visible satellite image of the cyclone, fully mature with a well-defined center around which frontal cloud features wrap around the center. A separate comma like cloud system is seen well to the east and was associated with a 972 hPa storm near 41N 151W. The Rapidscat image in Figure 28 shows a broad area of winds 60 kts or higher north of the strong occluded front but misses the stronger winds on the south side. The white barbs indicate possible rain contamination. The cyclone subsequently weakened rapidly while moving into the western Bering Sea on the night of the 16th and on the 17th.
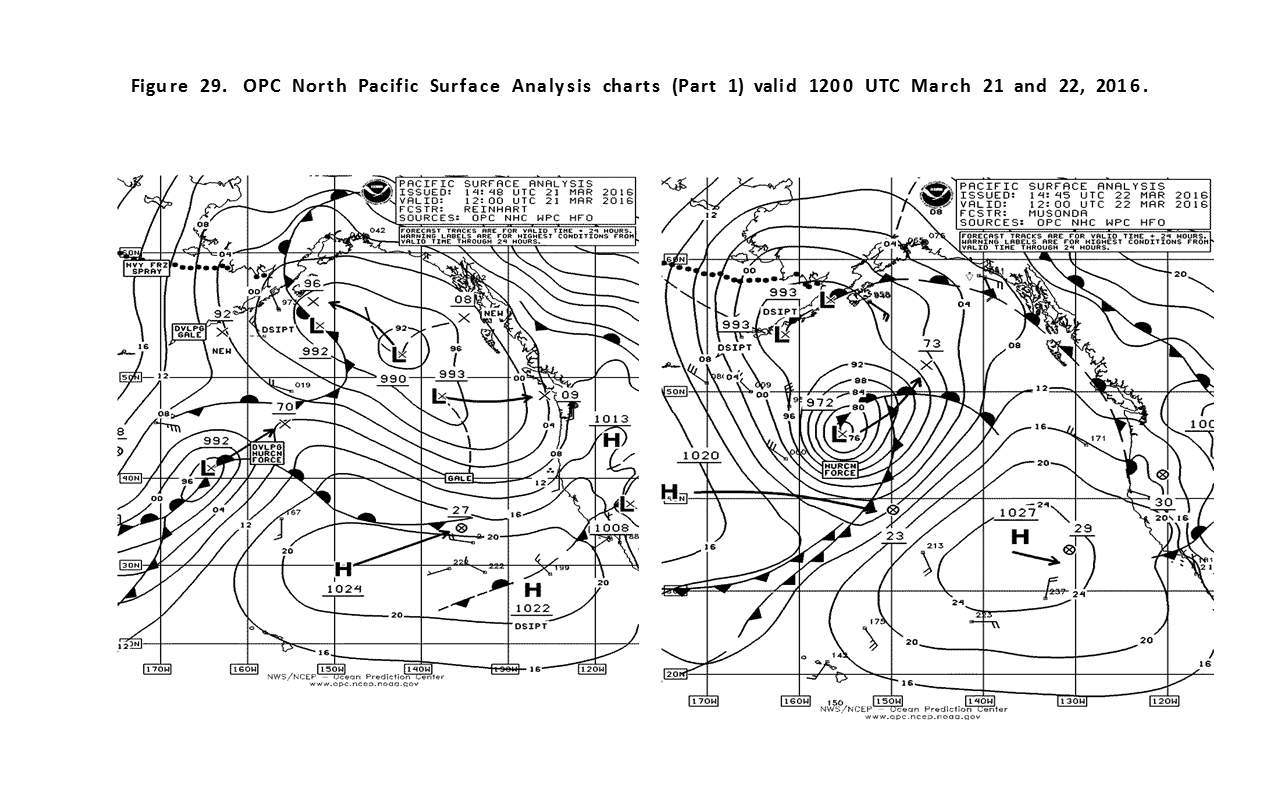
Eastern North Pacific Storm, March 21-23: This cyclone originated well southeast of Japan late on the 16th with the final development over a 24 hour period depicted in Figure 29. The lowest central pressure was 969 hPa at 1800 UTC on the 22nd. An ASCAT (METOP-B) pass from 0702 UTC on the 22nd reveals a swath of winds 50 to 60 kts south of the center. The POLAR RESOLUTION (WDJK) near 51N 138W reported southwest winds of 50 kts and 10.7 m seas (35 ft). The cyclone subsequently moved into the Gulf of Alaska by the 24th where its winds weakened to gale force.
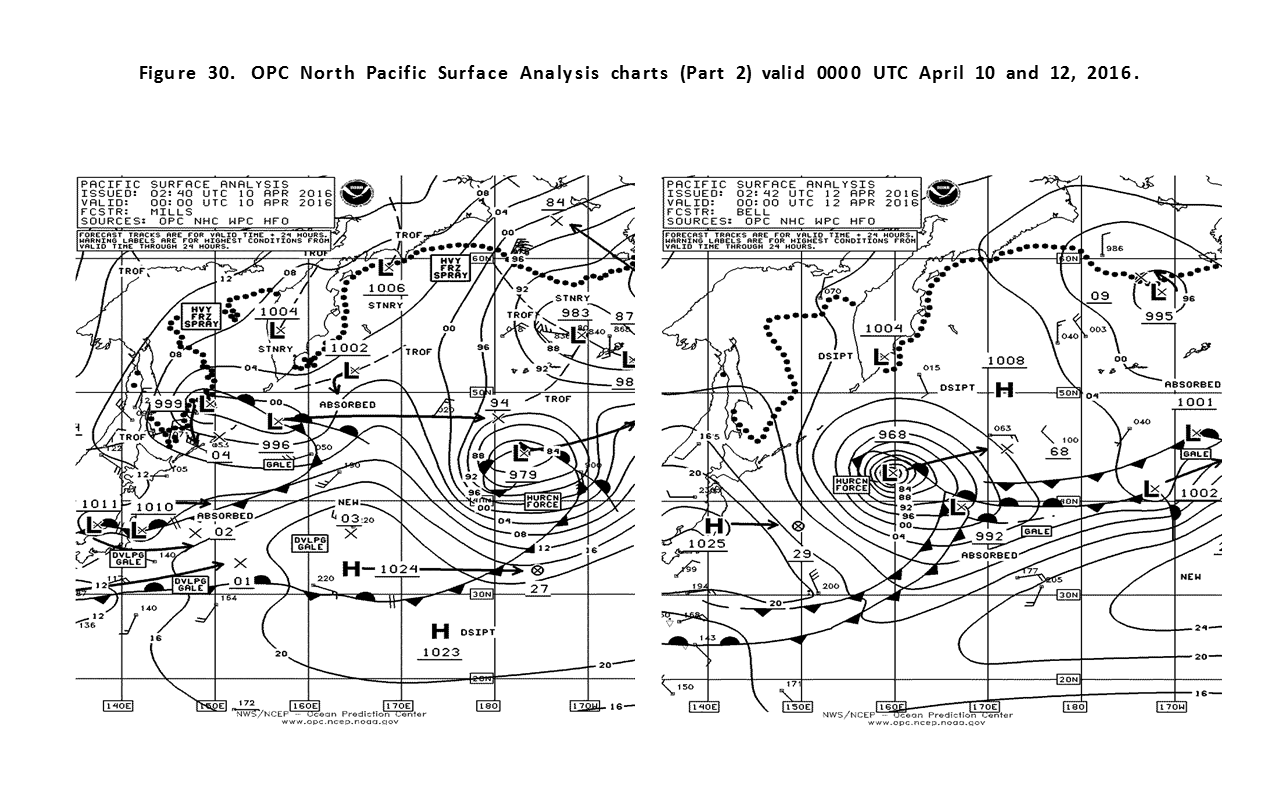
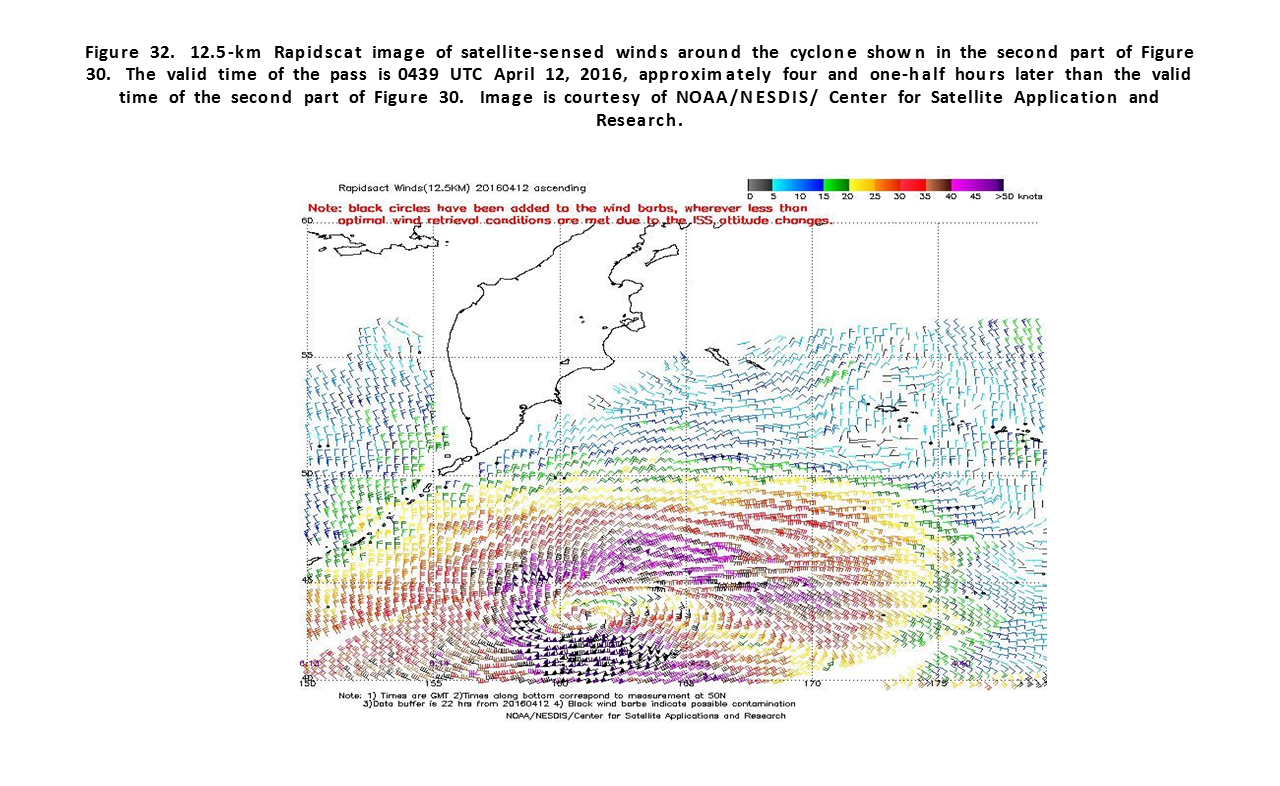
North Pacific Storms April 7-13: Two separate hurricane force cyclones are shown in Figure 30 , covering a two day period. The first or weaker of the cyclones is shown in the left panel near maximum intensity. It originated near Japan already at storm force, weakened to a gale the next day and then re intensified late on the 8th and briefly developed hurricane force winds on the afternoon of the 9th. An ASCAT pass valid near 0000 UTC on the 10th revealed winds to 55 kts on the south side. The cyclone then tracked east northeast and weakened to a gale in the southern Gulf of Alaska three days later. The next development, more intense, came as an area of low pressure moved off Japan and developed quickly on the night of the 10th and on the 11th, when the central pressure fell 36 hPa in the 24 hour period ending at 0000 UTC on the 12th. The lowest central pressure of 964 hPa came six hours later. The visible satellite image of the cyclone near maximum intensity appears to resemble a T-bone cloud structure with an intense warm front and bent back front and a weaker cold front (Shapiro and Keyser, 1990) similar to the appearance in Figure 30. The Rapidscat image in Figure 32 reveals an intense circulation associated with the warm front and bent back front with an 80 kts wind maximum southeast of the cyclone center. The system then moved northeast and began to weaken on the 12th, becoming a gale force low near the eastern Aleutian Islands late on the 13th.
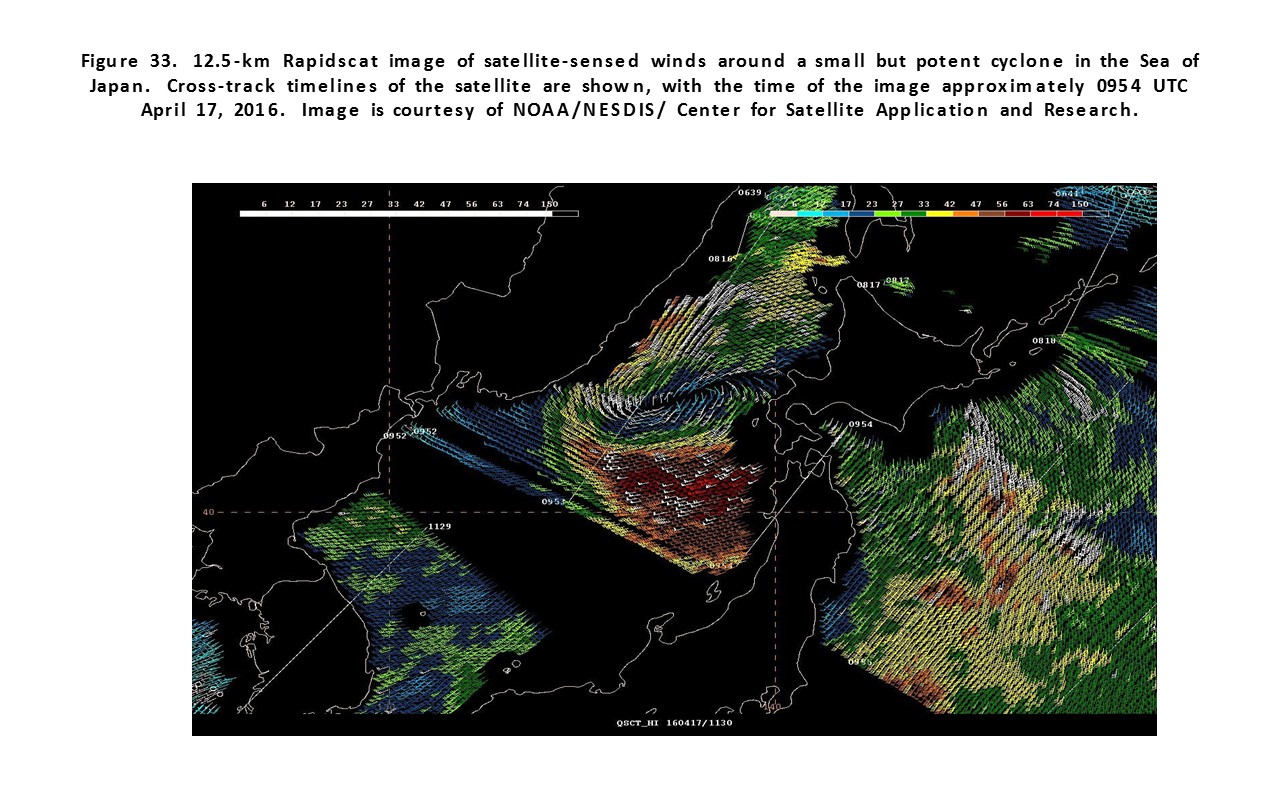
Storm in the Far West (Sea of Japan), April 16-17: This cyclone was short lived, but briefly developed hurricane force winds in the southern Sea of Japan late on the 16th or early on the 17th, as seen in the Rapidscat image of Figure 33. The cyclone developed a central pressure of 977 hPa near 41N 135W at 0600 UTC on the 17th. The COSCO PHILIPPINES (VRGM7) near 37N 135.5E reported south winds of 62 kts at 0200 UTC on the 17th. The cyclone weakened to a gale when passing east of northern Japan late on the 17th.
References
1. Sanders, Frederick and Gyakum, John R., Synoptic-Dynamic Climatology of the "Bomb", Monthly Weather Review, October 1980.
2. Ocean Surface Winds, http://manati.star.nesdis.noaa.gov/products.php
3. VonAhn, Joan. and Sienkiewicz, Joe, "Hurricane Force Extratropical Cyclones Observed Using QuikSCAT Near Real Time Winds", Mariners Weather Log, Vol. 49, No. 1, April 2005.
4. Saffir-Simpson Scale of Hurricane Intensity: http://www.nhc.noaa.gov/aboutsshws.php
5. Tropical Cyclone Reports, 2015, National Hurricane Center, http://www.nhc.noaa.gov/archive/2016/al012016.discus.001.shtml
6. Bancroft, G., "Marine Weather Summary, North Pacific and North Atlantic Areas", Mariners Weather Log, August 2016.
7. Shapiro,M. A. and D. Keyser, 1990: Fronts, Jet Streams and the Tropopause. Extratropical Cyclones, The Erik Palmen Memorial Volume, C.W. Newton and E.O. Holopainen, Eds, Amer.Meteor. Soc., 167-191.