Tropical Atlantic and Tropical East Pacific Areas September through December 2015
Scott Stripling and Michael Formosa
Tropical Analysis and Forecast Branch
National Hurricane Center, Miami, Florida
NOAA National Centers for Environmental Prediction
Tropical North Atlantic Ocean to 31N and Eastward to 35W, including the Caribbean Sea and the Gulf of Mexico
Atlantic Highlights
The autumn period of September through December 2015 proved to be active in terms of gale conditions across the TAFB Area of Responsibility (AOR). Although a strong El Nino event across the Pacific Basin limited tropical cyclone activity in the Atlantic Basin, the 21 non-tropical cyclone warnings issued for the Tropical North Atlantic were slightly above average (18) for warnings issued during this same period 2010 through 2015.
Table 1. Below shows the non-tropical warning events that occurred across the Tropical Atlantic, Gulf of Mexico, and Caribbean Sea during this period. While only 7 events occurred September through early November, late November through December proved very active, with 14 events occurring during the last 6 weeks of the year.
Table 1. Non-tropical Warnings issued for the Atlantic Basin between 01 Sept 2013 and 31 Dec 2015.
| Onset | Region | Peak Wind Speed | Duration | Forcing |
|---|---|---|---|---|
| 0000 UTC 29 Sep | Gulf of Mexico | 35 kts | 06 hr | Cold front |
| 1800 UTC 01 Oct | SW N Atlc | 35 kts | 42 hr | Low pres |
| 1200 UTC 17 Oct | Gulf of Mexico | 35 kts | 90 hr | Cold front |
| 0600 UTC 25 Oct | Gulf of Mexico | 40 kts | 42 hr | Cold front |
| 0000 UTC 31 Oct | Gulf of Mexico | 35 kts | 18 hr | Return flow |
| 1800 UTC 01 Nov | Gulf of Mexico | 40 kts | 12 hr | Cold front |
| 0000 UTC 08 Nov | Gulf of Mexico | 35 kts | 18 hr | Cold front and low pres |
| 0000 UTC 20 Nov | SW N Atlc | 35 kts | 12 hr | Cold front |
| 1800 UTC 21 Nov | Gulf of Mexico | 40 kts | 42 hr | Cold front |
| 0000 UTC 23 Nov | SW N Atlc | 35 kts | 12 hr | Cold front |
| 1200 UTC 25 Nov | SW N Atlc | 35 kts | 48 hr | Cold front |
| 0600 UTC 03 Dec | Gulf of Mexico | 35 kts | 24 hr | Cold front |
| 0600 UTC 05 Dec | SW N Atlc | 35 kts | 24 hr | Cold front |
| 0600 UTC 06 Dec | Central Caribbean | 40 kts | 12 hr | Pres gradient |
| 0000 UTC 12 Dec | SW N Atlc | 35 kts | 24 hr | Cold front |
| 0600 UTC 17 Dec | SW N Atlc | 35 kts | 06 hr | Cold front |
| 1200 UTC 18 Dec | Gulf of Mexico | 35 kts | 12 hr | Cold front |
| 0000 UTC 20 Dec | Central Caribbean | 40 kts | 204 hr | Pres gradient |
| 1800 UTC 27 Dec | Gulf of Mexico | 35 kts | 30 hr | Cold front |
| 0600 UTC 29 Dec | Central Caribbean | 40 kts | 18 hr | Pres gradient |
| 0000 UTC 30 Dec | Central Caribbean | 35 kts | 24 hr | Pres gradient |
The first gale of the season occurred across the northern Gulf of Mexico on 29 September in the southerly flow ahead of a cold front and supporting surface low pressure system moving across the Gulf Coast region. This event was very short lived, only 6 hours. From mid October through the first week of November, the Gulf of Mexico then became the focus for warnings as five consecutive cold fronts moving into the basin produced gales. All of these occurred in the northerly flow behind the fronts, except for gale force southerly return flow ahead of a front approaching the basin on 31 October. The orographic influence of eastern Mexico aided in focusing post frontal gales over western portions of the basin, across the near and offshore coastal waters from Tampico to south of Veracruz. The strongest of these northerly gales occurred 25-27 October when ASCAT METOP-A scatterometer data confirmed 40 Kt winds across Texas near and offshore coastal waters at 1629 UTC 25 November.
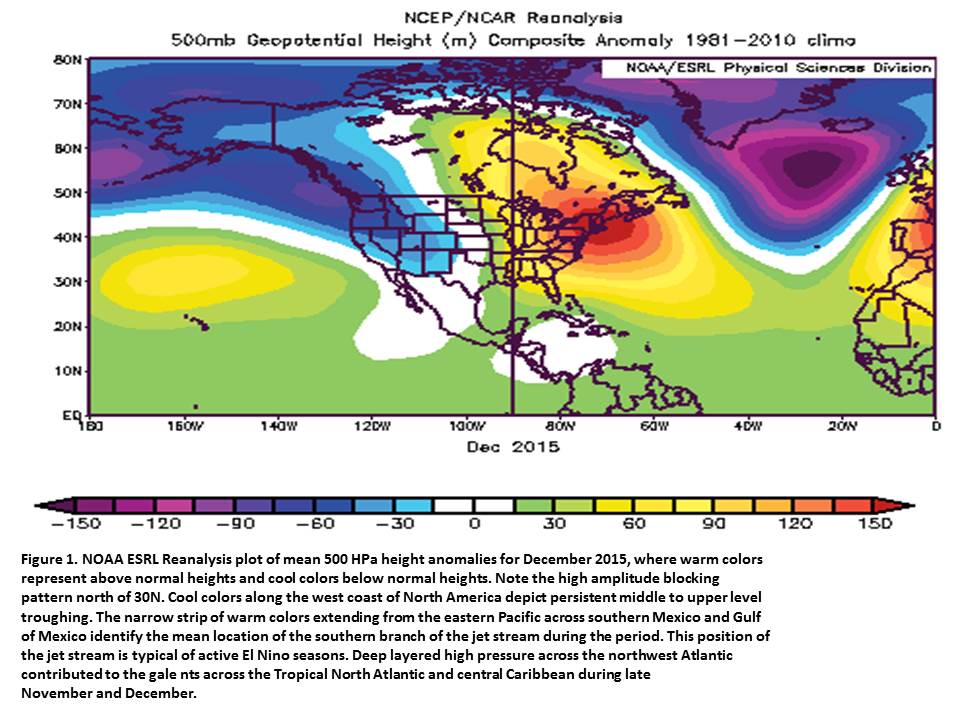
A gradual change in the upper level pattern in mid to late November moved the focus of gales from the western Gulf of Mexico to northern portions of the Tropical North Atlantic waters as a blocking upper level ridge became prevalent through December across the NW Atlantic and eastern North America,Figure 1. Several cold fronts swept across north and northeast portions of the TAFB AOR, while strong post frontal surface high pressure systems lingered across the western Atlantic. The position of these strong ridges located due north of the central Caribbean combined with semi-permanent low pressure across Colombia to yield 4 separate gale events across the Colombian Basin in the month of December. One such event lasted nearly eight consecutive days, 20 through 28 of December.
Large Wave Causes Damage to MSC DIVINA, 27 November 2015
With the increasing popularity of the cruise industry during the past decade, and the explosion of social media, adverse weather conditions at sea are now frequently documented and shared with a large audience. On 26 November, the MSC DIVINA was in transit from San Juan, Puerto Rico to Nassau, Bahamas when it encountered very rough weather and large seas. At around 1140 pm local time, or 0340 UTC 27 November, what was described as a "freak" wave estimated at 30 ft (9 m), struck the starboard side of the ship while located approximately 150 nm ESE of Nassau, Bahamas causing damage to a small cabin porthole. Onboard MSC technicians immediately sealed the damaged porthole, and guests staying in the area affected by the damage were given alternative accommodations. Only minor injuries to two guests were reported during this event. Reference 1.
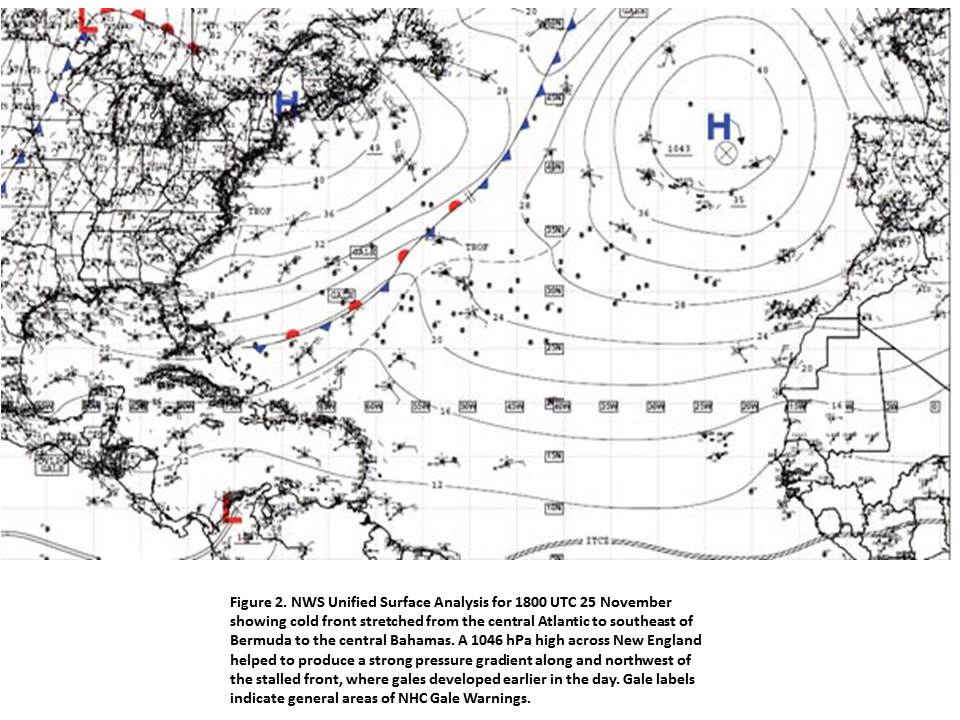
Although the damage to the MSC DIVINA was attributed to a single large wave, meteorological conditions across the region during the previous days had generated a broad and extensive area of seas 12 ft or greater, which prevailed east of the Bahamas on the night of 26- 27 November. A cold front moved off of the eastern seaboard of the U.S. on 23 November and quickly merged with an old frontal boundary lingering offshore. This merged frontal boundary then continued moving southeastward across the Atlantic through early 25 November, where it stalled across the central Atlantic to just southeast of Bermuda to the southern Bahamas. A persistent low to middle level inverted trough residing across the subtropical Atlantic between 55W and 65W during this time helped to block the front from progressing further southeastward. Strong surface high pressure in excess of 1040 hPa building across the NW Atlantic on 25 November created a tight pressure gradient to the northwest of the stalled frontal boundary, which produced an elongated zone of strong to gale force northeast winds. Northeasterly gales began by 0600 UTC on 25 November just north of 31N and by 1200 UTC extended southwestward to 27N. Figure 2 below shows the Unified Surface Analysis (USA) valid at 1800 UTC 25 November, 2015.
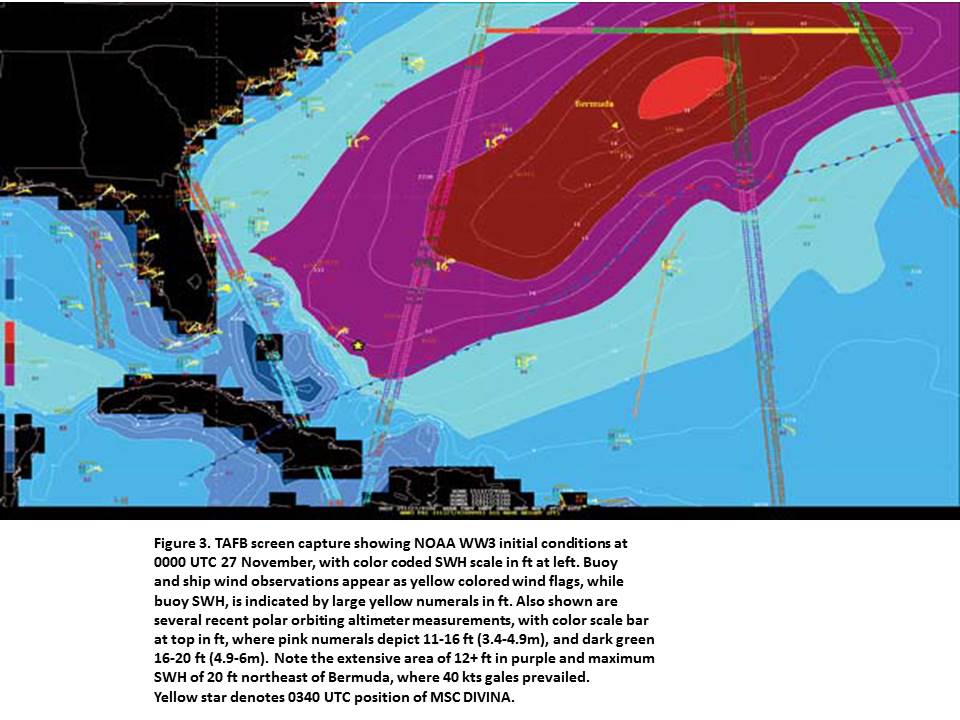
As the front remained nearly stationary through late on 26 November, the resultant 1000 nm long NE to SW fetch of 25- 40 kts winds generated an impressive area of seas 12 to 22 ft (3.5 to 6.5 m). Figure 3 shows the NOAA WAVEWATCH III (WW3) forecast for 00 UTC 27 November with ship and buoy observations for 0300 UTC and recent altimeter measurements. Note the location of the DIVINA identified by the yellow star, moving NW and parallel to the Bahamas and passing through the southwestern periphery of this extensive area of high seas. At this time, buoy 40147 reported significant wave heights (SWH) of 16 ft (5 m) with dominant wave period of 11 seconds, while 2310 UTC altimeter data showed seas 12 to 14 ft (3.5 to 4.5m) the northeast and upwind of the DIVINA. Also shown is the observation from the freighter TROPIC SUN (J8AZ2) estimating seas of 19 ft (5.5 m). This scenario suggests very rough and hazardous marine conditions along the path of the DIVINA but certainly within the capabilities of such a vessel.
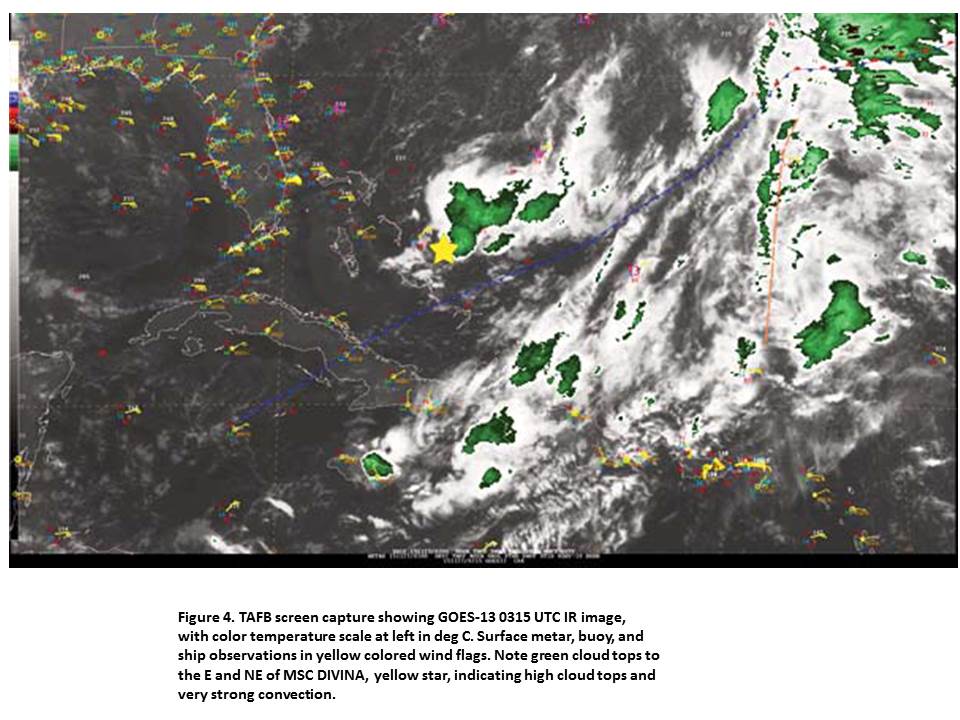
To further exacerbate marine conditions on this night, strong thunderstorms and squalls developed along and to the north of the stalled frontal boundary. Personal communications later forwarded to TAFB indicate that squalls had impacted the DIVINA in the few hours preceding the destructive 30 ft (9 m) wave. Approximately 30 minutes prior to the destructive wave, the DIVINA'S onboard cruise information channel displayed current weather conditions of NE winds at 64 kts.
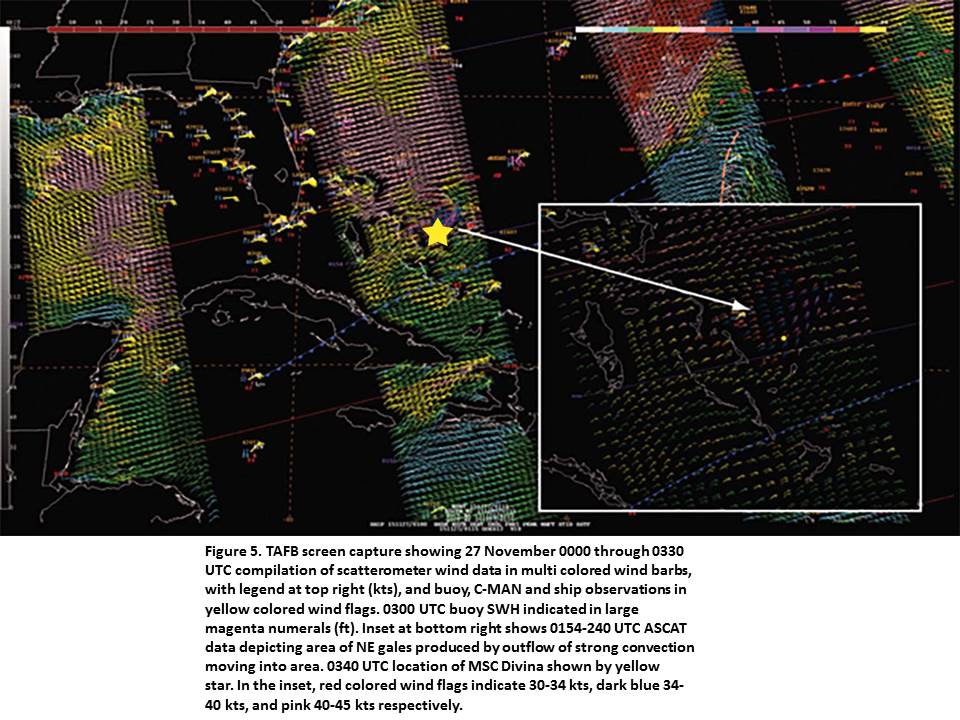
Figure 4 shows a 0315 UTC GOES-E IR satellite image with DIVINA position indicated by the yellow star, and estimated post analysis of the frontal position. Note the bright green colored cloud tops of -50 to -55 deg C, depicting strong thunderstorms moving southeastward towards the Bahamas and the DIVINA. Figure 5 shows an ASCAT wind data composite from 0100-0300 UTC across the broader region, with 0300 UTC surface observations, and cold frontal position at 00 UTC. Inset at bottom right is a blow up of central Bahamas region and DIVINA location, where ASCAT wind data from 0154 to 0240 UTC clearly identifies the gale force downdraft winds being produced by the cluster of strong convection approaching the DIVINA. The ASCAT data suggest winds in the 30-45 kts range, with a few wind flags identified as potentially rain contaminated by the closed circle at base of flag. Given the height of the anemometer on a cruise ship such as the DIVINA, the 64 kts reading on the ship information channel is certainly possible. Additionally, the WESTERDAM (PINX) also reported NE winds of 60 kts in this same area at 0600 UTC. The combination of prevailing large northeast swell and wind driven seas generated by these squalls and thunderstorms certainly would be capable of producing seas of 19 ft (6 m) as the TROPIC SUN reported.
Remember that NWS wave forecasts provide the SWH, which by definition is the average of the highest 33% of all waves. When considering the full statistical spectrum of sea state, the highest 10% of all waves is 1.27 x SWH, and maximum wave height equals 2 x SWH. Thus given the wave to wave interaction occurring between the prevailing large NE swell and the steep waves generated by the squalls and thunderstorms that night, the reported 30 ft wave is well within the range of wave heights statistically expected with this scenario.
Tropical Eastern North Pacific Ocean to 30N and East of 140W
The fall and winter months are an active time for gale and storm force wind events in this portion of the Eastern North Pacific Ocean. This tabulation is for the time period of 1 September to 31 December 2015. The majority of the events typically occur in the Gulf of Tehuantepec. This 2015 fall season, had 10 Gulf of Tehuantepec gale and storm events, one (1) Gulf of California gale event, and one (1) Gulf of Papagayo gale event. Table 2 provides details on these events.
Table 2. Non-tropical cyclone Warnings issued for the Pacific Basin between 01 Sep 2015 and 31 Dec 2015.
| Onset | Region | Peak Wind Speed | GALE/ STORM Duration |
|---|---|---|---|
| 1200 UTC 15 Oct | Gulf of Tehuantepec | 35 kts | 138 hr |
| 0600 UTC 26 Oct | Gulf of Tehuantepec | 35 kts | 18 hr |
| 0600 UTC 09 Nov | Gulf of Tehuantepec | 35 kts | 12 hr |
| 1200 UTC 13 Nov | Gulf of Tehuantepec | 40 kts | 90 hr |
| 0600 UTC 20 Nov | Gulf of Tehuantepec | 35 kts | 30 hr |
| 1800 UTC 22 Nov | Gulf of Tehuantepec | 50 kts | 42 hr / 36 hr |
| 1200 UTC 28 Nov | Gulf of Tehuantepec | 35 kts | 06 hr |
| 1200 UTC 29 Nov | Gulf of Tehuantepec | 40 kts | 30 hr |
| 1200 UTC 03 Dec | Gulf of Tehuantepec | 50 kts | 48 hr / 30 hr |
| 1800 UTC 18 Dec | Gulf of Tehuantepec | 50 kts | 48 hr / 18 hr |
| 0000 UTC 27 Dec | Gulf of California | 35 kts | 18 hr |
| 0600 UTC 27 Dec | Gulf of Papagayo | 35 kts | 06 hr |
Ship reports received through the Voluntary Observing Ship (VOS) program are a vital source of data in verifying gale and storm events. Some select ship reports that directly verified some of this season's gales are listed in Table 3.
Table 3. Ship reports that verified gale events over the Gulf of Tehuantepec and Gulf of Papagayo between 01 Sep 2015 and 31 Dec 2015
| TIME/DATE | SHIP | LOCATION | WIND SPEED and SEAS |
|---|---|---|---|
| 1700 UTC 23 Nov | Amsterdam (PBAD) | 15.6N 95.7W | 38 kts 3 ft (1 m) |
| 1800 UTC 23 Nov | Tasman Crusader (A8NQ7) | 14.6N 94.9.4W | 40 kts 10 ft (3 m) |
| 0400 UTC 24 Nov | Amsterdam (PBAD) | 15.2N 94.4W | 40 kts 16 ft (5 m) |
| 1200 UTC 24 Nov | Pazifik (ZDKS7) | 13.8N 96.5W | 35 kts |
| 1200 UTC 04 Dec | Cap Palliser (A8OH4) | 14.4N 94.3W | 38 kts |
| 1800 UTC 04 Dec | CSCL Dalian (VRBH4) | 14.3N 95.8W | 39 kts 16 ft (5 m) |
| 1300 UTC 06 Dec | Alliance Fairfax (WLMQ) | 13.1N 96.2W | 45 kts 16 ft (5 m) |
| 0700 UTC 27 Dec | Regatta (V7DM3) | 10.9N 86.6W | 50 kts |
| 1100 UTC 27 Dec | Island Princess (ZCDG4) | 11.3N 86.2W | 39 kts 7 ft (2 m) |
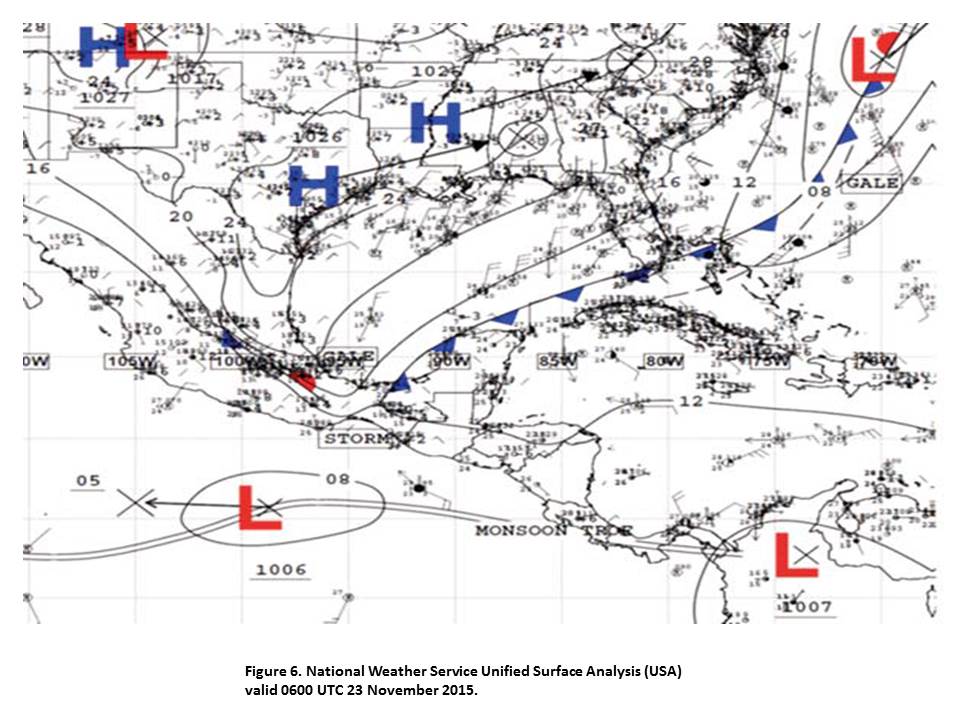
The Gulf of Tehuantepec wind events are usually driven by mid-latitude cold frontal passages through the narrow Chivela Pass in the Isthmus of Tehuantepec between the Sierra Madre de Oaxaca Mountains on the west and the Sierra Madre de Chiapas Mountains on the east. The northerly winds from the southwest Gulf of Mexico funnel through the pass delivering stronger winds into the Gulf of Tehuantepec. The events are of various duration with the longer events associated with reinforcing secondary cold fronts in the Gulf of Mexico. The events are usually void of precipitation in the Gulf of Tehuantepec, thus scatterometer passes are not rain contaminated and wind retrievals are of the highest quality. The Gulf of Tehuantepec gale and storm events for the 2015 season totaled 546 hours, a 10% decrease from last season's 606 hours. The 2013 season had a very active 642 hours. The 2012 and 2011 seasons had 492 hours. The first storm event of the season occurred on 23-24 November 2015. Gale force northerly winds in thesouthwest Gulf of Mexico behind a cold front funneled through the Chivela Pass resulting in a storm event in the Gulf of Tehuantepec (Figure 6).
Note that the 1026 hPa High over southeast Texas significantly increased the surface pressure gradient over the Isthmus of Tehuantepec. This wind event commenced at 1800 UTC 22 November 2015 as a gale. Winds increased to storm force 12 hours later and lasted until 24 November 1800 UTC when winds once again decreased to gale force. The event ended on 26 November 0000 UTC and lasted a total of 78 hours, one of the longest events of the season thus far.
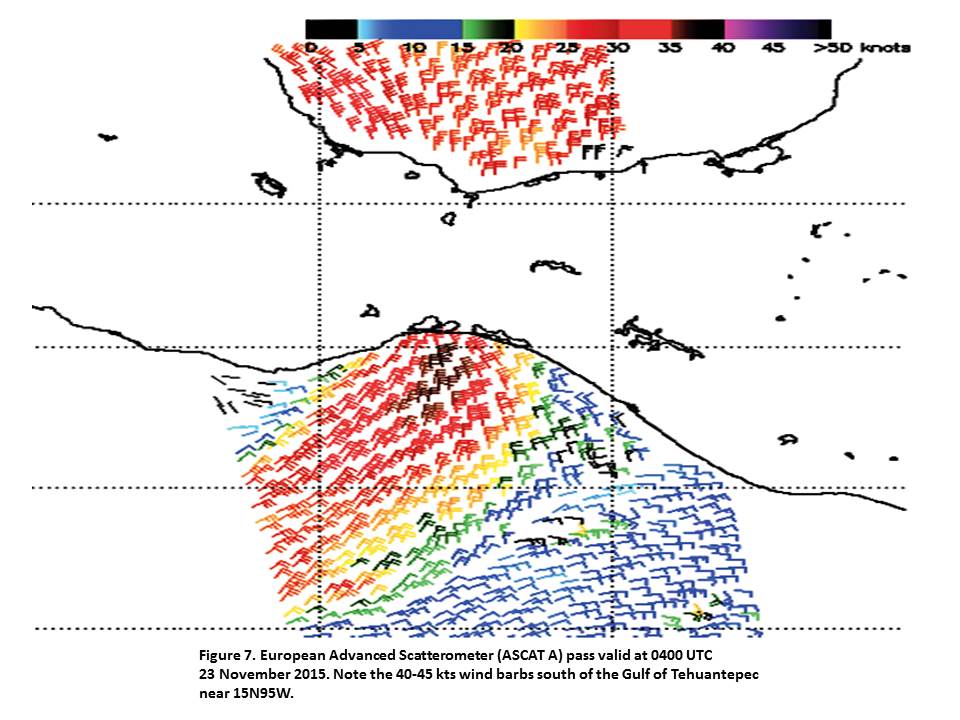
A European Advanced Scatterometer (ASCAT A) pass captured the gale portion of the event in both the Bay of Campeche and the Gulf of Tehuantepec (Figure 7). A large gale area was depicted over the Gulf of Tehuantepec surrounded by a larger area of 20-30 kts winds. Gale force winds extended southward to 14N between 94W and 96W. The TASMAN CRUSADER (A8NQ7), the AMSTERDAM (PBAD), and the PAZIFIK (ZDKS7) traversed the area and reported gale force winds on 23 November and 24 November 2015.
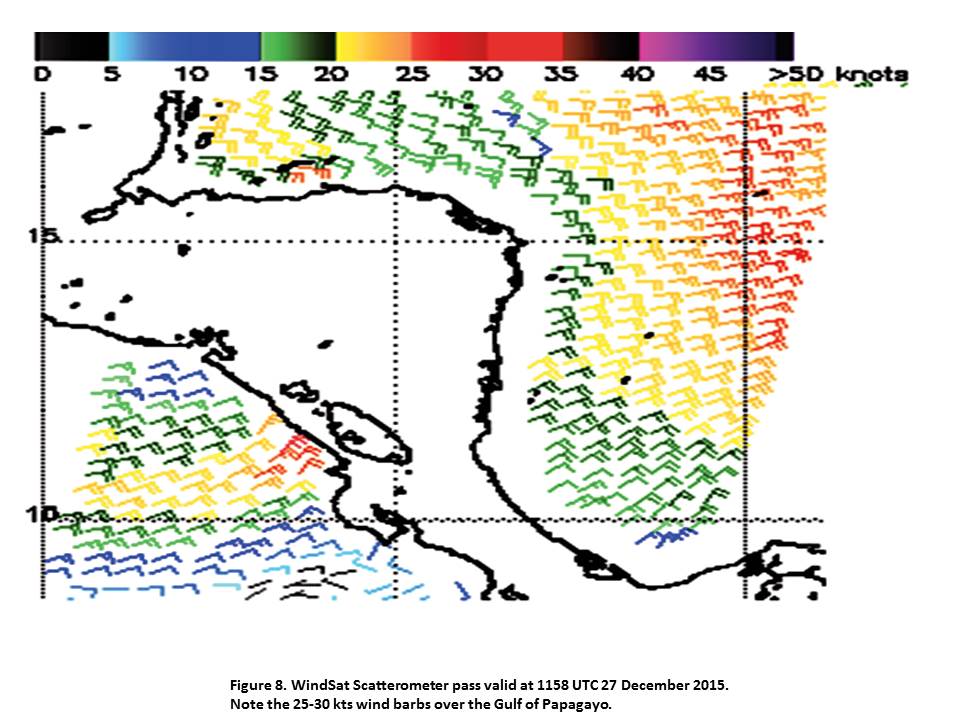
The Gulf of Papagayo gap wind events are usually driven by strong Caribbean Sea trade winds that traverse the San Juan River valley and the southern portion of Lake Nicaragua to the Pacific Ocean. Winds in the Gulf of Papagayo during these events are usually less than gale force. The winds are further enhanced by nocturnal and early morning drainage flow. On rare occasions, a strong cold front reaches the coast of southern Nicaragua and funnels stronger winds through the gap. These winds on occasional reach gale force in the Gulf of Papagayo. The REGATTA (V7DM3) and the ISLAND PRINCESS (ZCDG4) reported gale force winds on 27 December 2015. A WindSat scatterometer pass captured the wind event in the Gulf of Papagayo. (Figure 8). WindSat is a polar orbiting satellite with a microwave radiometer developed by the U.S. Navy. The satellite was launched on a Titan II rocket from Vandenburg Air Force Base California on 6 Jan 2003. The satellite was built for a three year lifetime that it handily exceeded.
References
1. http://www.seatrade-cruise.com/news/news-headlines/freak-wave-causes-minor-damage-tomsc- divina-cruise-unaffected.html
Back to top