Marine Weather Review - North Pacific Area March to August 2015
George P. Bancroft Ocean Forecast Branch, Ocean Prediction Center, College Park, MD NOAA National Center for Environmental Prediction
Introduction
The weather pattern over the North Pacific continued to be relatively
inactive especially in March which, after February produced no
hurricane force events (Reference 4), featured only one such event.
April also produced just one hurricane force low. In addition there
were no really deep cyclones except one with tropical origin, such as
Post-Tropical Atsani. There appeared to be a lack of a strong zonal jet
stream to provide energy for developing cyclones like the North
Pacific has been experiencing in the current winter of 2015-16 which
has produced many hurricane force events.
The tropics were relatively active with ten tropical systems including two coming from the Central Pacific. These two systems became strong post-tropical cyclones (Dolphin and Atsani).
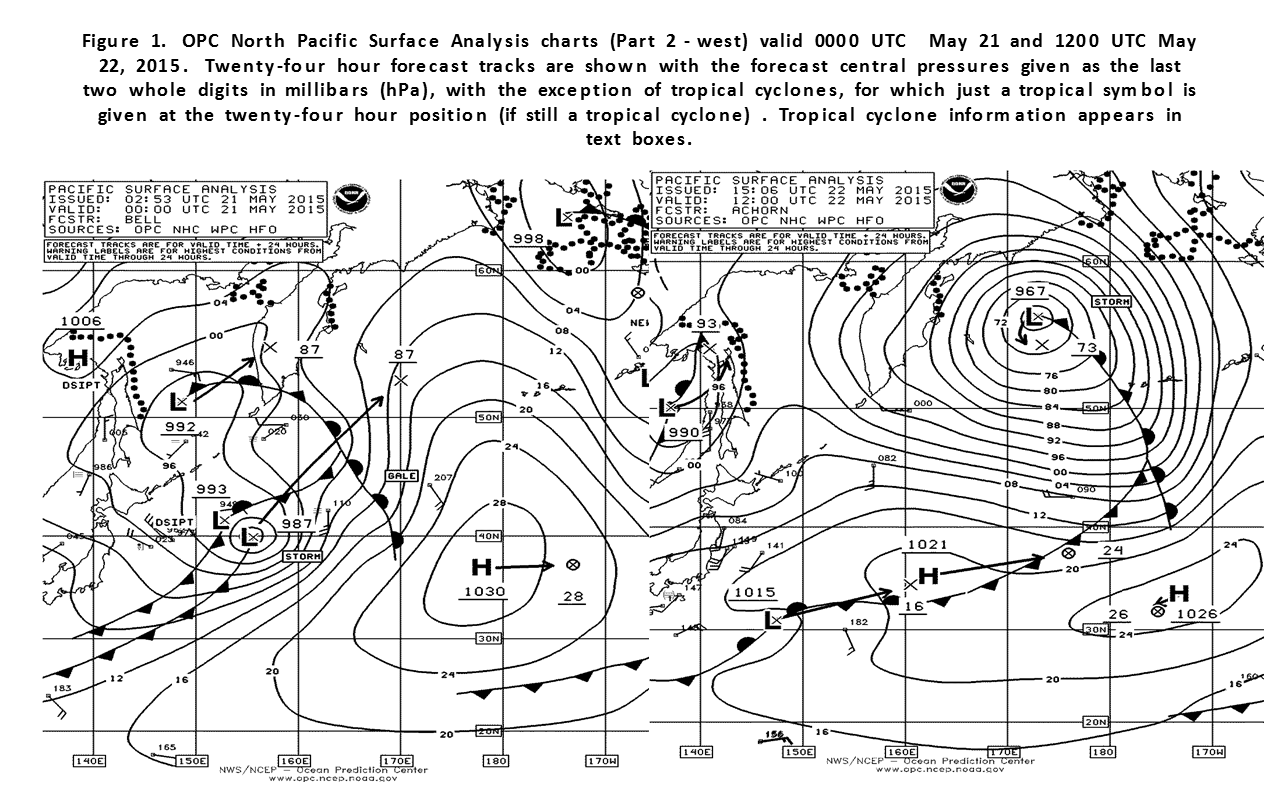
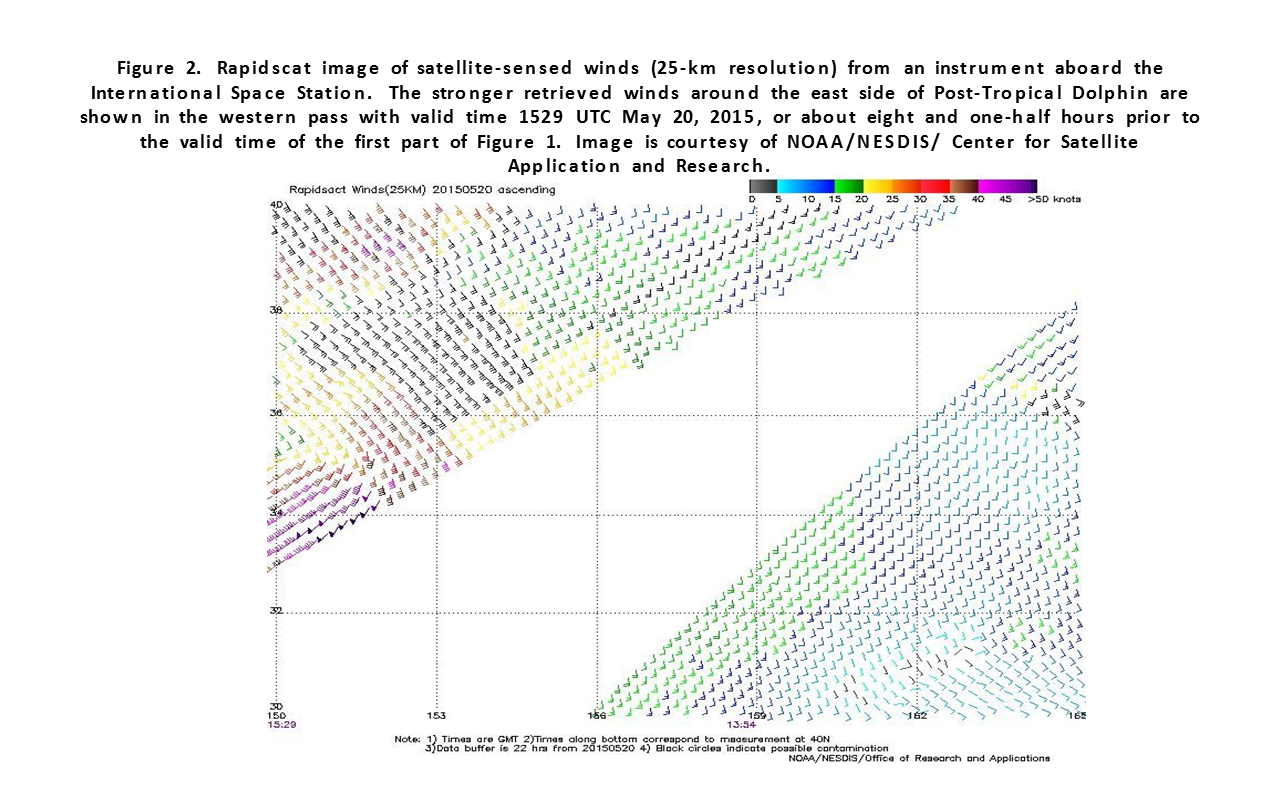
Super-Typhoon Dolphin: Dolphin moved into OPC's radiofacsimile chart area south of Japan as a super-typhoon (Reference 9) with maximum sustained winds of 140 kts. Dolphin began to weaken on the 17th while drifting north. By the 19th the cyclone weakened to a tropical storm and turned northeast. At 0600 UTC on the 20th Dolphin became a post-tropical storm near 30N 146E. Figure 1 shows Dolphin as a post-tropical storm about to merge with a front to the north and 36 hours later in the western Bering Sea with its lowest central pressure. Figure 2 is a Rapidscat image of east side of Post-tropical Dolphin showing winds to 50 kts. The HANJIN AMI (VRNF8) reported west winds of 50 kts near 49N 171E at 1000 UTC on May 22. The cyclone then weakened while drifting east and dissipated late on the 24th.
Typhoon Chan-Hom: Chan-Hom moved northwest into OPC's oceanic chart area crossing 17N near 140E as a
tropical storm at 0600 UTC July 6th, became a typhoon six hours later and then passed west of 136E as a typhoon with sustained winds of 80 kts early on the 7th.
Super-Typhoon Nangka: Nangka was already a major typhoon when moving northwest and crossing 16N 149E early on July 8th with sustained winds of 115 kts or Category 4 on the Saffir-Simpson scale (Reference 5). It briefly strengthened to a super typhoon at 1800 UTC on the 9th with sustained winds 135 kts. A weakening trend set in later that day as the cyclone drifted west. The typhoon then drifted north near 136E late on the 13th with a slow weakening trend, before turning northwest and passing west of the area late on the 15th. Its sustained winds were down to 75 kts at that time. Nangka re-emerged in the Sea of Japan as a tropical depression early on the 18th and became a remnant low near northern Japan later that day.
Typhoon Halola: Halola came from the Central Pacific Hurricane Center warning area, crossing 180W by July 12th and then becoming a typhoon near 18N 167E at 1800 UTC on the 15th with sustained winds of 75 kts. Halola weakened to a 35 kts tropical storm two days later before strengthening again by the 23rd while passing west of the area.
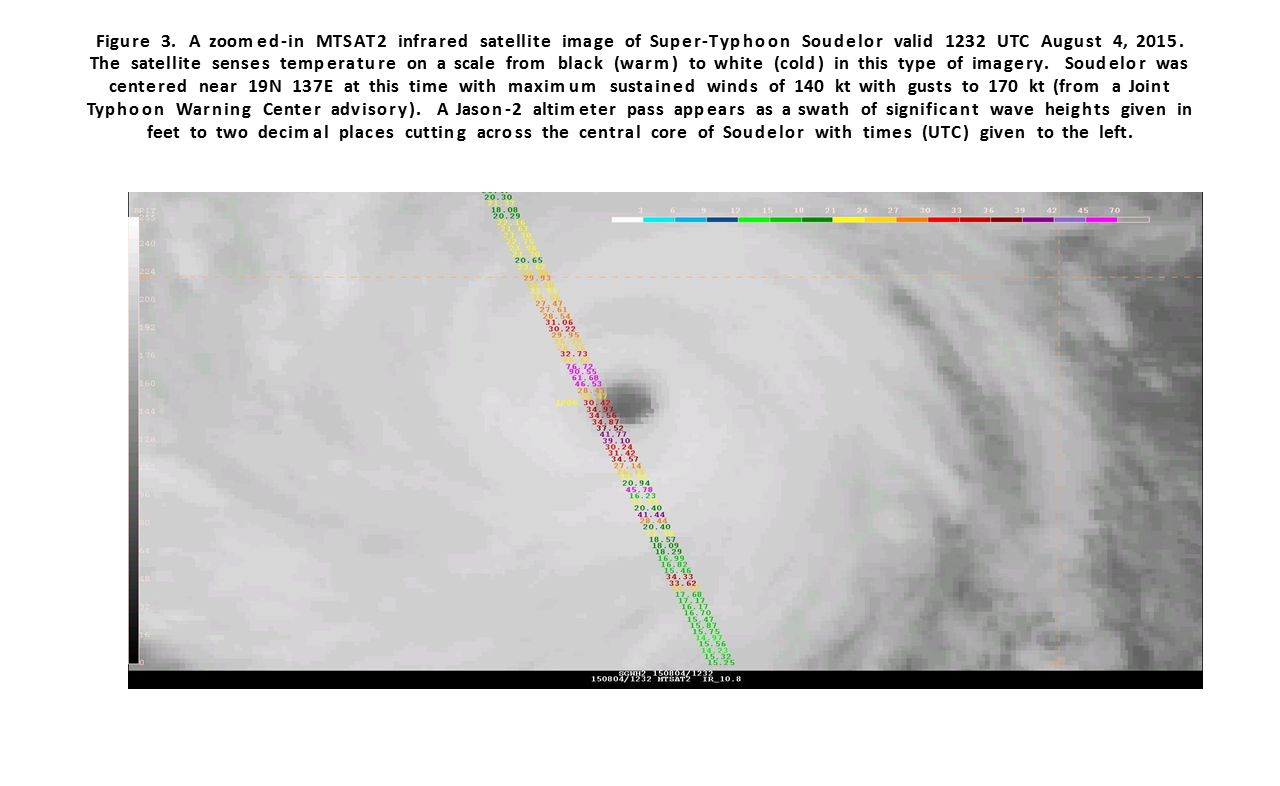
Super-Typhoon Soudelor: Soudelor was a strengthening typhoon while tracking northwest and crossing near 16N 144E at 0000 UTC August 3rd with sustained winds of 115 kts. It became a super-typhoon 12 hours later and after another six hours reached maximum intensity with sustained winds of 155 kts. At 1200 UTC on the 4th Soudelor was a super typhoon near 19N 137E with sustained winds 140 kts. Figure 3 is a close up infrared satellite view of Soudelor and it is just a coincidence that we have a Jason-2 altimeter pass through the eye wall of Soudelor. Note the highest significant wave height of 90.55 ft in the northwest eye wall. This is the highest satellite detected wave height that the author is aware of. Later on the 4th Soudelor passed west of the area with a weakening trend.
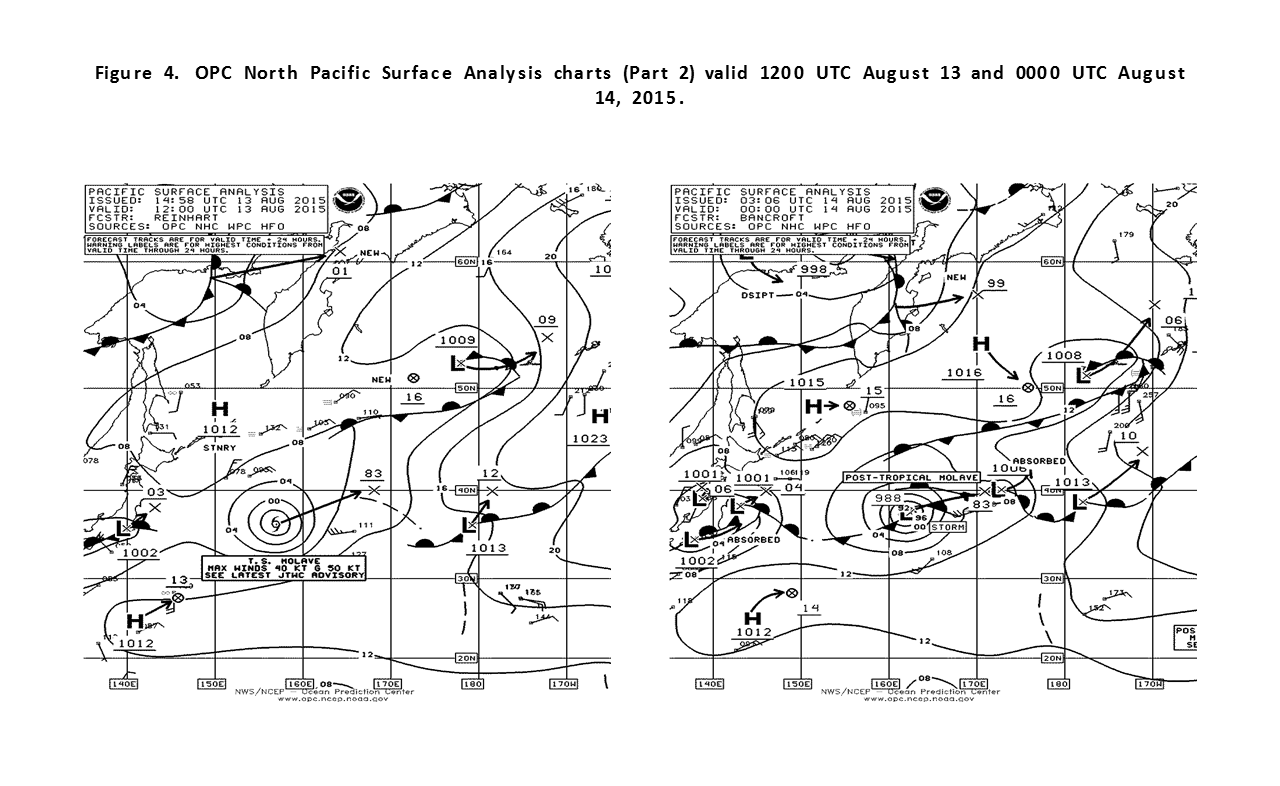
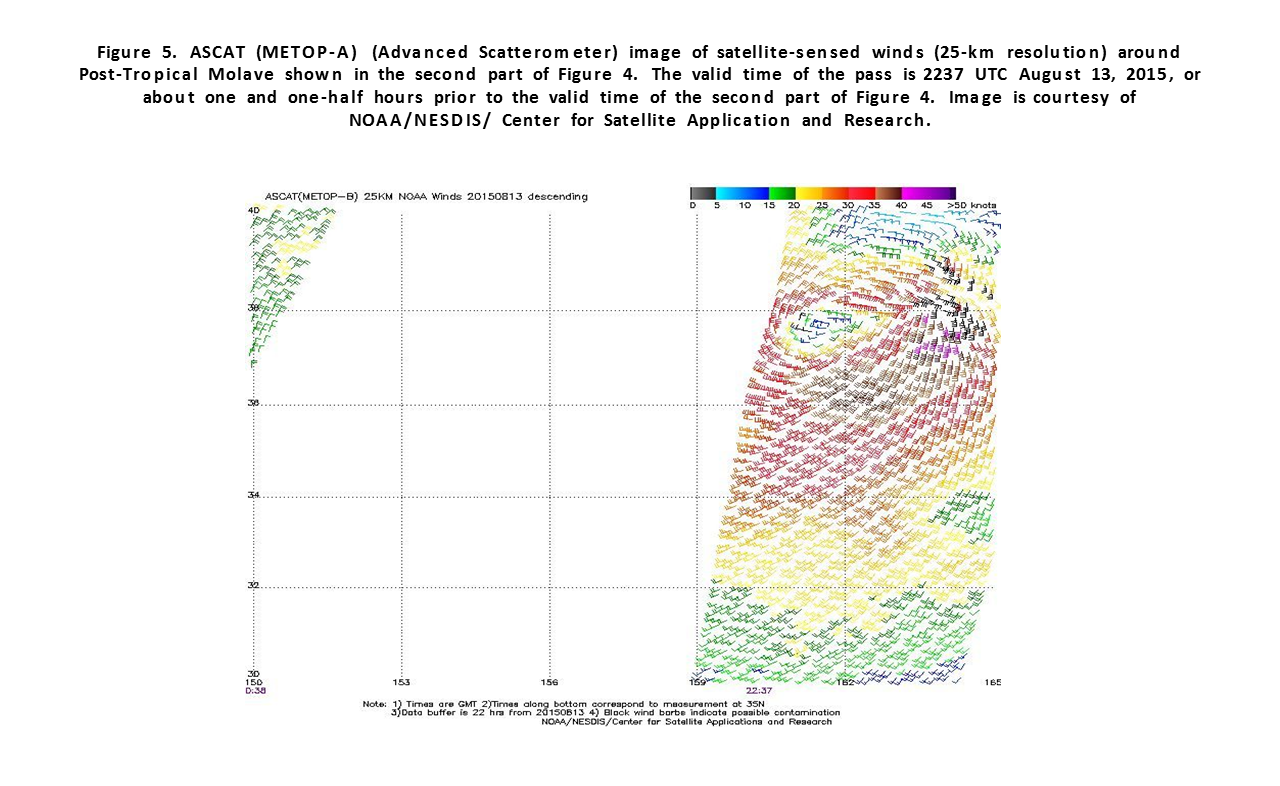
Tropical Storm Molave: Tropical depression 15W formed near 21N 148E at 0000 UTC August 7th and moved northwest, briefly becoming tropical storm Molave early on the 8th and then becoming downgraded to a post-tropical gale on the 9th. Molave was reclassified as a tropical storm 0600 UTC on the 11th with sustained winds of 45 kts, near 32N 144E. The cyclone passed near 35N 154E with sustained winds of 50 kts at 0000 UTC on the 13th before weakening. Figure 4 depicts Molave becoming post-tropical while developing frontal structure. The FRANKFURT EXPRESS (DGZS2) reported southwest winds of 40 kts near 33N 160E at 1800 UTC on the 12th. The ASCAT-B image in Figure 5 shows winds around Molave about at post-tropical transition. The cyclone then tracked east and then northeast into the Gulf of Alaska on the 21st.
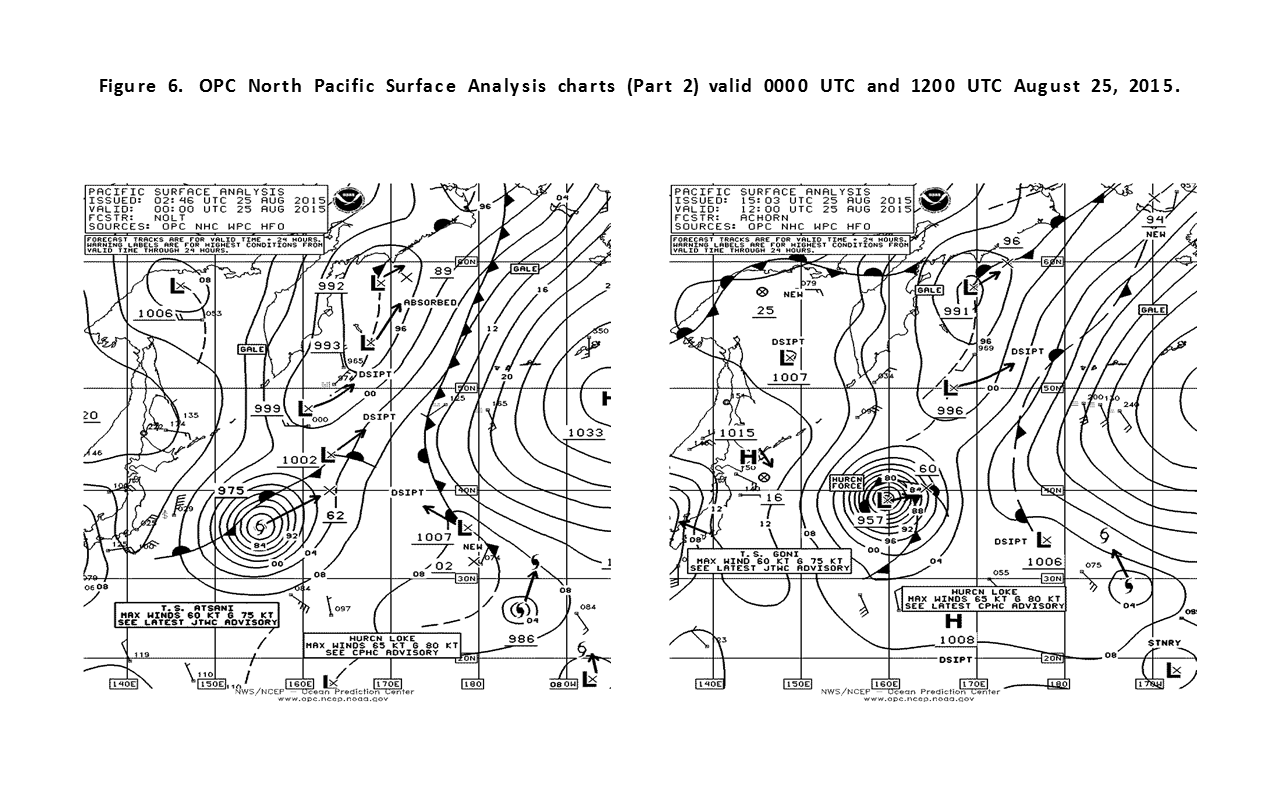
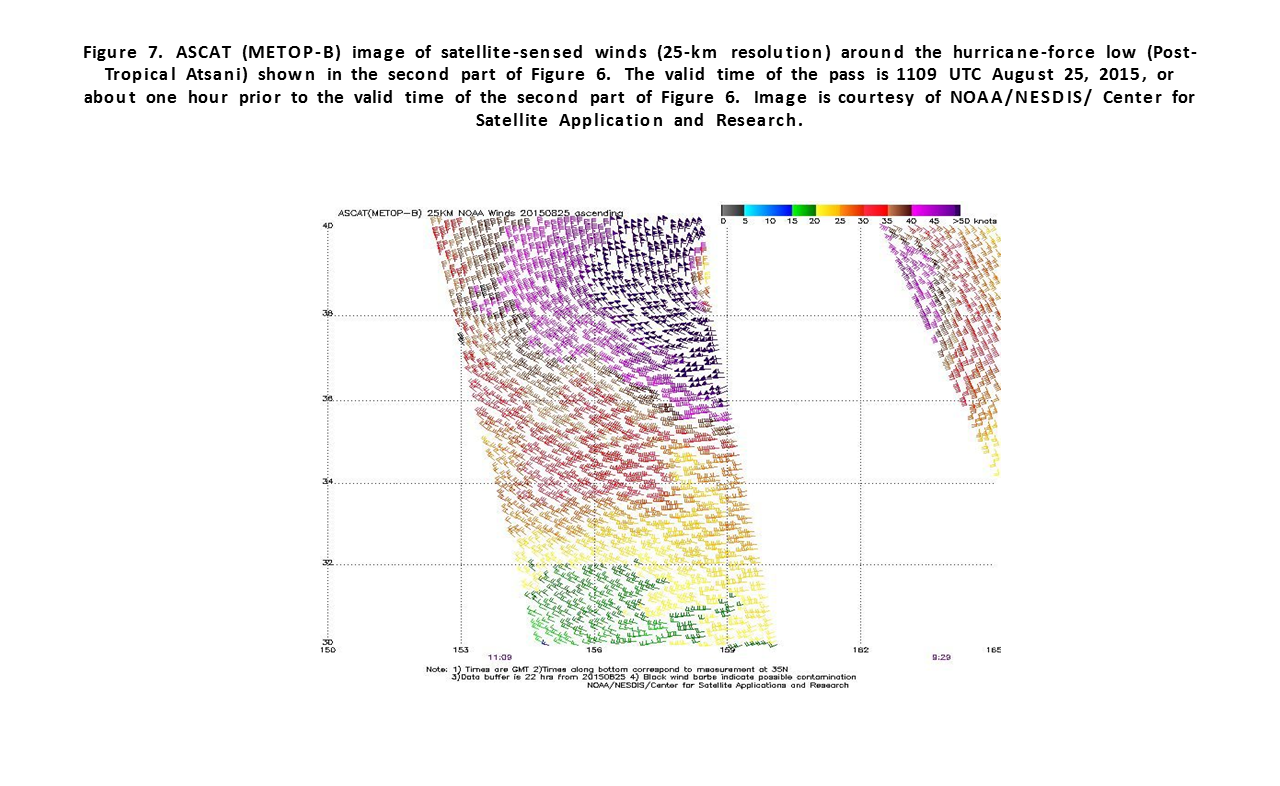
Super-Typhoon Atsani: Typhoon Atsani moved northwest into OPC's radiofacsimile chart area at 17N 156E at 0600 UTC August 18th with sustained winds of 115 kts. Atsani became a super typhoon 24 hours later with sustained winds of 130 kts. Peak intensity came 6 hours later when sustained winds were 140 kts, near 20N 151E. Atsani then began to weaken and beginning on the 21st turned northward and then late on the 23rd northeast. The cyclone became a strong tropical storm early on the 24th just before extratropical transition near 33N 151E with sustained winds of 60 kts. Figure 6 depicts Atsani making a rapid post-tropical transition and re-intensification as an intense hurricane force low within 12 hours. The ASCAT-B image in Figure 7 includes some 65 kts winds. The EXCEL (ONAI) near 45N 159E reported northeast winds of 60 kts and 12.8 m seas (42 ft) at 0600 UTC on the 27th. The cyclone maintained hurricane force winds until 0000 UTC on the 26th. The cyclone stalled and weakened near 40N 165E until the 28th when it moved north and became absorbed on the 29th.
Typhoon Goni: Goni formed south of the area and moved northwest, passing near 17N 140E 0600 UTC on August 17th as an intensifying typhoon. The peak intensity was 115 kts for sustained winds 1800 UTC on the 17th. Goni passed west of 136E shortly thereafter.
Hurricane Loke: Another Central Pacific system, Loke was a tropical storm near 19N 179W at 0600 UTC August 23rd and moving north northeast. It became a hurricane before moving into OPC's high seas area north of 30N (Figure 6 ). As Loke reached 31N 174W at 1800 UTC on the 25th it had weakened to a tropical storm with sustained winds of 60 kts. Loke moved northwest and became post-tropical late on the 26th near 39N 180W and became absorbed by Post-Tropical Atsani by the 27th.
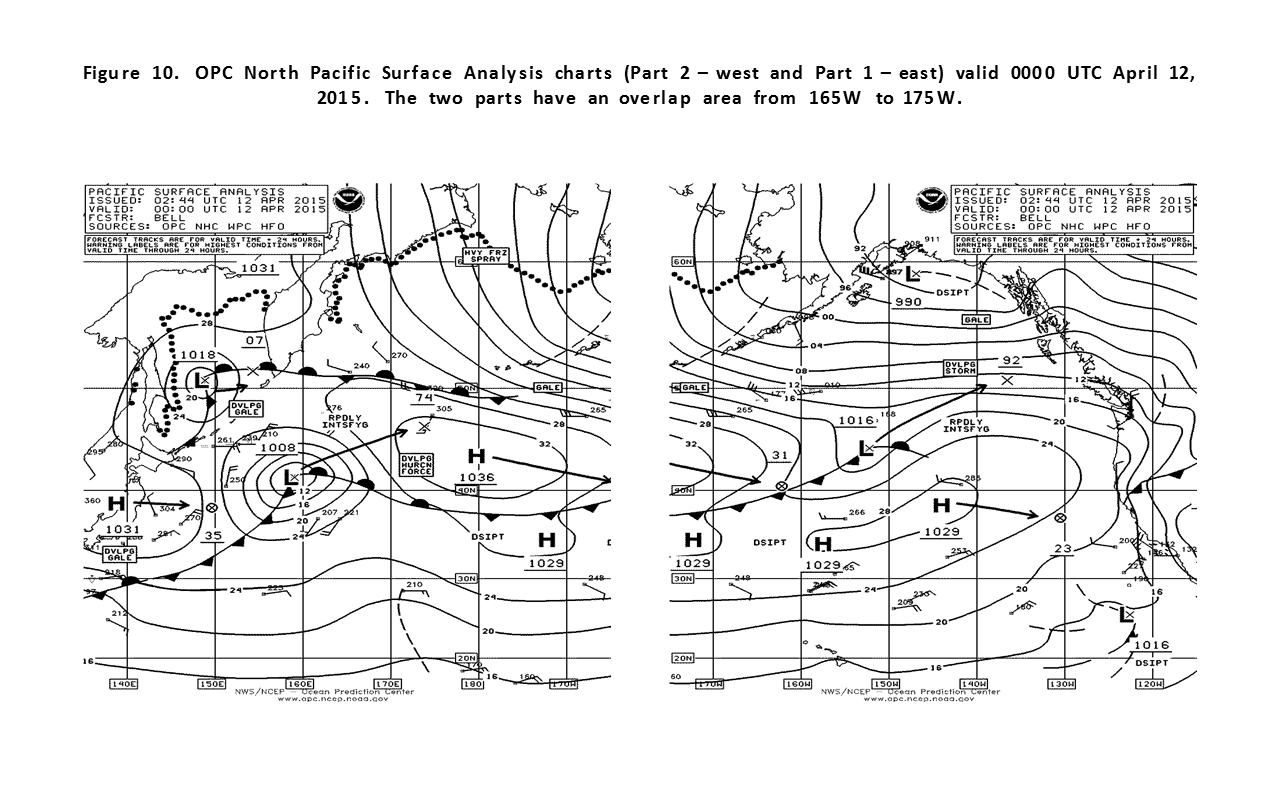
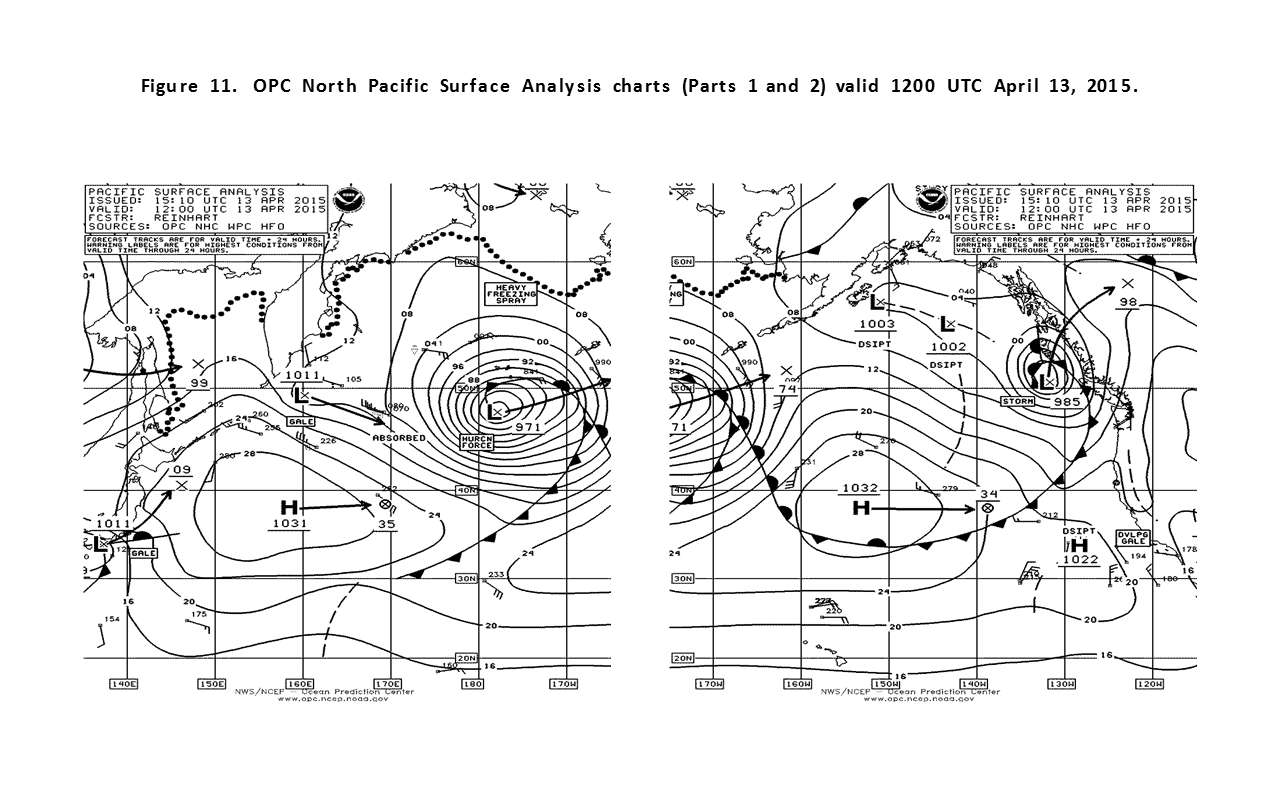
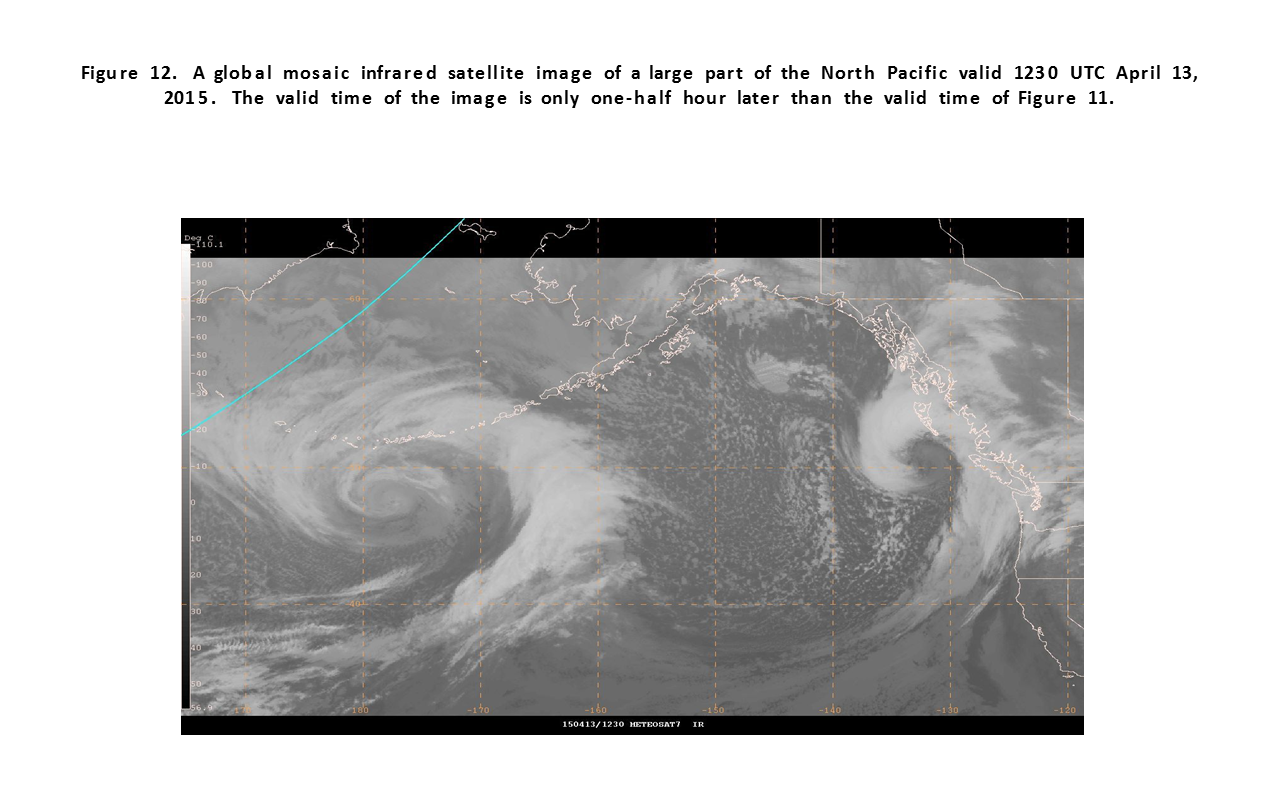
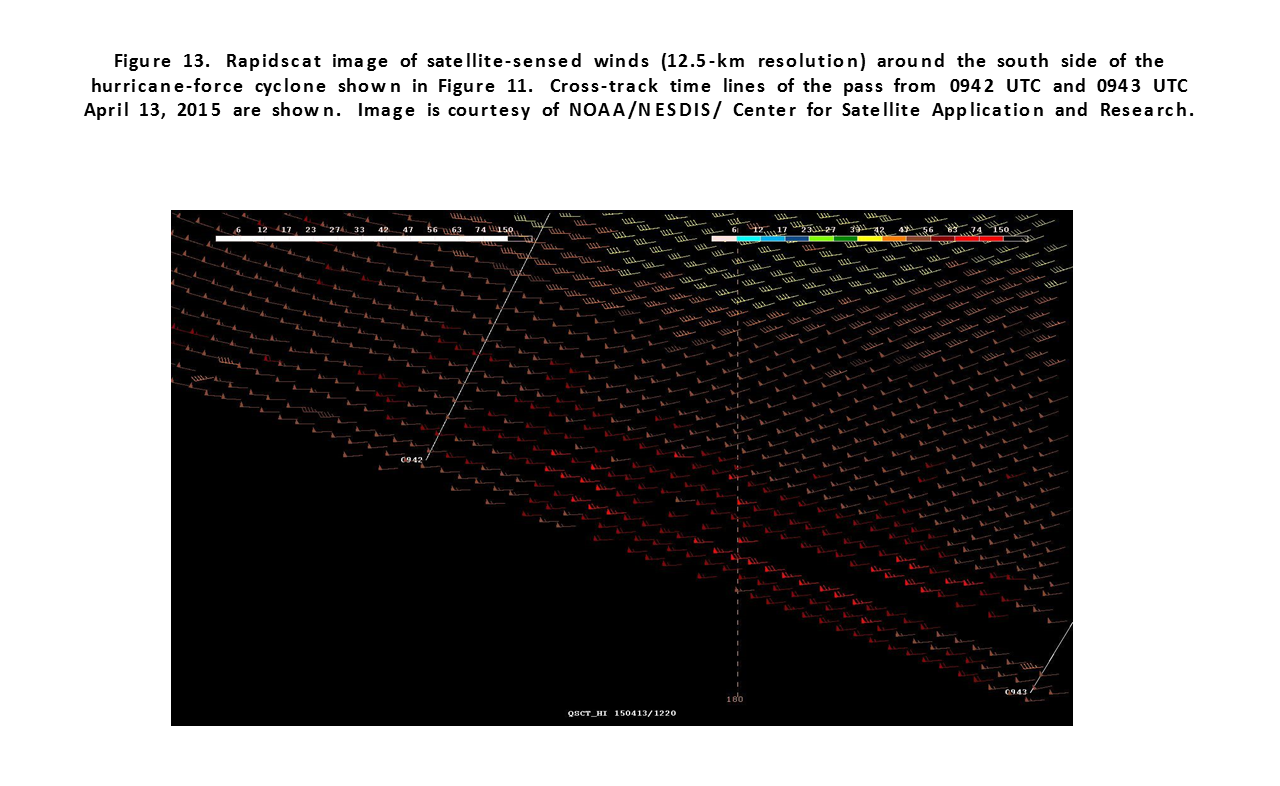
North Pacific Storm, April 11-15: Originating south of Japan early on the 10th, this cyclone developed into a hurricane force low as depicted in Figure 10 and Figure 11. The central pressure fell 33 hPa in the 24 hour period ending at 1800 UTC on the 12th. The infrared satellite image in Figure 12 is impressive revealing a fully mature cyclone and a well-defined center. The Rapidscat image in Figure 13 shows numerous winds in the 50 to 70 kts range south of the cyclone's center. In the absence of ship reports, altimeter passes showing remotely sensed wave heights reveal seas to 40 ft (12.2 m) near the center of the image. The CMA CGM VELA (DFUM) near 50N 165W encountered southeast winds of 50 kts and 6.0 m seas (20 ft). The cyclone then moved northeast and weakened on the 14th and 15th and then moved into southern Alaska on the 16th.
Eastern Pacific Storm, April 12-13: This cyclone developed from a central Pacific wave as shown in Figure 10 and Figure 11. The central pressure fell 26 hPa in the 24 hour period ending at 1200 UTC on the 13th. The satellite image is impressive (Figure 12) with well defined fronts with cold tops. The buoy 46185 (52.4N 129.8W) reported southeast winds of 43 kts with gusts to 58 kts and 6.5 m seas (21 ft) at 1400 UTC on the 13th and highest seas 9.0 m (30 ft). The cyclone moved inland late on the 13th. The second part of Figure 11 shows the cyclone at maximum intensity. An ASCAT (METOP-A) pass from 1053 UTC on the 19th revealed winds to 50 kts southeast of the center of a compact circulation. The BUDAPEST EXPRESS (DGWE2) reported south winds of 45 kts near 42N 162E at 2100 UTC on the 18th. The EVER SAFETY (3EMQ4) encountered west winds of 35 kts and 9.0 m seas (30 ft) near 46N 162E at 0600 UTC on the 20th. The system subsequently weakened as it moved into the western Bering Sea, where it stalled and dissipated on the 23rd.
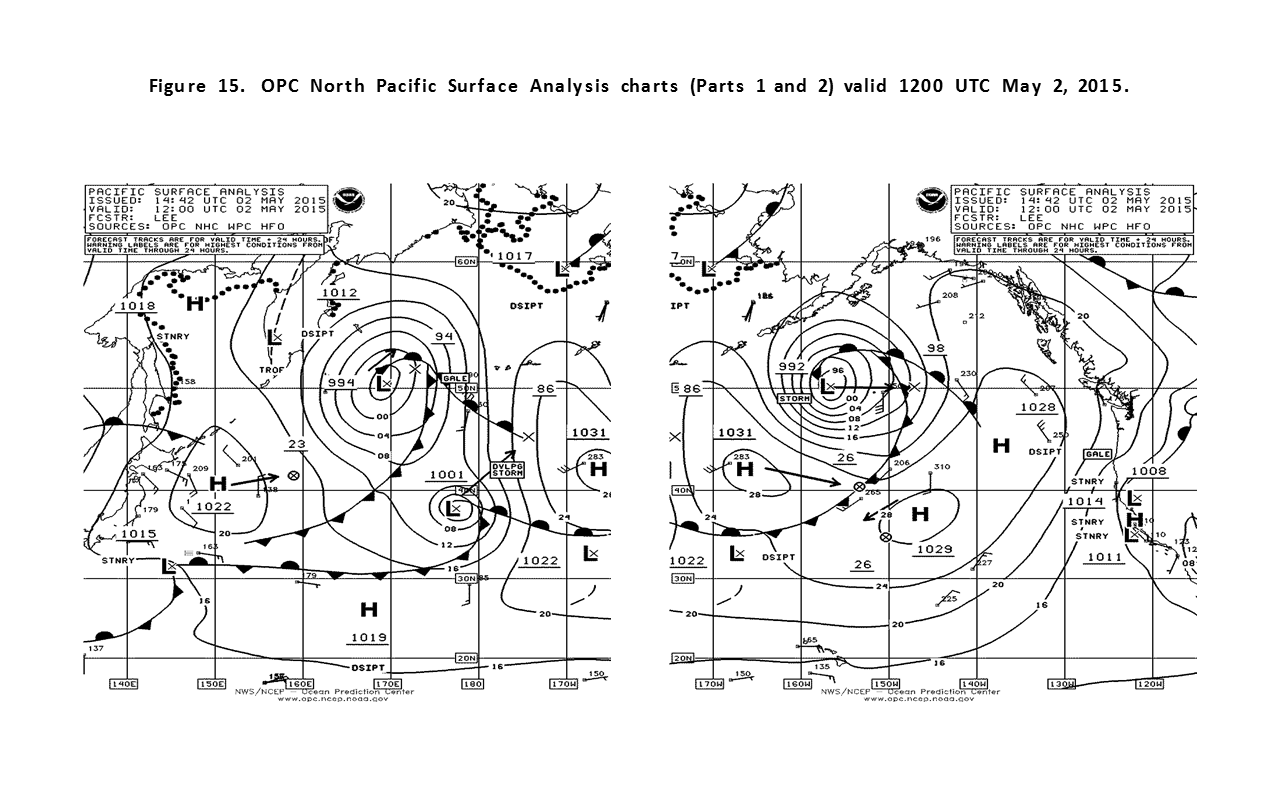
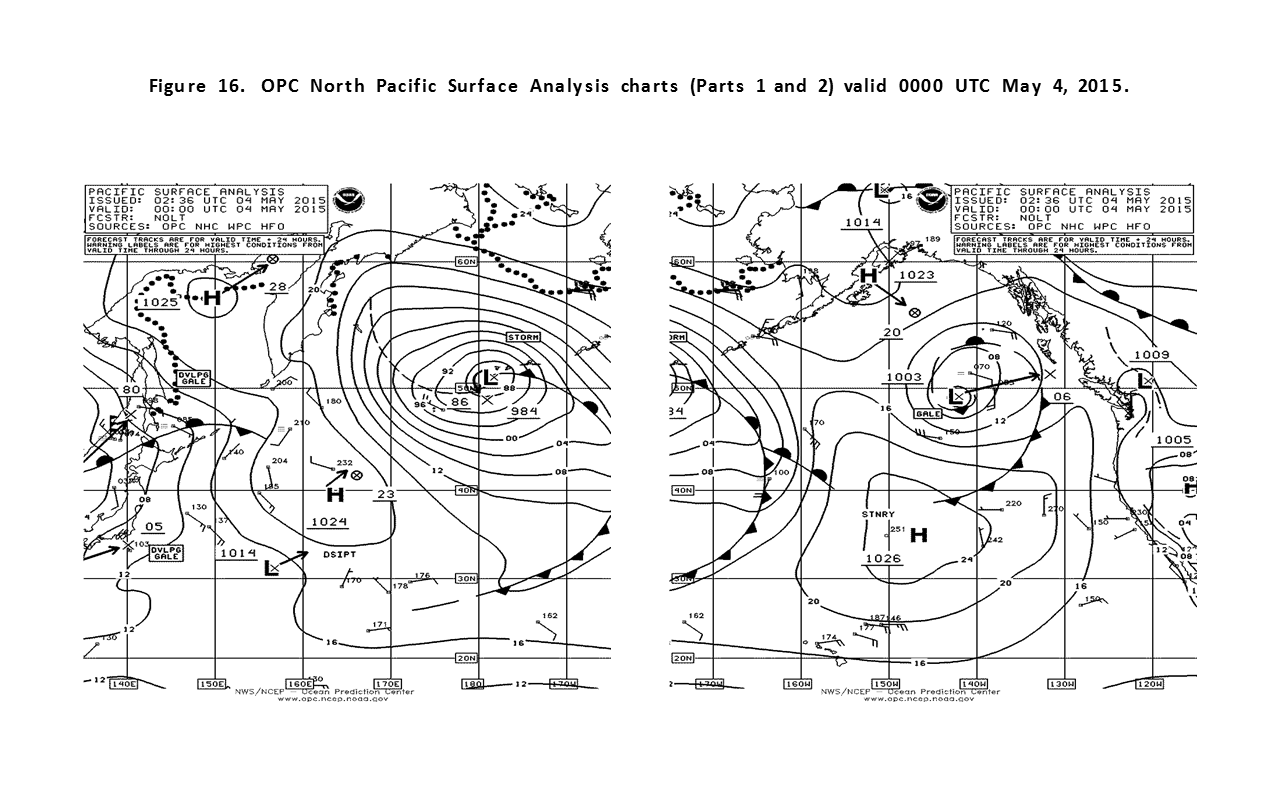
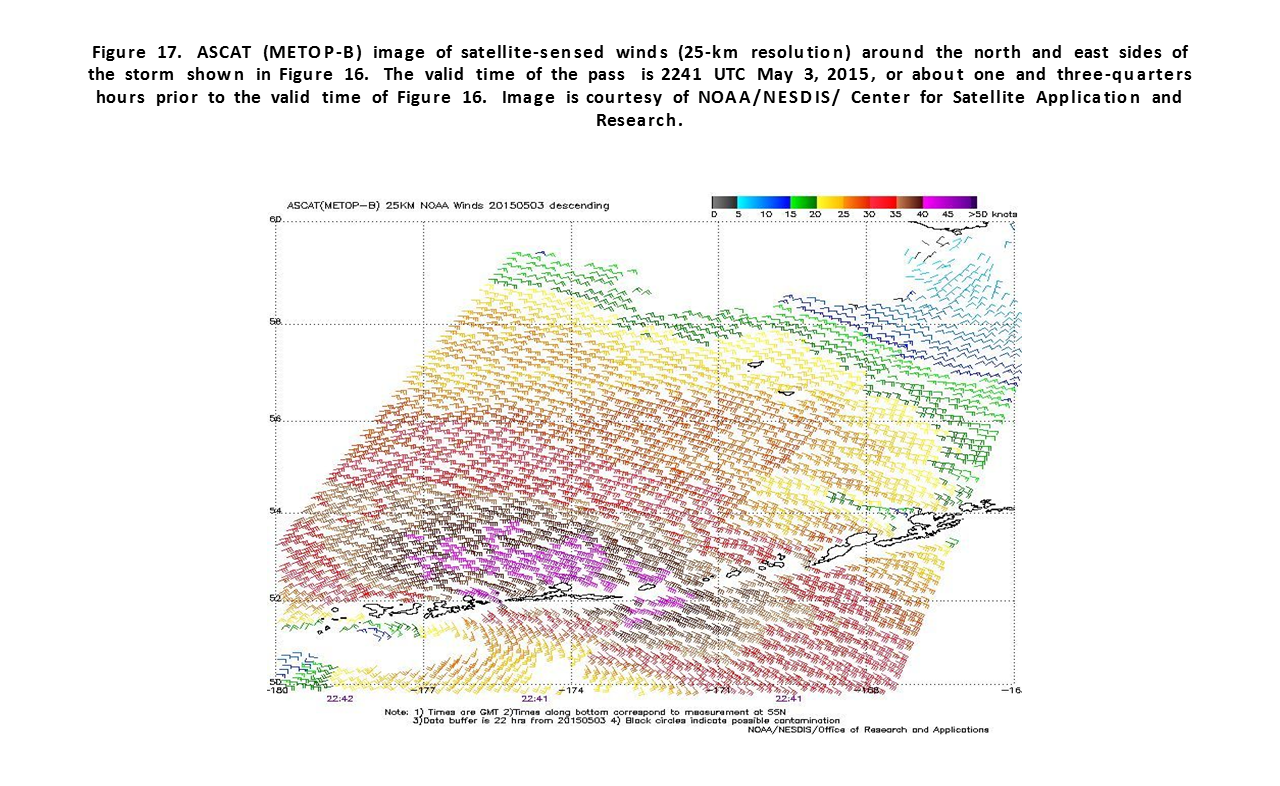
North Pacific Storms, May 2-4: The development of the stronger central Aleutians low is depicted in Figure 15 and Figure 16. The central Aleutians storm in Figure 16 formed from the merging of the developing storm to the south and the gale near the western Aleutians. The central pressure of the combined low dropped to as low as 981 hPa at 0600 UTC on the 4th. The ASCAT-B image (Figure 17) for the western storm reveals some 45 kts wind retrievals near the central Aleutians. The eastern cyclone, near maximum intensity in Figure 15, originated near 36N 170E early on April 29th. The APL CHINA (WDB3161) near 49N 159W reported northwest winds of 45 kts and 8.5 m seas (28 ft). The western system drifted east late on the 4th with a weakening trend, while the eastern cyclone dissipated.
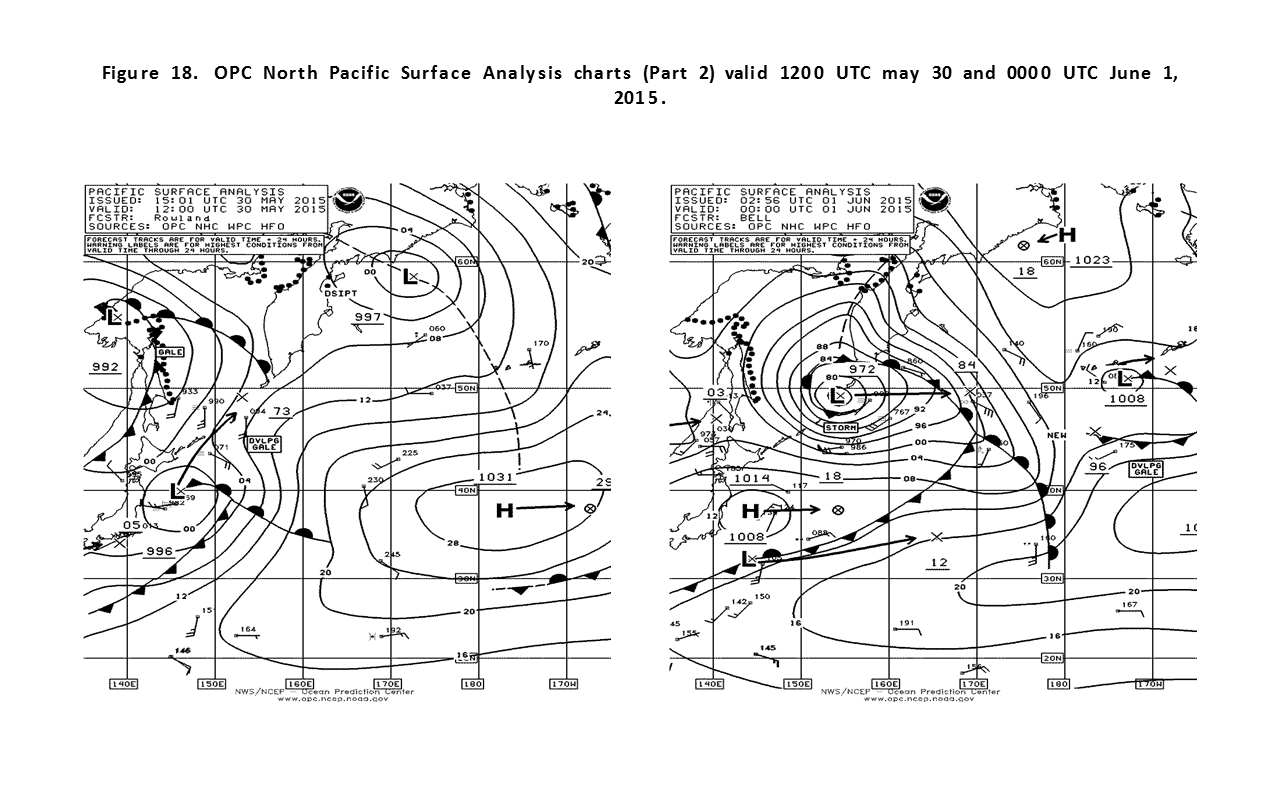
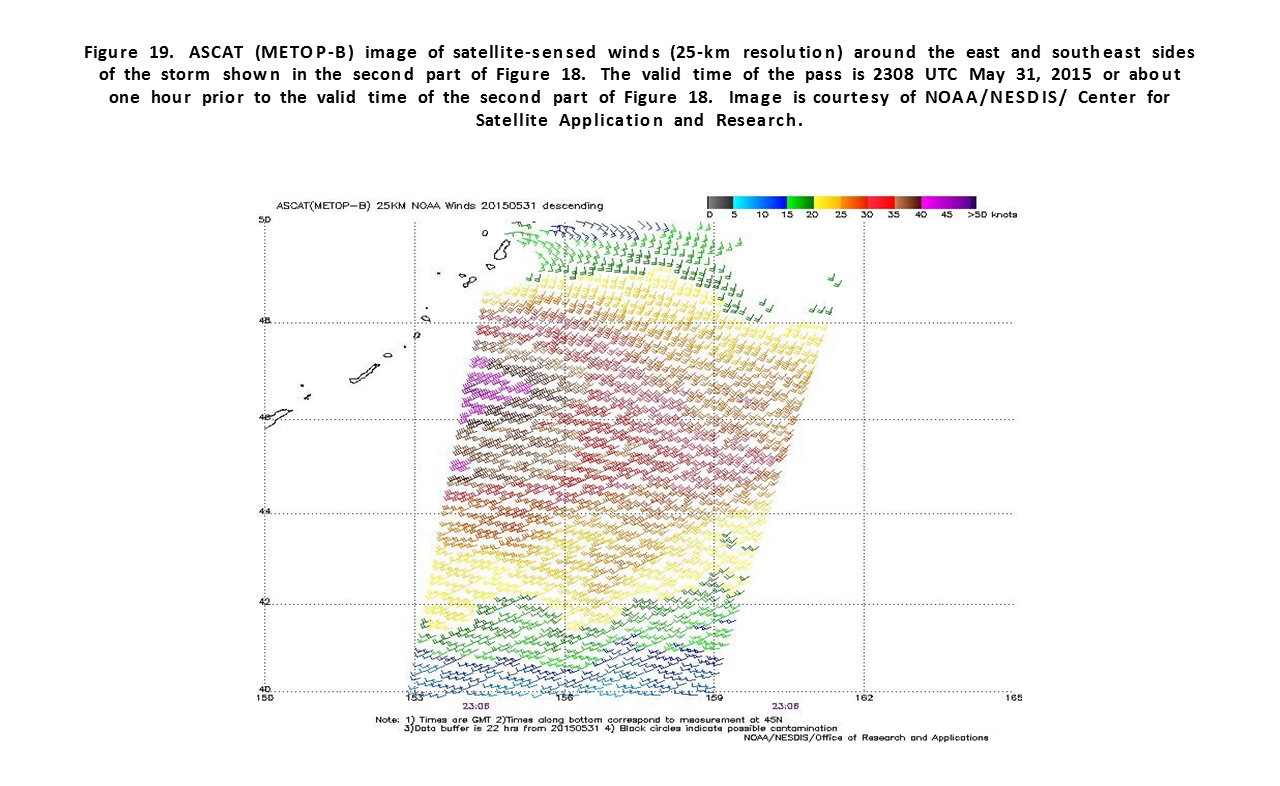
Northwestern Pacific Storm, May 30-June 1: Low pressure originating south of Japan May 28th moved northeast and developed storm force winds near the Kurile Islands late on the 31st (Figure 18). The lowest central pressure was 971 hPa on May 18th, making it one of the deepest lows of the period without tropical origin.The ASCAT-B image in Figure 19 returned some 45 kts winds, but the second part of Figure 18 does show a plotted 50 kts ship report. The cyclone subsequently turned east along 49N on the 2nd and then southeast and dissipated by the 6th.
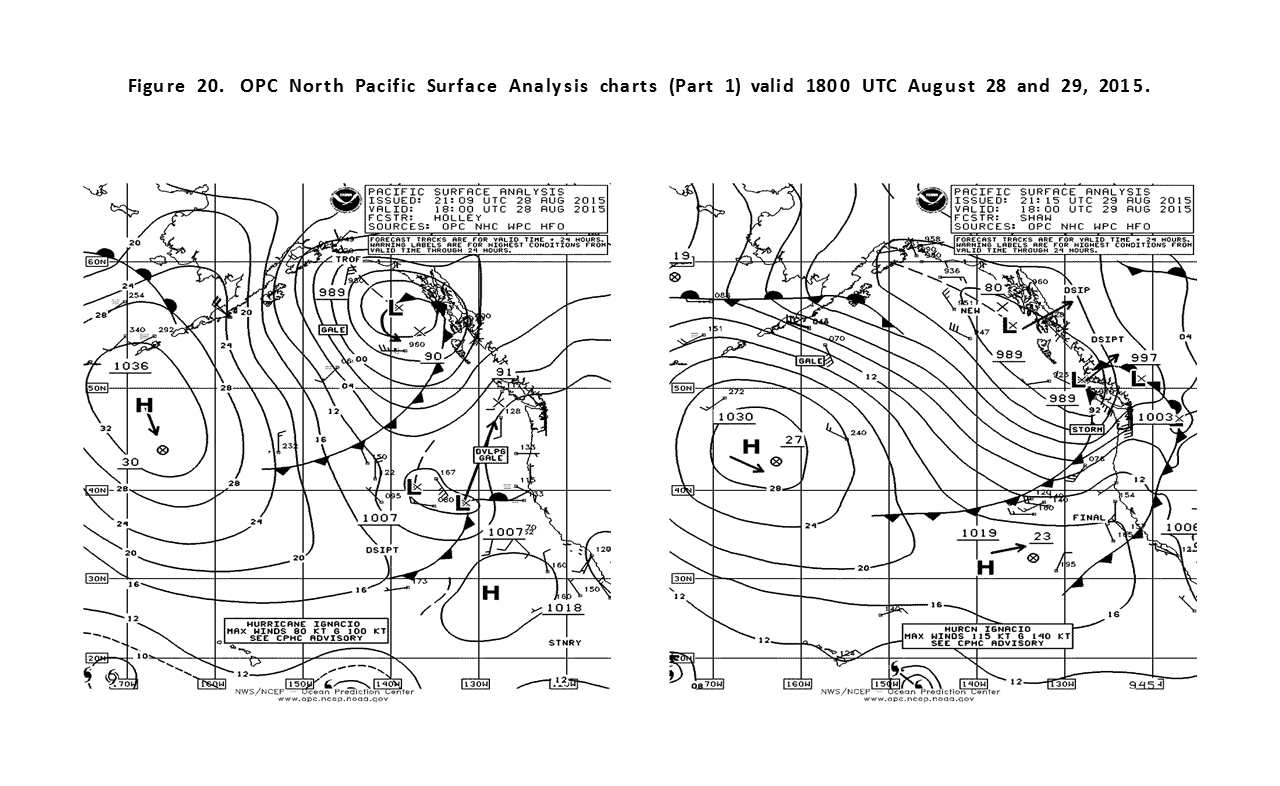
Eastern North Pacific Storm, August 28-29: A short lived storm in late August affected mainly coastal waters of the Pacific Northwest (Figure 20). Destruction Island C/MAN 47.7N 124.4W reported southeast winds of 69 kts with gusts to 76 kts with a peak gust 78 kts at 1800 UTC on the 29th. Buoy 46041 near 47.4N 124.7W at 1700 UTC on the 29th reported south winds of 43 kts with gusts to 54 kts with peak gusts 56 kts and maximum seas 6.0 m (20 ft) one hour later. The next significant event was a stronger development originating over southern Japan late on December 3rd and moving northeast. Figure 20 depicts the final 24 hours of development leading to a lowest central pressure of 956 hPa. The pressure fell 42 hPa in the twenty-four hour period ending at 1200 UTC on the 5th. Figure 21 shows a large area of ASCAT winds of 50 to 60 kts with good support for classifying this as a hurricane force low. The EVER DIAMOND (3FQS8) near 35N 157E reported southwest winds of 40 kts and 8.5 m seas (28 ft). The cyclone then moved east with some weakening but maintaining storm force winds until becoming absorbed by a new development to the east on the 7th.
References
1. Sanders, Frederick and Gyakum, John R., Synoptic-Dynamic Climatology of the "Bomb", Monthly Weather Review, October 1980.
2. Ocean Surface Winds, http://manati.star.nesdis.noaa.gov/products.php
3. VonAhn, Joan. and Sienkiewicz, Joe, "Hurricane Force Extratropical Cyclones Observed Using QuikSCAT Near Real Time Winds", Mariners Weather Log, Vol. 49, No. 1, April 2005.
4. Bancroft, George, "Marine Weather Summary, North Pacific Area, September 2014 to February 2015", Mariners Weather Log, December 2015.
5. Saffir-Simpson Scale of Hurricane Intensity: http://www.nhc.noaa.gov/aboutsshws.php
6. Tropical Cyclone Reports, 2015, National Hurricane Center, http://www.nhc.noaa.gov/data/tcr/index.php?season=2015&basin=atl
7. Monthly Atlantic Tropical Weather Summary, http://www.nhc.noaa.gov/text/MIATWSAT.shtml
8. Central Pacific Tropical Weather Summary, http://www.prh.noaa.gov/cphc/summaries/
9. Frequently Asked Questions, http://www.usno.navy.mil/JTWC/
Back to top
The tropics were relatively active with ten tropical systems including two coming from the Central Pacific. These two systems became strong post-tropical cyclones (Dolphin and Atsani).
Tropical Activity
Typhoon Noul: Noul was a typhoon west of OPC's radiofacsimile chart area which weakened to a tropical storm before merging with a front south of Japan and becoming post-tropical late on May 11. Post-tropical Noul then then moved out over the North Pacific as a gale which developed a 983 hPa central pressure near the western Aleutians on the 15th before dissipating over the northern Bering Sea on the 18th.Super-Typhoon Dolphin: Dolphin moved into OPC's radiofacsimile chart area south of Japan as a super-typhoon (Reference 9) with maximum sustained winds of 140 kts. Dolphin began to weaken on the 17th while drifting north. By the 19th the cyclone weakened to a tropical storm and turned northeast. At 0600 UTC on the 20th Dolphin became a post-tropical storm near 30N 146E. Figure 1 shows Dolphin as a post-tropical storm about to merge with a front to the north and 36 hours later in the western Bering Sea with its lowest central pressure. Figure 2 is a Rapidscat image of east side of Post-tropical Dolphin showing winds to 50 kts. The HANJIN AMI (VRNF8) reported west winds of 50 kts near 49N 171E at 1000 UTC on May 22. The cyclone then weakened while drifting east and dissipated late on the 24th.
Typhoon Chan-Hom: Chan-Hom moved northwest into OPC's oceanic chart area crossing 17N near 140E as a
tropical storm at 0600 UTC July 6th, became a typhoon six hours later and then passed west of 136E as a typhoon with sustained winds of 80 kts early on the 7th.
Super-Typhoon Nangka: Nangka was already a major typhoon when moving northwest and crossing 16N 149E early on July 8th with sustained winds of 115 kts or Category 4 on the Saffir-Simpson scale (Reference 5). It briefly strengthened to a super typhoon at 1800 UTC on the 9th with sustained winds 135 kts. A weakening trend set in later that day as the cyclone drifted west. The typhoon then drifted north near 136E late on the 13th with a slow weakening trend, before turning northwest and passing west of the area late on the 15th. Its sustained winds were down to 75 kts at that time. Nangka re-emerged in the Sea of Japan as a tropical depression early on the 18th and became a remnant low near northern Japan later that day.
Typhoon Halola: Halola came from the Central Pacific Hurricane Center warning area, crossing 180W by July 12th and then becoming a typhoon near 18N 167E at 1800 UTC on the 15th with sustained winds of 75 kts. Halola weakened to a 35 kts tropical storm two days later before strengthening again by the 23rd while passing west of the area.
Super-Typhoon Soudelor: Soudelor was a strengthening typhoon while tracking northwest and crossing near 16N 144E at 0000 UTC August 3rd with sustained winds of 115 kts. It became a super-typhoon 12 hours later and after another six hours reached maximum intensity with sustained winds of 155 kts. At 1200 UTC on the 4th Soudelor was a super typhoon near 19N 137E with sustained winds 140 kts. Figure 3 is a close up infrared satellite view of Soudelor and it is just a coincidence that we have a Jason-2 altimeter pass through the eye wall of Soudelor. Note the highest significant wave height of 90.55 ft in the northwest eye wall. This is the highest satellite detected wave height that the author is aware of. Later on the 4th Soudelor passed west of the area with a weakening trend.
Tropical Storm Molave: Tropical depression 15W formed near 21N 148E at 0000 UTC August 7th and moved northwest, briefly becoming tropical storm Molave early on the 8th and then becoming downgraded to a post-tropical gale on the 9th. Molave was reclassified as a tropical storm 0600 UTC on the 11th with sustained winds of 45 kts, near 32N 144E. The cyclone passed near 35N 154E with sustained winds of 50 kts at 0000 UTC on the 13th before weakening. Figure 4 depicts Molave becoming post-tropical while developing frontal structure. The FRANKFURT EXPRESS (DGZS2) reported southwest winds of 40 kts near 33N 160E at 1800 UTC on the 12th. The ASCAT-B image in Figure 5 shows winds around Molave about at post-tropical transition. The cyclone then tracked east and then northeast into the Gulf of Alaska on the 21st.
Super-Typhoon Atsani: Typhoon Atsani moved northwest into OPC's radiofacsimile chart area at 17N 156E at 0600 UTC August 18th with sustained winds of 115 kts. Atsani became a super typhoon 24 hours later with sustained winds of 130 kts. Peak intensity came 6 hours later when sustained winds were 140 kts, near 20N 151E. Atsani then began to weaken and beginning on the 21st turned northward and then late on the 23rd northeast. The cyclone became a strong tropical storm early on the 24th just before extratropical transition near 33N 151E with sustained winds of 60 kts. Figure 6 depicts Atsani making a rapid post-tropical transition and re-intensification as an intense hurricane force low within 12 hours. The ASCAT-B image in Figure 7 includes some 65 kts winds. The EXCEL (ONAI) near 45N 159E reported northeast winds of 60 kts and 12.8 m seas (42 ft) at 0600 UTC on the 27th. The cyclone maintained hurricane force winds until 0000 UTC on the 26th. The cyclone stalled and weakened near 40N 165E until the 28th when it moved north and became absorbed on the 29th.
Typhoon Goni: Goni formed south of the area and moved northwest, passing near 17N 140E 0600 UTC on August 17th as an intensifying typhoon. The peak intensity was 115 kts for sustained winds 1800 UTC on the 17th. Goni passed west of 136E shortly thereafter.
Hurricane Loke: Another Central Pacific system, Loke was a tropical storm near 19N 179W at 0600 UTC August 23rd and moving north northeast. It became a hurricane before moving into OPC's high seas area north of 30N (Figure 6 ). As Loke reached 31N 174W at 1800 UTC on the 25th it had weakened to a tropical storm with sustained winds of 60 kts. Loke moved northwest and became post-tropical late on the 26th near 39N 180W and became absorbed by Post-Tropical Atsani by the 27th.
Other Significant Events of the Period
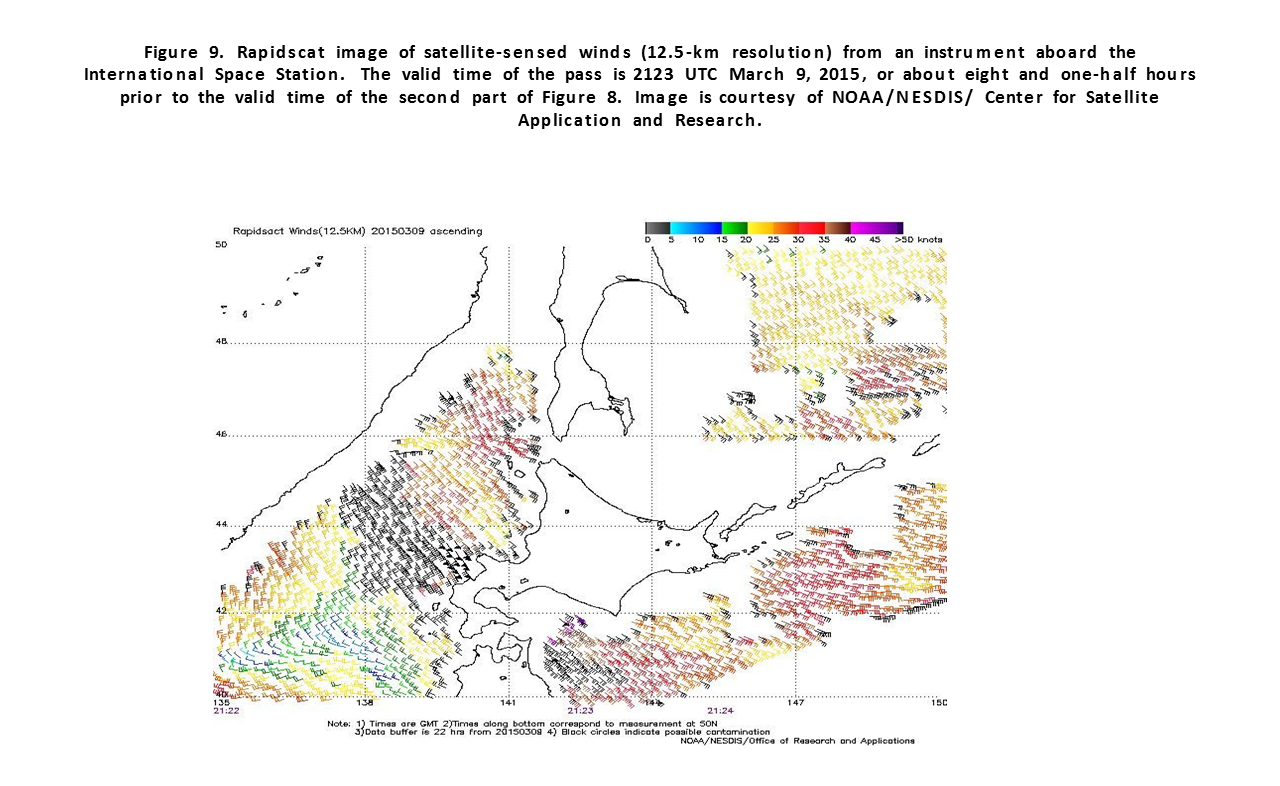
Western North Pacific Storm, March 9-11: A wave of low pressure rapidly intensified while moving north from south of Japan (Figure 8) and became the only hurricane force low in March. The central pressure fell 31 hPa in the 24 hour period ending at 0600 UTC on the 10th. The Rapidscat image in Figure 9 reveals winds as high as 70 kts near northern Japan. The cyclone developed a lowest central pressure of 969 hPa near 45N 141E at 1800 UTC on the 10th. The SHIP VRHM2 (50N 165E) reported southeast winds of 48 kts and 5.8 m seas (19 ft). The cyclone subsequently dissipated near the Kamchatka by the 14th.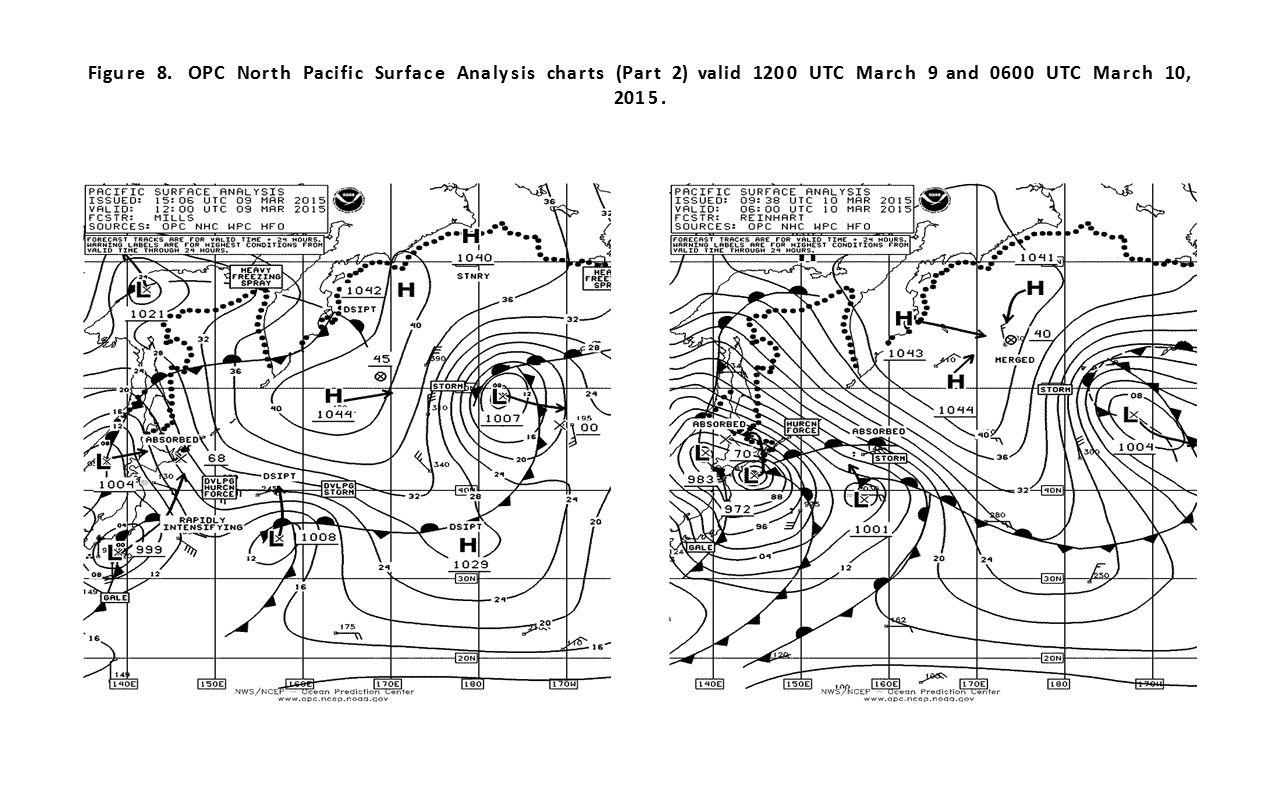
North Pacific Storm, April 11-15: Originating south of Japan early on the 10th, this cyclone developed into a hurricane force low as depicted in Figure 10 and Figure 11. The central pressure fell 33 hPa in the 24 hour period ending at 1800 UTC on the 12th. The infrared satellite image in Figure 12 is impressive revealing a fully mature cyclone and a well-defined center. The Rapidscat image in Figure 13 shows numerous winds in the 50 to 70 kts range south of the cyclone's center. In the absence of ship reports, altimeter passes showing remotely sensed wave heights reveal seas to 40 ft (12.2 m) near the center of the image. The CMA CGM VELA (DFUM) near 50N 165W encountered southeast winds of 50 kts and 6.0 m seas (20 ft). The cyclone then moved northeast and weakened on the 14th and 15th and then moved into southern Alaska on the 16th.
Eastern Pacific Storm, April 12-13: This cyclone developed from a central Pacific wave as shown in Figure 10 and Figure 11. The central pressure fell 26 hPa in the 24 hour period ending at 1200 UTC on the 13th. The satellite image is impressive (Figure 12) with well defined fronts with cold tops. The buoy 46185 (52.4N 129.8W) reported southeast winds of 43 kts with gusts to 58 kts and 6.5 m seas (21 ft) at 1400 UTC on the 13th and highest seas 9.0 m (30 ft). The cyclone moved inland late on the 13th. The second part of Figure 11 shows the cyclone at maximum intensity. An ASCAT (METOP-A) pass from 1053 UTC on the 19th revealed winds to 50 kts southeast of the center of a compact circulation. The BUDAPEST EXPRESS (DGWE2) reported south winds of 45 kts near 42N 162E at 2100 UTC on the 18th. The EVER SAFETY (3EMQ4) encountered west winds of 35 kts and 9.0 m seas (30 ft) near 46N 162E at 0600 UTC on the 20th. The system subsequently weakened as it moved into the western Bering Sea, where it stalled and dissipated on the 23rd.
North Pacific Storms, May 2-4: The development of the stronger central Aleutians low is depicted in Figure 15 and Figure 16. The central Aleutians storm in Figure 16 formed from the merging of the developing storm to the south and the gale near the western Aleutians. The central pressure of the combined low dropped to as low as 981 hPa at 0600 UTC on the 4th. The ASCAT-B image (Figure 17) for the western storm reveals some 45 kts wind retrievals near the central Aleutians. The eastern cyclone, near maximum intensity in Figure 15, originated near 36N 170E early on April 29th. The APL CHINA (WDB3161) near 49N 159W reported northwest winds of 45 kts and 8.5 m seas (28 ft). The western system drifted east late on the 4th with a weakening trend, while the eastern cyclone dissipated.
Northwestern Pacific Storm, May 30-June 1: Low pressure originating south of Japan May 28th moved northeast and developed storm force winds near the Kurile Islands late on the 31st (Figure 18). The lowest central pressure was 971 hPa on May 18th, making it one of the deepest lows of the period without tropical origin.The ASCAT-B image in Figure 19 returned some 45 kts winds, but the second part of Figure 18 does show a plotted 50 kts ship report. The cyclone subsequently turned east along 49N on the 2nd and then southeast and dissipated by the 6th.
Eastern North Pacific Storm, August 28-29: A short lived storm in late August affected mainly coastal waters of the Pacific Northwest (Figure 20). Destruction Island C/MAN 47.7N 124.4W reported southeast winds of 69 kts with gusts to 76 kts with a peak gust 78 kts at 1800 UTC on the 29th. Buoy 46041 near 47.4N 124.7W at 1700 UTC on the 29th reported south winds of 43 kts with gusts to 54 kts with peak gusts 56 kts and maximum seas 6.0 m (20 ft) one hour later. The next significant event was a stronger development originating over southern Japan late on December 3rd and moving northeast. Figure 20 depicts the final 24 hours of development leading to a lowest central pressure of 956 hPa. The pressure fell 42 hPa in the twenty-four hour period ending at 1200 UTC on the 5th. Figure 21 shows a large area of ASCAT winds of 50 to 60 kts with good support for classifying this as a hurricane force low. The EVER DIAMOND (3FQS8) near 35N 157E reported southwest winds of 40 kts and 8.5 m seas (28 ft). The cyclone then moved east with some weakening but maintaining storm force winds until becoming absorbed by a new development to the east on the 7th.
References
1. Sanders, Frederick and Gyakum, John R., Synoptic-Dynamic Climatology of the "Bomb", Monthly Weather Review, October 1980.
2. Ocean Surface Winds, http://manati.star.nesdis.noaa.gov/products.php
3. VonAhn, Joan. and Sienkiewicz, Joe, "Hurricane Force Extratropical Cyclones Observed Using QuikSCAT Near Real Time Winds", Mariners Weather Log, Vol. 49, No. 1, April 2005.
4. Bancroft, George, "Marine Weather Summary, North Pacific Area, September 2014 to February 2015", Mariners Weather Log, December 2015.
5. Saffir-Simpson Scale of Hurricane Intensity: http://www.nhc.noaa.gov/aboutsshws.php
6. Tropical Cyclone Reports, 2015, National Hurricane Center, http://www.nhc.noaa.gov/data/tcr/index.php?season=2015&basin=atl
7. Monthly Atlantic Tropical Weather Summary, http://www.nhc.noaa.gov/text/MIATWSAT.shtml
8. Central Pacific Tropical Weather Summary, http://www.prh.noaa.gov/cphc/summaries/
9. Frequently Asked Questions, http://www.usno.navy.mil/JTWC/