Marine Weather Review - North Atlantic Area
March to August 2015
George P. Bancroft
Ocean Forecast Branch, Ocean Prediction Center, College Park,
MD
NOAA National Center for Environmental Prediction
Introduction
The late winter to early spring period was very active, espeŁcially in March when a series of strong cyclones developed off the U.S. East Coast and tracked rapidly northeast toward the area east of Greenland to Iceland or the northeastern Atlantic waters, with 10 develŁoping hurricane force winds. As is usually the case the numbers fell off in April when 4 cyclones developed hurricane force winds. In late April and early May the cyclones moved more erratically with some moving into the Davis Strait or stalling in the northern waters and spawnŁing new development farther east. May was active, producing several cyclones with central pressures down into the 970s and storm force winds, but no hurricane force lows. June and July brought a more summerlike pattern with a weaker cyclonic track shifting north; however each produced one hurricane force low over the southern waters. Such events are rare in those months, with July usually the least active month. August featured cyclones moving mainŁly north of 50N with a few develŁoping storm force winds. Overall, except for tropical activŁity, the North Atlantic was more active than the North Pacific throughout this period.In what would turn out to be a below normal North Atlantic hurŁricane season, the season got off to an early start with Ana forming initially as a subtropical storm in OPC's far southwestŁern waters and moving northŁeast along the coast as a tropiŁcal storm before weakening off the Mid-Atlantic coast of the
U.S. and lasting only three days as a tropical cyclone. Another tropical storm, Claudette, formed off the North Carolina coast in mid-July but like Ana was short lived. Other tropical activity during the period occurred south of OPC's area of responsibility (Reference 7).
Tropical Activity
Subtropical Storm / Tropical Storm Ana: Ana began as a non-tropical low near the northern Bahamas early on May 6th and moved north, becoming a gale upon passing near 31N 78W on the morning of the 7th. The cyclone became Subtropical Storm Ana, the first named cyclone of 2015, the following evening near 32N 78W with maximum sustained winds of 40 kts with gusts to 50 kts. Ana then drifted north and became a tropical storm early on the 9th near 32.5N 77.6W with sustained winds up to 50 kts. At 0900 UTC on the 8th the MAERSK MONTANA (WCDP) near 33N 77W reported northŁeast winds of 35 kts. At 0600 UTVC on the 10th the GLEN CANYON BRIDGE (3EFD9) near 32N 78W reportŁed south winds of 40 kts and the INDEPENDENCE II (WGAX) encountered southeast winds of 40 kts at 32N 77W. Buoy 41013 (33.4N 77.7W) reported southŁeast winds of 41 kts with gusts to 52 kts and 4.5 m seas (15 ft) at 0200 UTC on the 10th, a peak gust of 54 kts two hours prior, and highest seas 5.0 m (17 ft) at 0600 UTC on the 9th. The cyclone then moved over eastern North Carolina where it weakened to a depression on the 10th, before moving along the Mid-Atlantic Coast and becoming a post tropical gale late on the 11th. Post tropical Ana then accelerated northeast and became absorbed by another intensifying low moving east of the Canadian Atlantic provinces on the 13th (See Northeastern Atlantic Storm, May 15-16 below).Tropical Storm Claudette: Short lived Tropical Storm Claudette formed off the U.S. Mid-Atlantic Coast near 37N 68W on the afternoon of July 13th with maximum sustained winds of 45 kts and gusts to 55 kts and moved northeast, beginŁning a weakening trend early the next day. The cyclone transitioned to a post tropical gale force low on the evening of the 14th south of Newfoundland near 44N 58E. The VANCOUVER EXPRESS (9HA3490) near 37N 62W reported southwest winds of 35 kts at 0600 UTC on the 15th. Its winds weakened to below gale force while passing north of the island of Newfoundland late on the 15th. It re-intensified to a gale in the Labrador Sea late on the 16th, where it stalled, before drifting southeast and dissipatŁing east of Newfoundland late on the 18th.
Other Significant Events of the Period
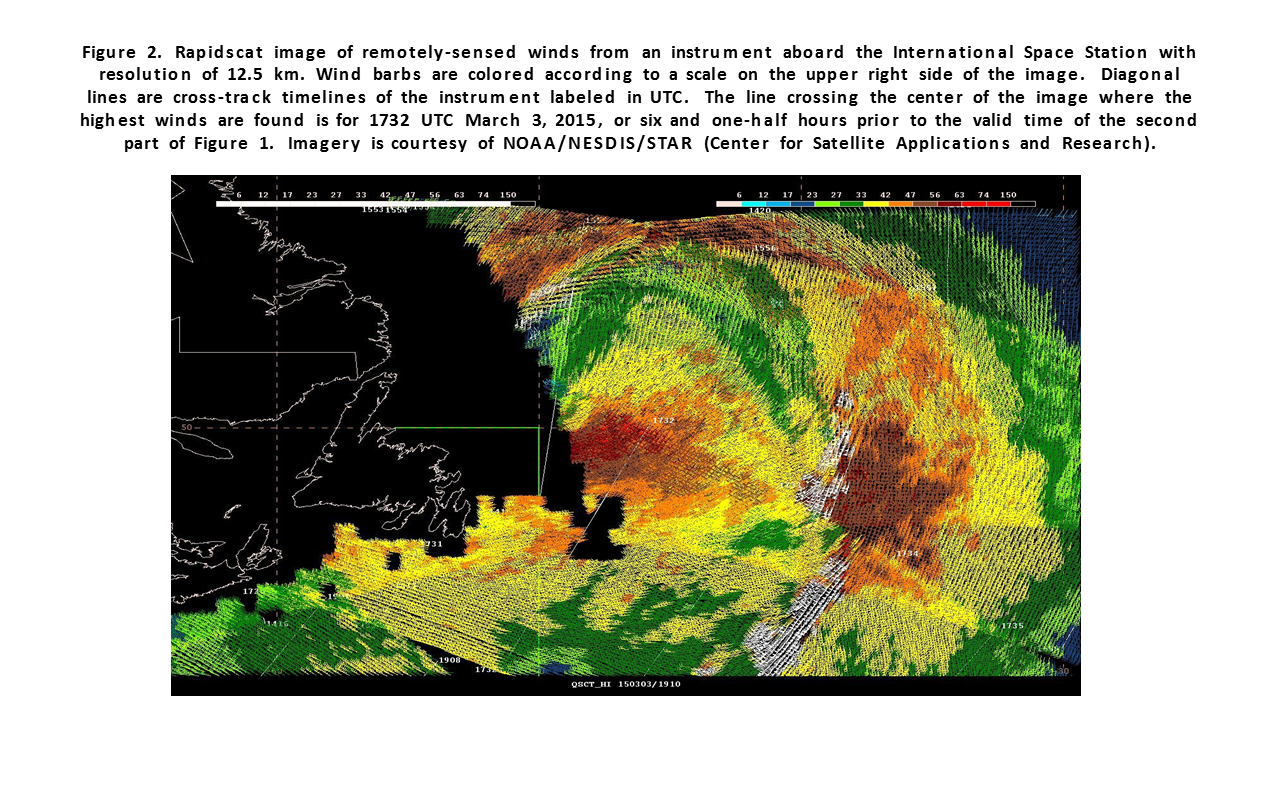
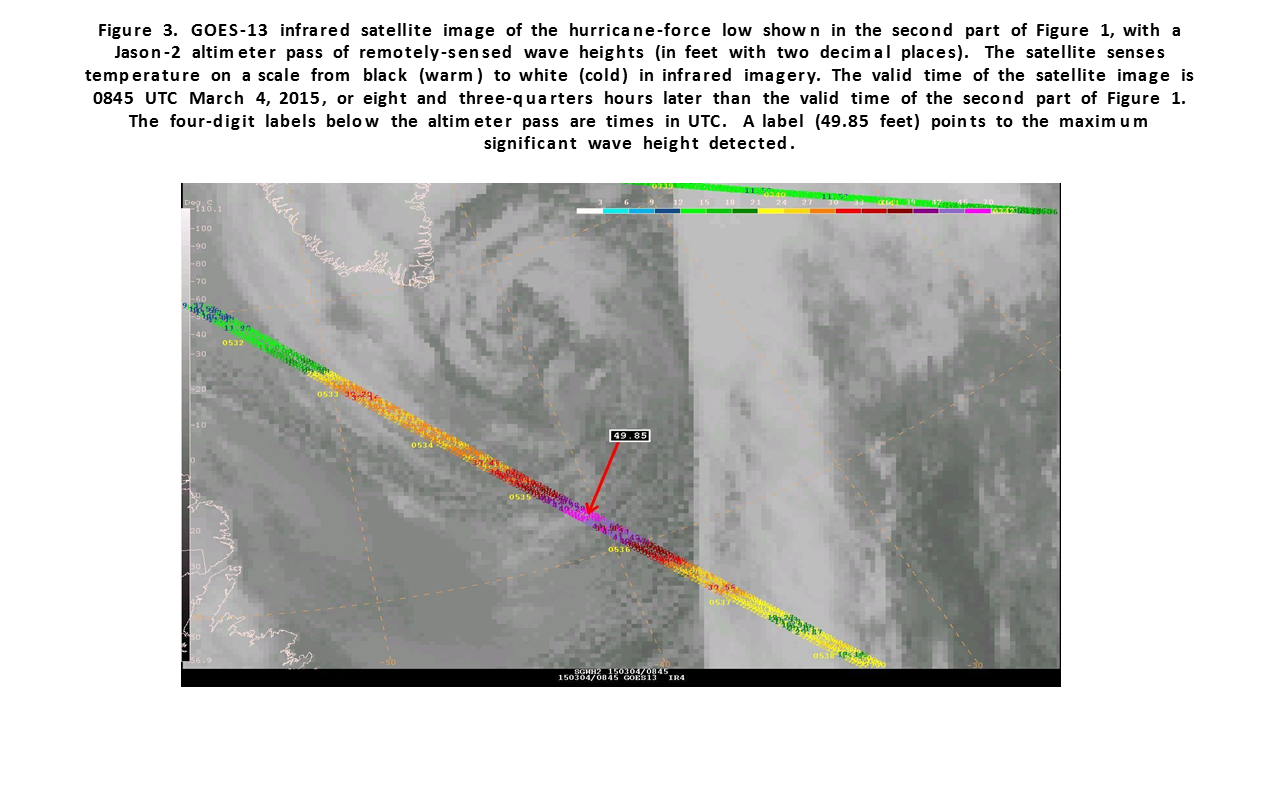
North Atlantic Storm, March 2-5: Low pressure rapidly intensified while passing northeast across the Canadian Maritime Provinces over a 36 hour periŁod as depicted in Figure 1 Its central pressure fell at more than twice the "bomb" rate at 60N (Sanders and Gyakum, 1980) with the central pressure dropping 52 hPa in the 24 hour period ending at 1200 UTC on the 3rd. The cyclone became one of the deepest of the period with a lowest central pressure of 951 hPa (Figure 1). The Rapidscat image in Figure 2 shows north winds of 65 kts east of the island of Newfoundland at 1732 UTC on the 3rd as the cyclone was approaching maximum intensiŁty. Figure 3 is a satellite image revealing a mature fully occludŁed system with a well defined center near the southern tip of of Greenland. It leaves a swath of higher seas in its wake, with the Jason-2 altimeter pass detecting seas approaching 50 ft (15.2 m). The BUDAPEST EXPRESS (DGWE2) near 40N 62W reportŁed southwest winds of 53 kts at 1800 UTC on the 2nd, while the CSAV HOUSTON (LXHL) near 40N 55W encountered southŁwest winds of 50 kts and 4.5 m seas (15 ft). The EAGLE KUANTAN (9V8376) reported west winds of 40 kts and 9.0 m seas (30 ft) near 45N 55W at 1200 UTC on the 3rd. The buoy 44251 (46.4N 53.4W) reported west winds of 39 kts with gusts to 49 kts and maximum seas 7.0 m (23 ft) at 1300 UTC March 3. The platform HIBERNIA (46.7N 48.7W) encountered west winds of 62 kts at an anemometer height of 139 m and 6.5 m seas (21 ft) two hours later. The cyclone's top winds weakened to storm force as it passed east of Greenland on the 4th and then moved through the Denmark Strait the next day.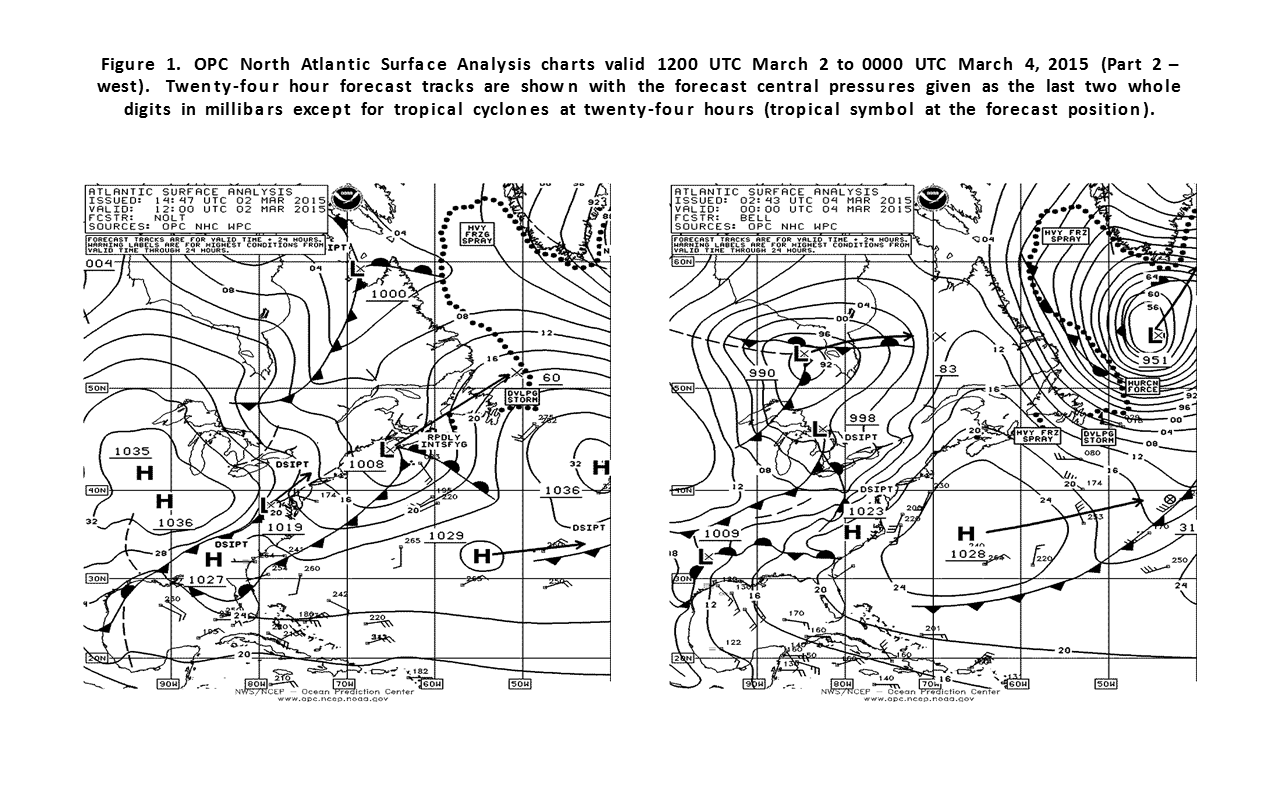
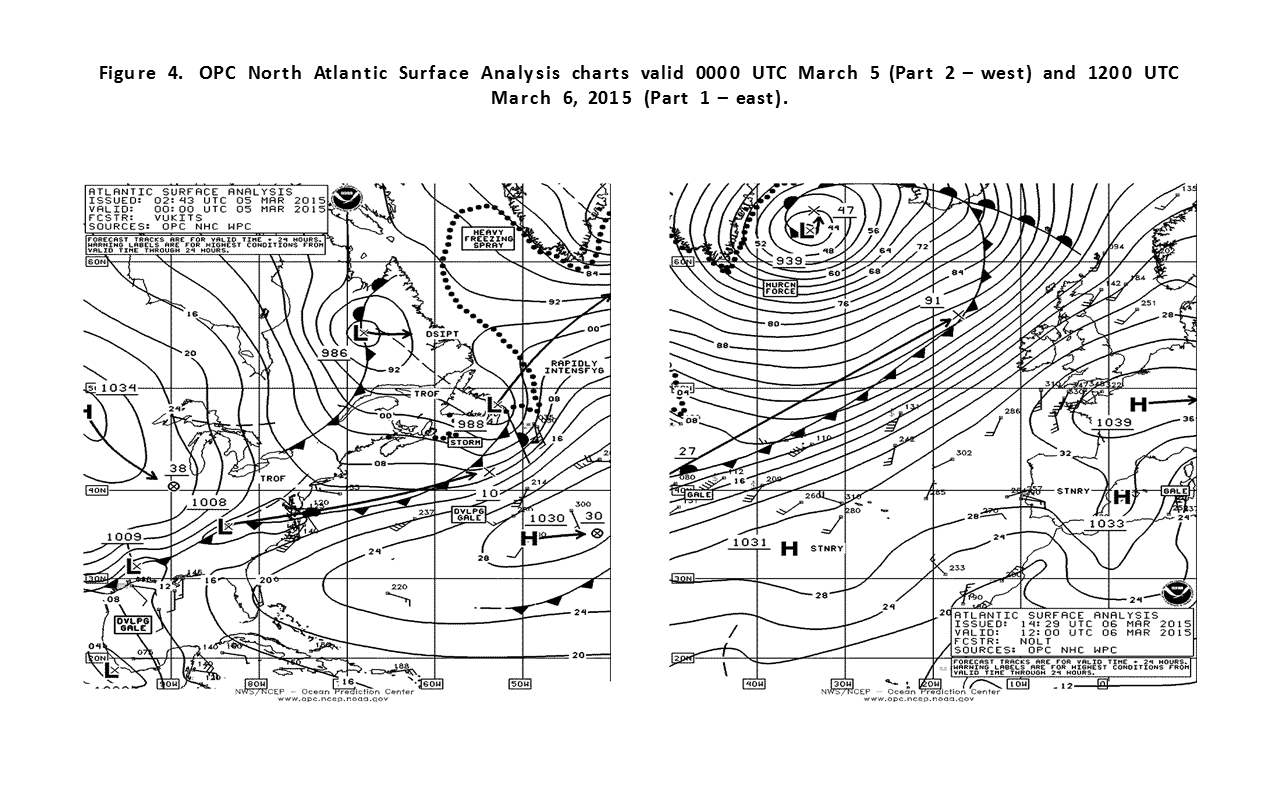
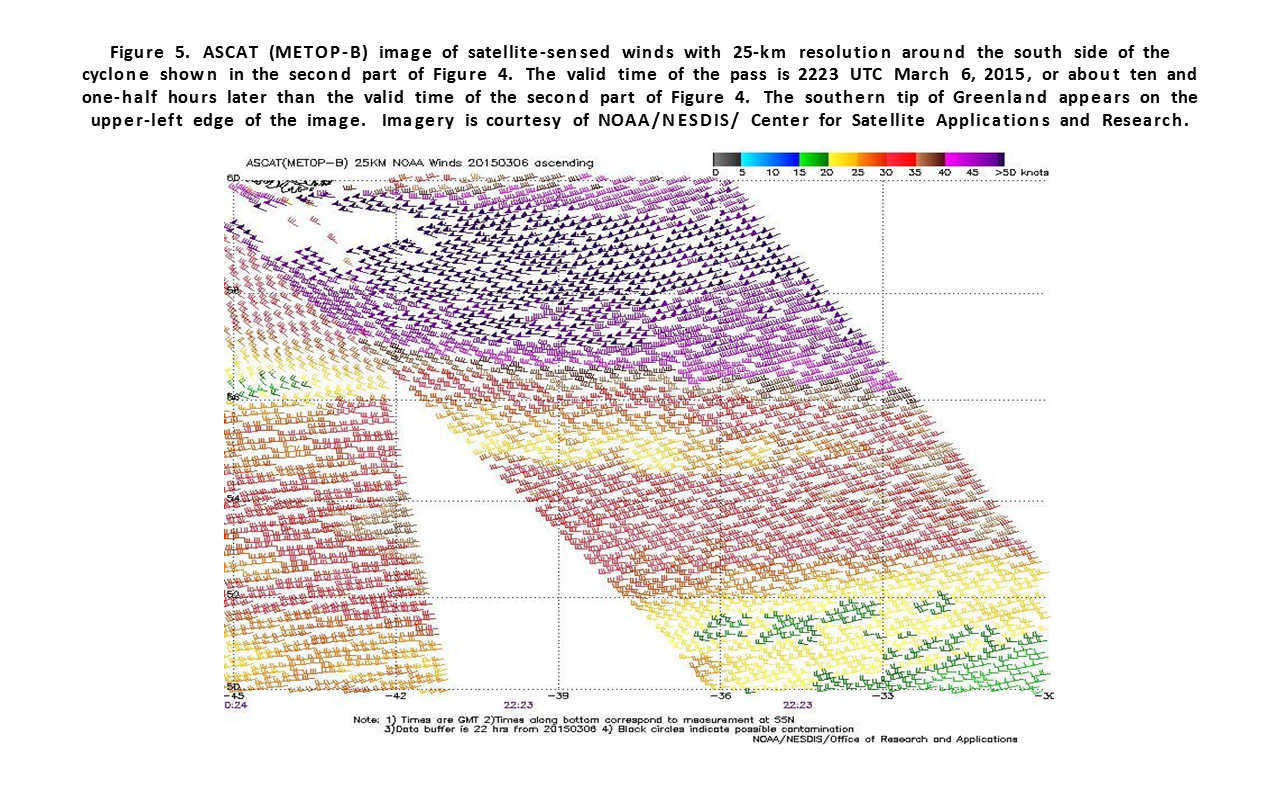
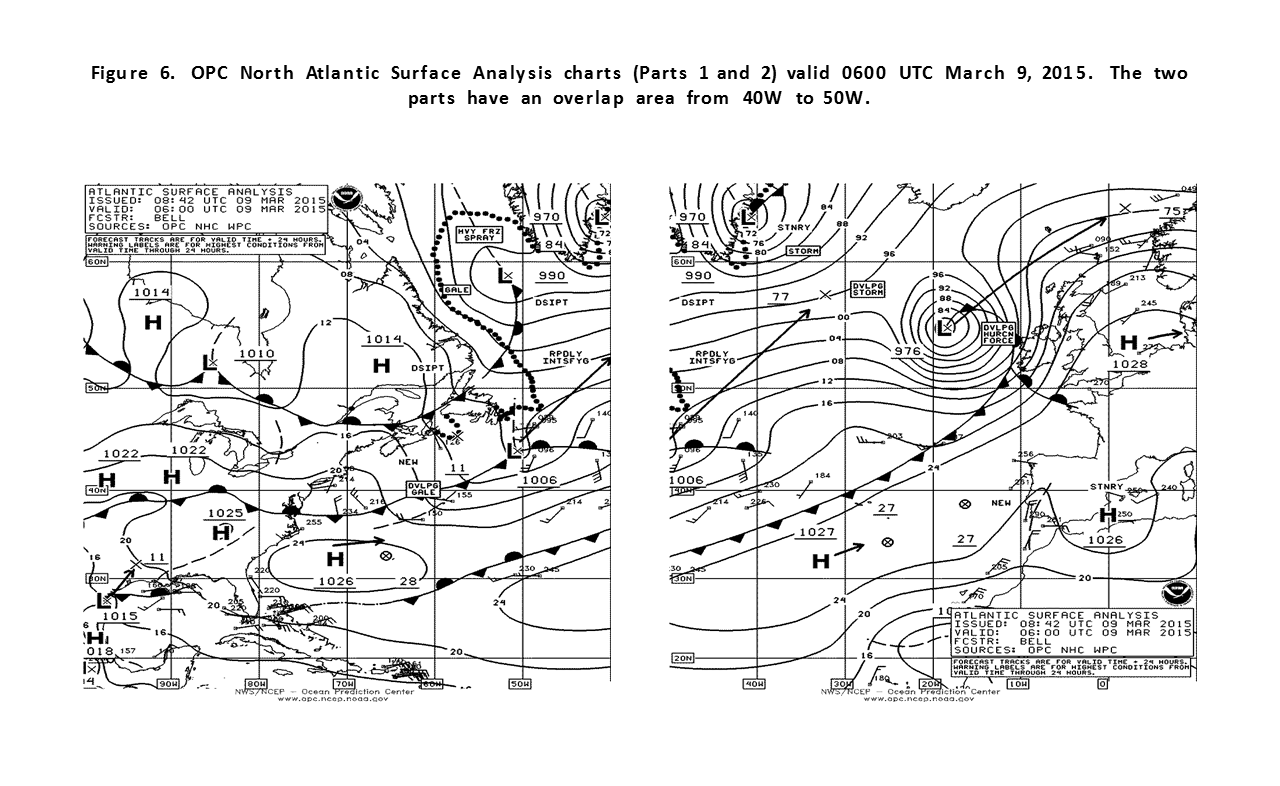
North Atlantic Storm, March 4-9: The next major development followed a similar track as shown in Figure 4 The cyclone deepened by 34 hPa in the 24 period after it passed northeast of the island of Newfoundland. The second part of Figure 4 shows the cyclone with a maxiŁmum intensity of 939 hPa (27.73 in), making it the most intense cyclone of the six month period in the North Atlantic and much deeper than anything in the North Pacific that did not have a tropical origin. The cyclone did not develop hurriŁcane force winds until it moved into the east Greenland waters on the 6th. The ASCAT-B image in Figure 5 returned a swath of west winds 50 to 55 kts on the south side of the center, but ASCAT has low bias especially at high wind speeds. The MAERSK PALERMO (PDHW) near 44N 44W reported southŁwest winds of 50 kts at 1200 UTC on the 5th. HIBERNIA (46.7N 48.7W) encountered south winds 59 kts at 0000 UTC on the 5th and seas 5.2 m (17 ft) three hours later. TERRA NOVA FPSO (46.4N 48.4W) reported southwest winds of 48 kts at 0300 UTC on the 5th (anemometer height 53 m). The cyclone subsequently stalled and weakened near the east Greenland coast through the 9th (Figure 6) before becoming absorbed by another strong system passing to the east on the 10th.
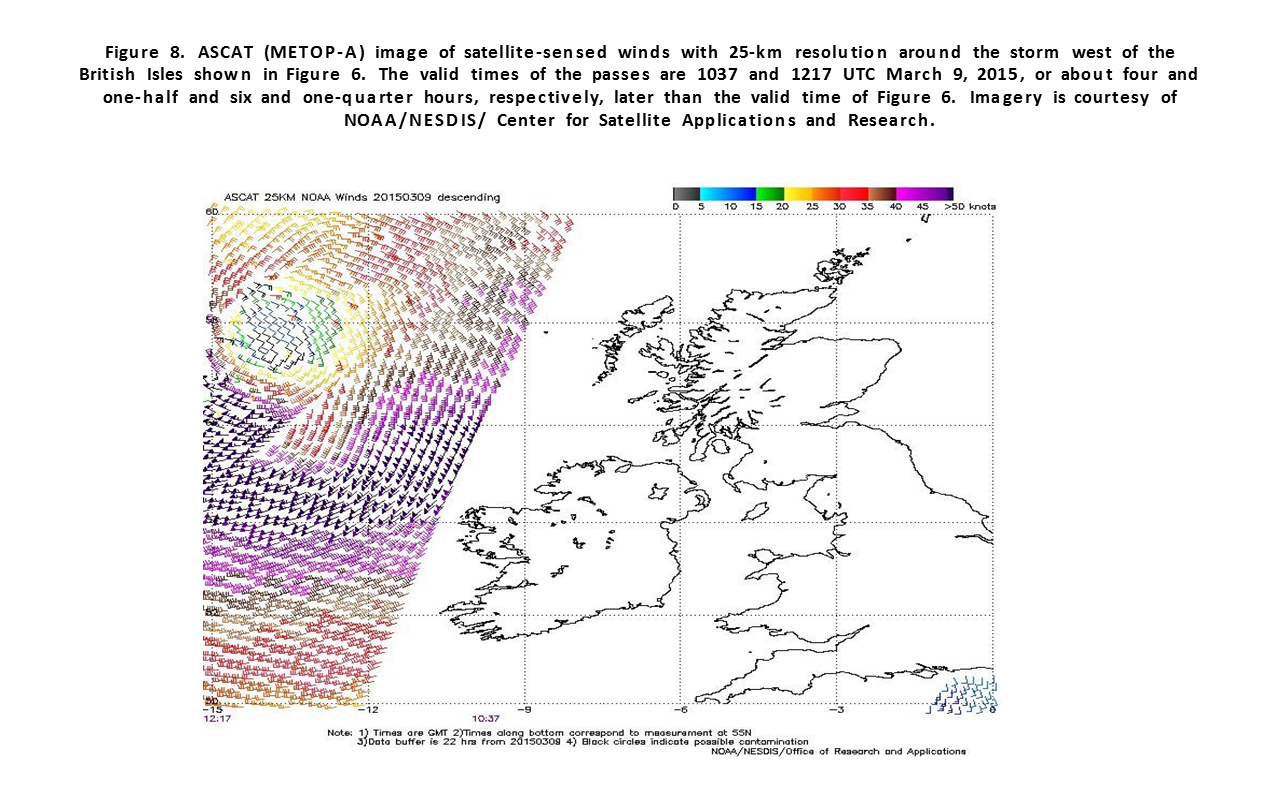
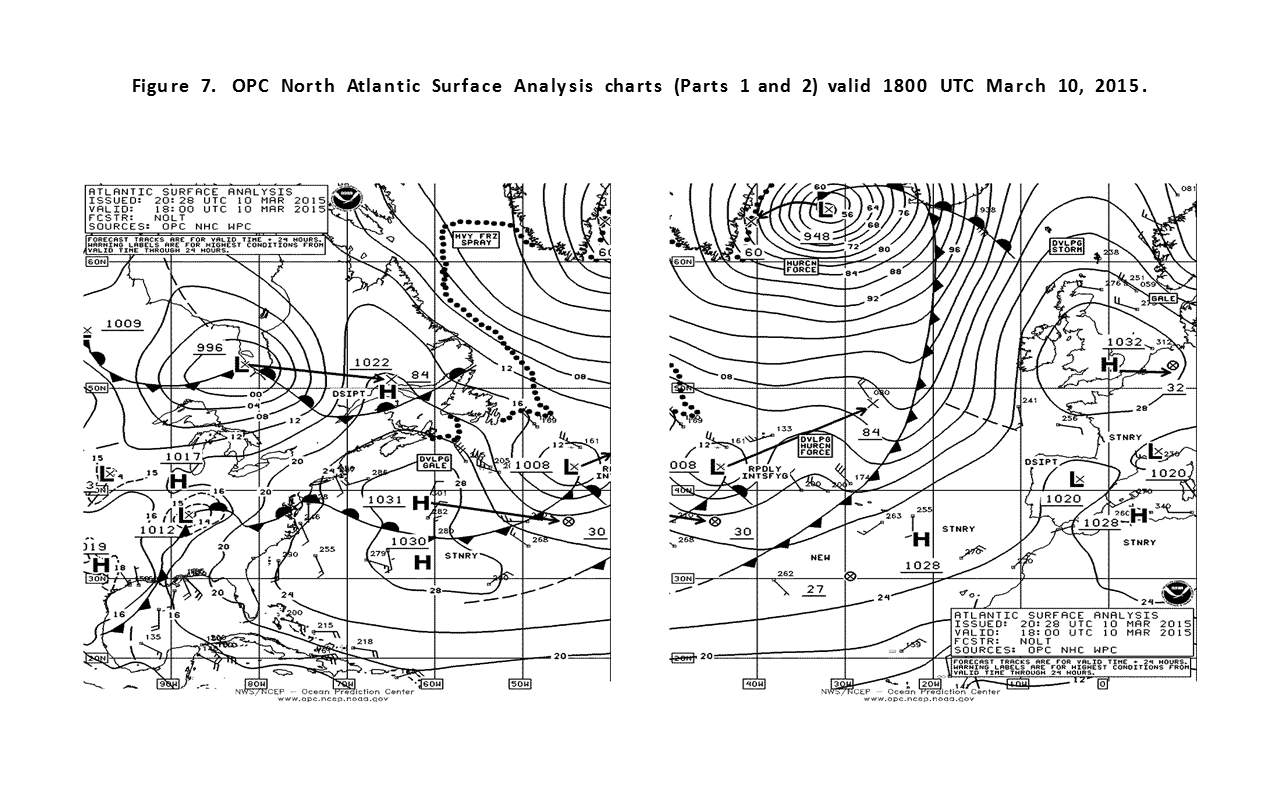
North Atlantic Storm, March 8-10: Low pressure originating near 34N 62W early on March 7th and moved rapidly northeast, with its central pressure dropŁping 29 hPa in the 24 hour periŁod ending at 0000 UTC on the 9th. Figure 6 shows the cyclone about to pass north of the British Isles. Its central pressure dropped to as low as 966 hPa six hours later as it passed near 57N 14W.The ASCAT-A imagery in Figure 8 shows a swath of 50 to 60 kts winds on the south side of the center.Low bias in ASCAT was mentioned earlier.
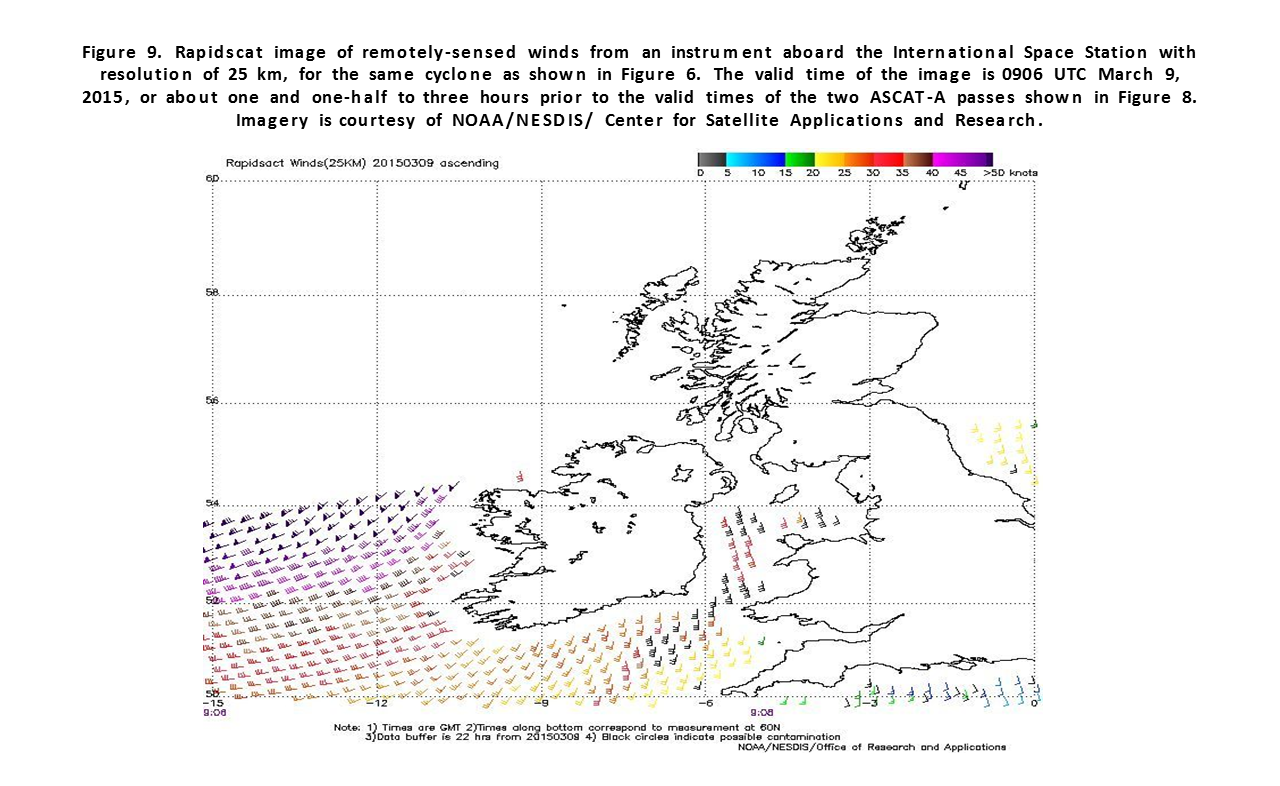
By comparison Figure 9 shows a Rapidscat pass within a few hours of the ASCAT image with winds to 70 kts on the edge of the pass. The CL BELGIUM (VRVQ9) near 45N 28W reportŁed east winds of 76 kts and 7.0 m seas (23 ft) at 1600 UTC on the 8th, but the wind appeared to have a high bias of 12 kts. The platform HEIMDAL (LF4H) near 59.6N 2.2E reported south winds of 45 kts and 6.5 m seas (21 ft) at 2300 UTC on the 9th and highest seas 9.5 m (31 ft) eight hours later. The cyclone weakened rapidly in the Norwegian Sea the following night and passed inland over Norway on the 10th (Figure 7).
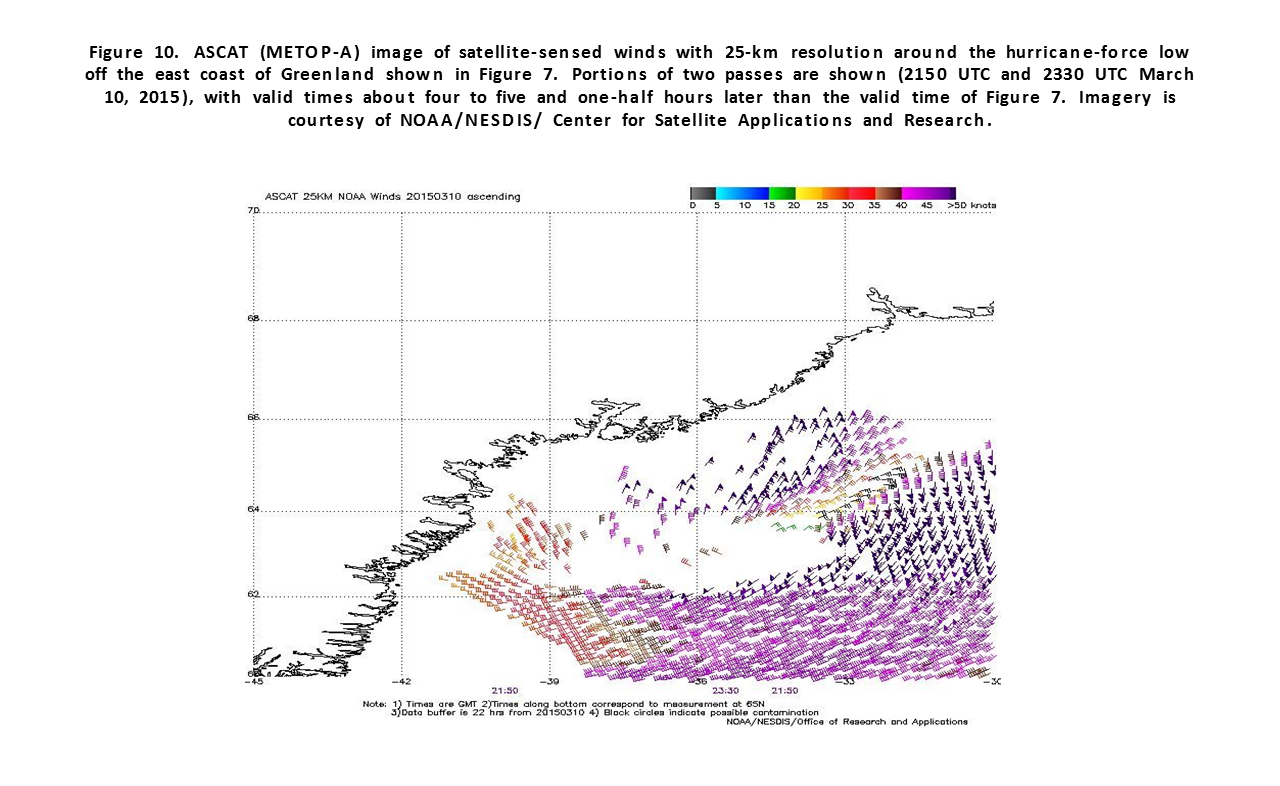
North Atlantic Storm, Greenland area, March 9-12: Low pressure originating southŁeast of Newfoundland rapidly intensified over the northern waters and developed a lowest central pressure of 948 hPa east of Greenland by 1800 UTC on the 10th (Figure 6 and Figure 7), making it the second deepest central pressure for a cyclone during the period. The central pressure fell 45 hPa in the 24 hour period ending at 1800 UTC on the 10th. The ASCAT-A image in Figure 10 returned winds to 60 kts on the north and the southeast and east sides of the cyclone center. The cyclone then stalled and weakened near the east Greenland coast over the next two days before becoming absorbed late on the 12th.
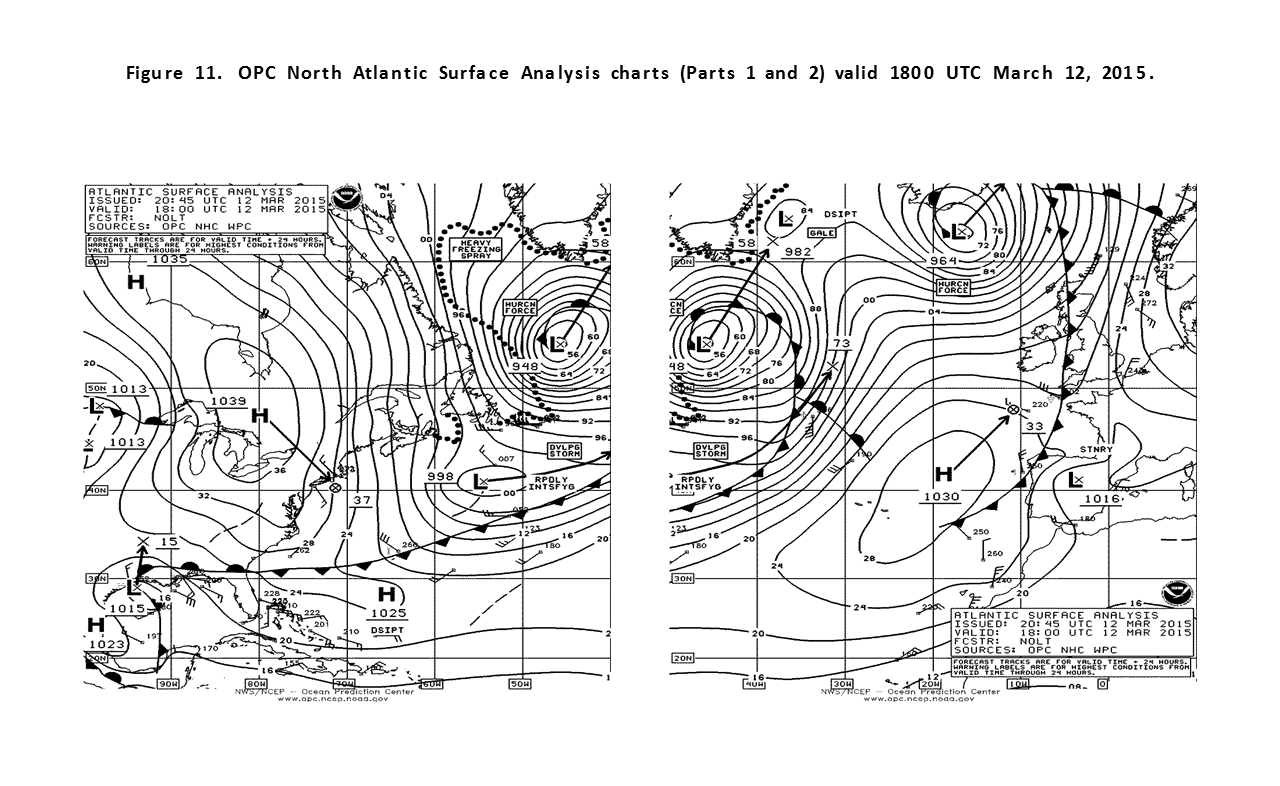
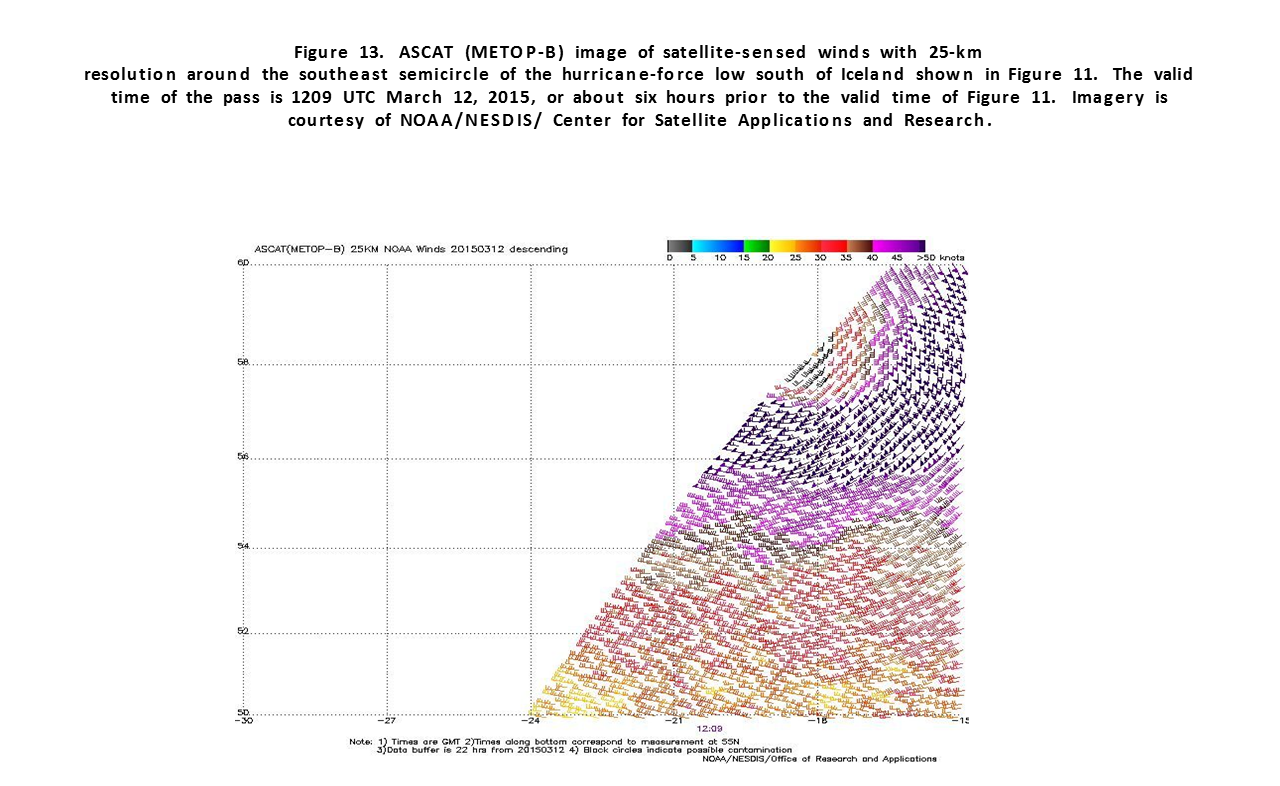
North Atlantic Storm, March 10-13: A weak low dropped southeast across the Canadian Atlantic provinces on March 9th and rapidly intensified after passing southeast of the island of Newfoundland on the 10th (Figure 7). Its central pressure dropped 28 hPa during the folŁlowing 24 hour period and by 0000 UTC on the 12th develŁoped hurricane-force winds with a center near 53N 23W. It was similar in intensity to the March 8-10th event in that area. Figure 11 shows the cyclone approaching Iceland near maxiŁmum intensity. The ASCAT-B pass in Figure 13 reveals winds of 50 to 65 kts in the southeast semicircle of the cyclone. The ship Arneborg (PHHD) near 45N 37W reported south winds of 55 kts and 7.9 m seas (26 ft). The cyclone then passed northŁeast of Iceland by the 13th.
North Atlantic Storm, March 11-14: The next deep system to form in this very active month, like the March 9-12th event, developed a 948 hPa central pressure (Figure 11). It originated as the low moving across southern Canada two days prior (Figure 7). The center deepŁened rapidly after moving off the Labrador coast with the central pressure falling 38 hPa in the 24 hour period ending at 1800 UTC on the 12th. The MSC ILONA (DARU) near 43N 31W reported southwest winds of 50 kts and
7.9 m seas (26 ft) at 0000 UTC on the 13th. The platform HIBERNIA (46.7N 48.7W)
reported south winds of 60 kts at 0300 UTC on the 12th, and 9 hours later a west wind of 55 kts and 6.5 m seas (21 ft). The cyclone then stalled and weakŁened near the east Greenland coast late on the 13th and through the night of the 14th.
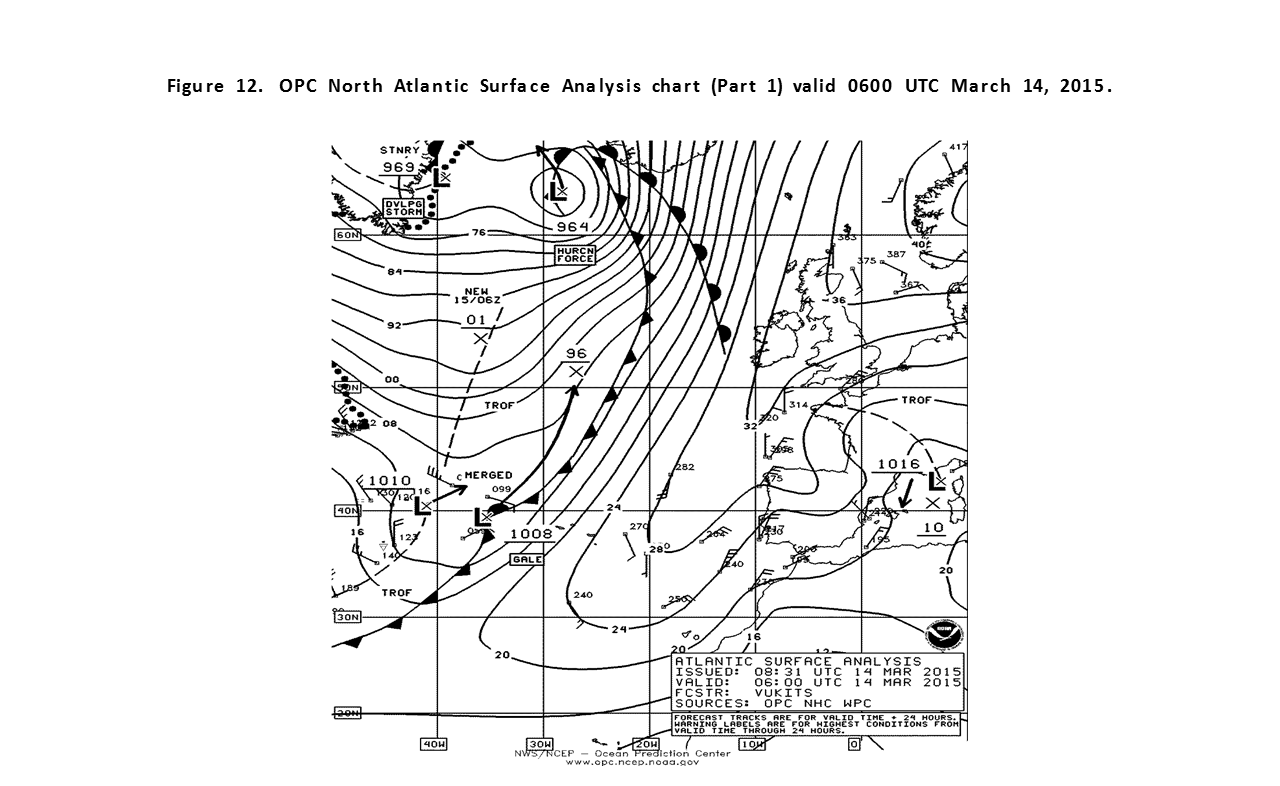
North Atlantic Storm, March 12-14: Another area of low pressure passed southeast from the Atlantic provinces of Canada and then turned northeastward after passing south of the island of Newfoundland (Figure 11). It developed hurricane force winds while passing over the north central waters by 0000 UTC on the 14th. An ASCAT-B pass from 2138 UTC on the 13th showed winds 50 to 60 kts on the southeast side of the center, somewhat similar to Figure 13 for the March 10-13th event. Figure 12 has the cyclone passing west of Iceland the following night. The central pressure dropped to as low as 957 hPa northwest of Iceland early on the 14th before the sysŁtem moved inland over Greenland.
North Atlantic Storm, March 15-16: In a final development in the series, two lows shown over the southern waters in Figure 12 merged late on the 14th to form a rapidly intensifying low over the central waters. The central pressure fell 30 hPa in the 24 hour period ending at 1800 UTC on the 15th, when the cyclone developed a central pressure of 970 hPa and briefly hurricane force winds near 59N 30W before passing west of Iceland and weakening on the night of the 15th. A station (TFSRT, 63.3N 20.4W) on the coast of Iceland reported 9.0 m seas (30 ft) at 1200 UTC on the 16th.
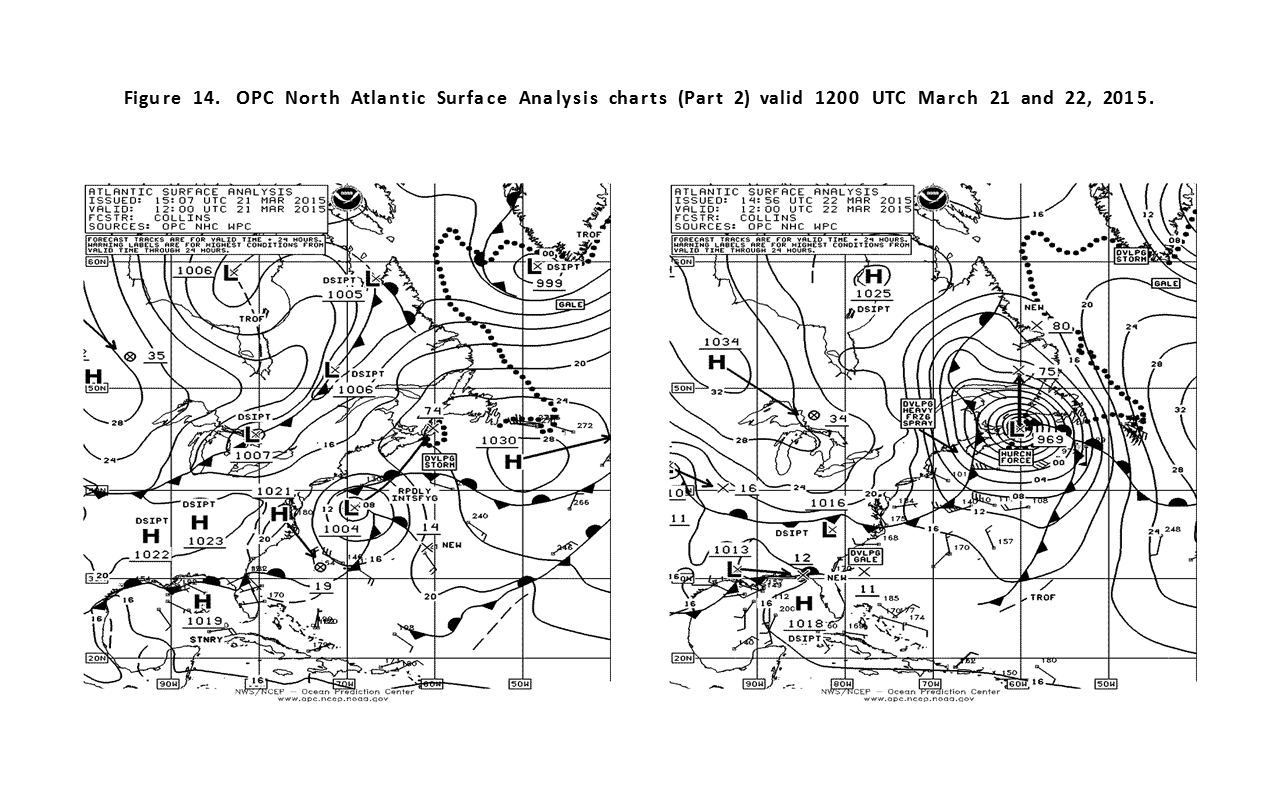
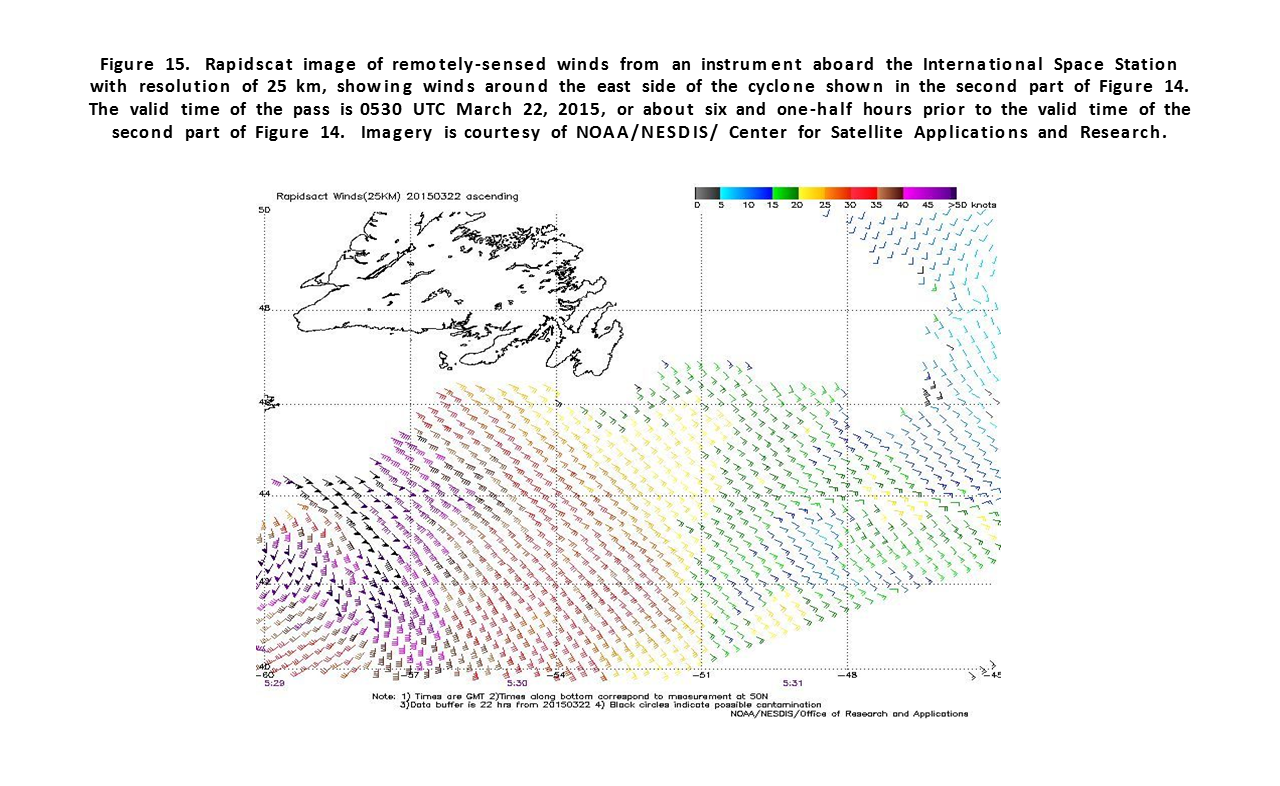
Western North Atlantic Storm, March 21-24: An area of low pressure moved northeast off the southeast coast of the U.S. and rapidly intensified after passing northŁeast of 38N 69W at 1200 UTC March 21. The central pressure fell 35 hPa in the 24 hour period ending at 1200 UTC on the 22nd as the cyclone developed a central pressure of 969 hPa and hurricane force winds (Figure 14).The Rapidscat image in Figure 15 returned the highest winds on the east side with up to 65 kts. The platform CFL24 (43.8N 60.6W) reported west winds of 50 kts and 6.0 m seas (20 ft) at 2000 UTC on the 22nd. Buoy 44139 (44.2N 57.1W) reported southwest winds of 37 kts with gusts to 49 kts and 7.5 m seas (25 ft) at 2300 UTC on the 22nd and highest seas 8.5 m (28 ft) one hour later. After weakening over land on the night of the 22nd the cyclone briefly developed hurriŁcane force winds again in the Labrador Sea the next day before stalling and weakening near the east Greenland coast on the 24th.
North Atlantic Storm, April 1-3: A developing low originating well south of Newfoundland late on March 29th moved northeast and gradually intensified over the next three days, briefly developing hurricane force winds while approaching Greenland with a 987 hPa cenŁter late on April 1st before weakening as it passed between Greenland and Iceland on April 2nd and 3rd.
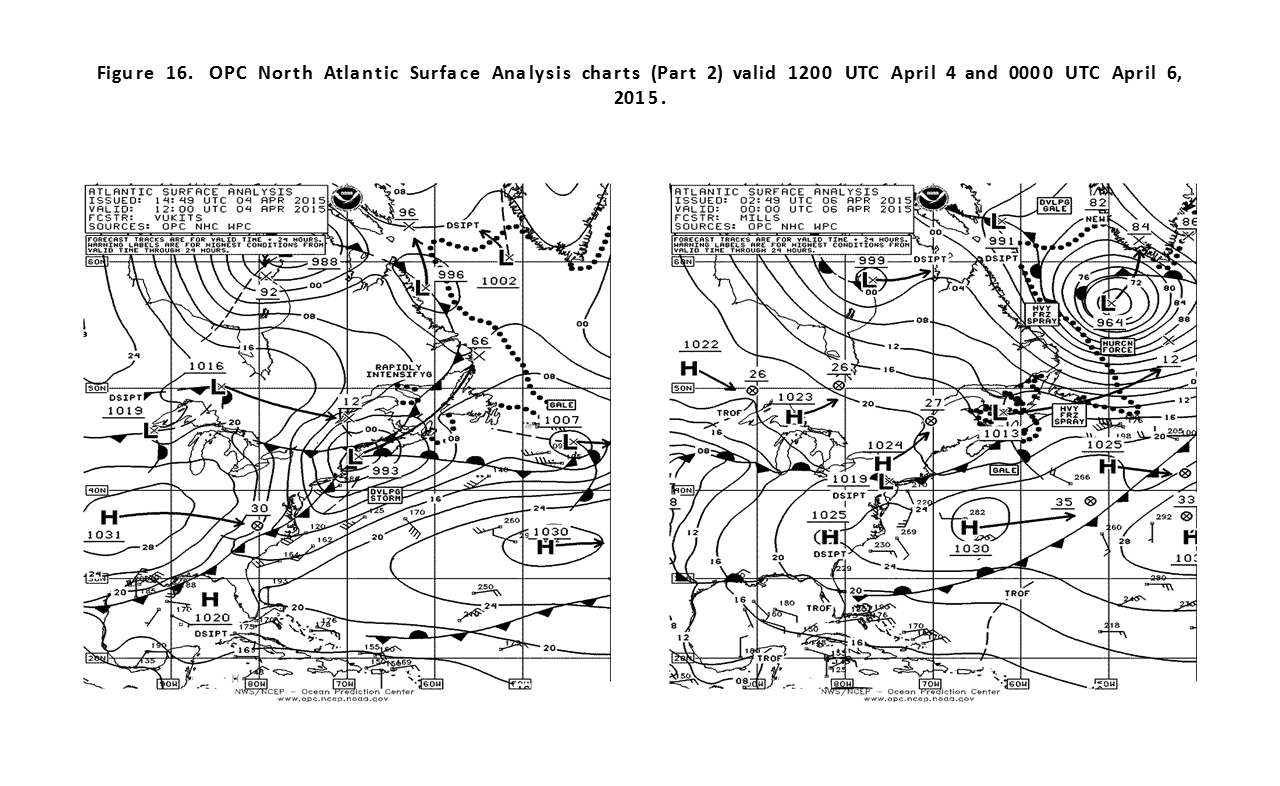
Western North Atlantic Storm, April 4-7: Low pressure intensified as it moved northeast off the southŁern New England coast over the next 36 hours as depicted in Figure 16 The central pressure fell 25 hPa in the 24 hour period ending at 0000 UTC on the 5th, with the cyclone at maximum intensity in the second part of Figure 16 The platform CFL24 (43.8N 60.6W) reported northŁwest winds of 50 kts and 4.9 m seas (16 ft) at 0400 UTC on the 5th. The buoy 44255 (47.3N 57.3W) reported west winds of 40 kts with gusts to 51 kts and 4.9 m seas (16 ft) at 0900 UTC on the 5th HIBERNIA (VEP717, 46.7N 48.7W) encountered west winds of 55 kts and 4.6 m seas (15ft) at 1500 UTC on the 5th and 5.8 m seas (19 ft) six hours later. Hurricane force winds on the night of the 5th weakened over the following two days as the system passed between Greenland and Iceland.
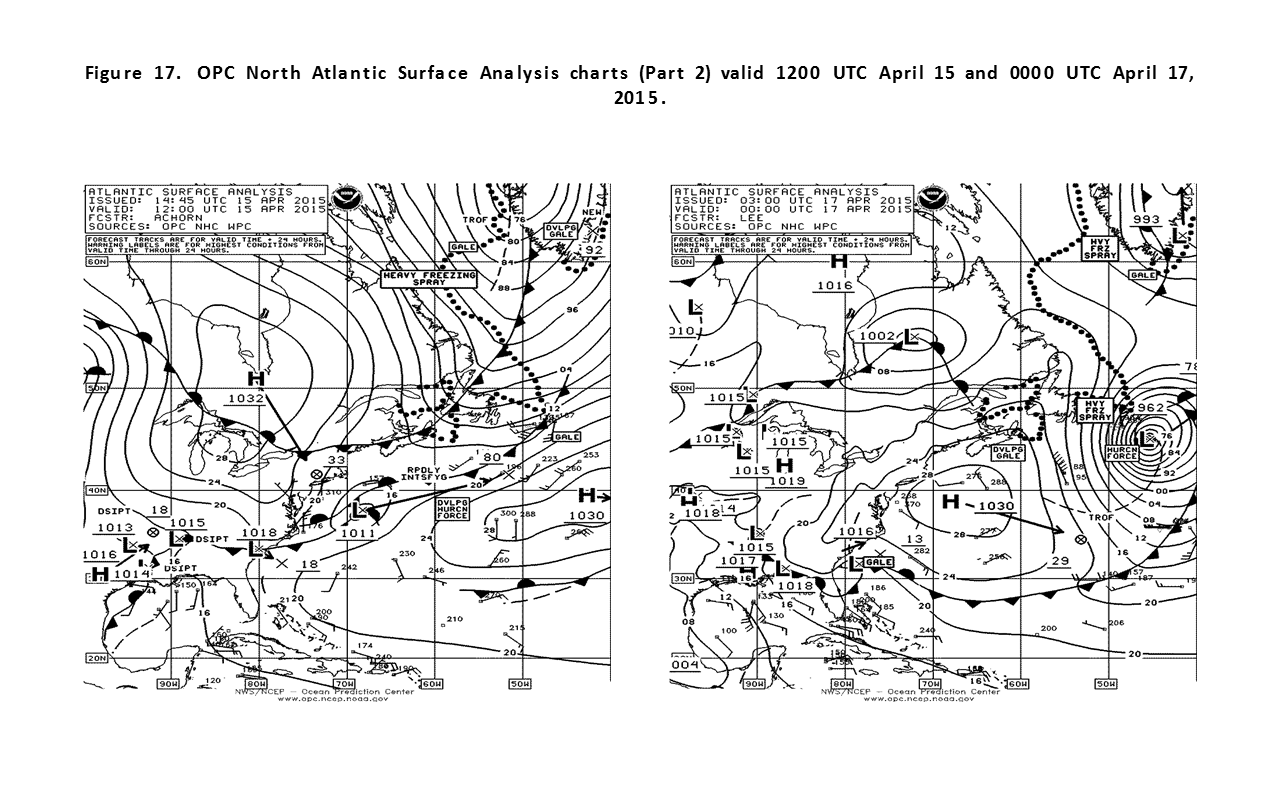
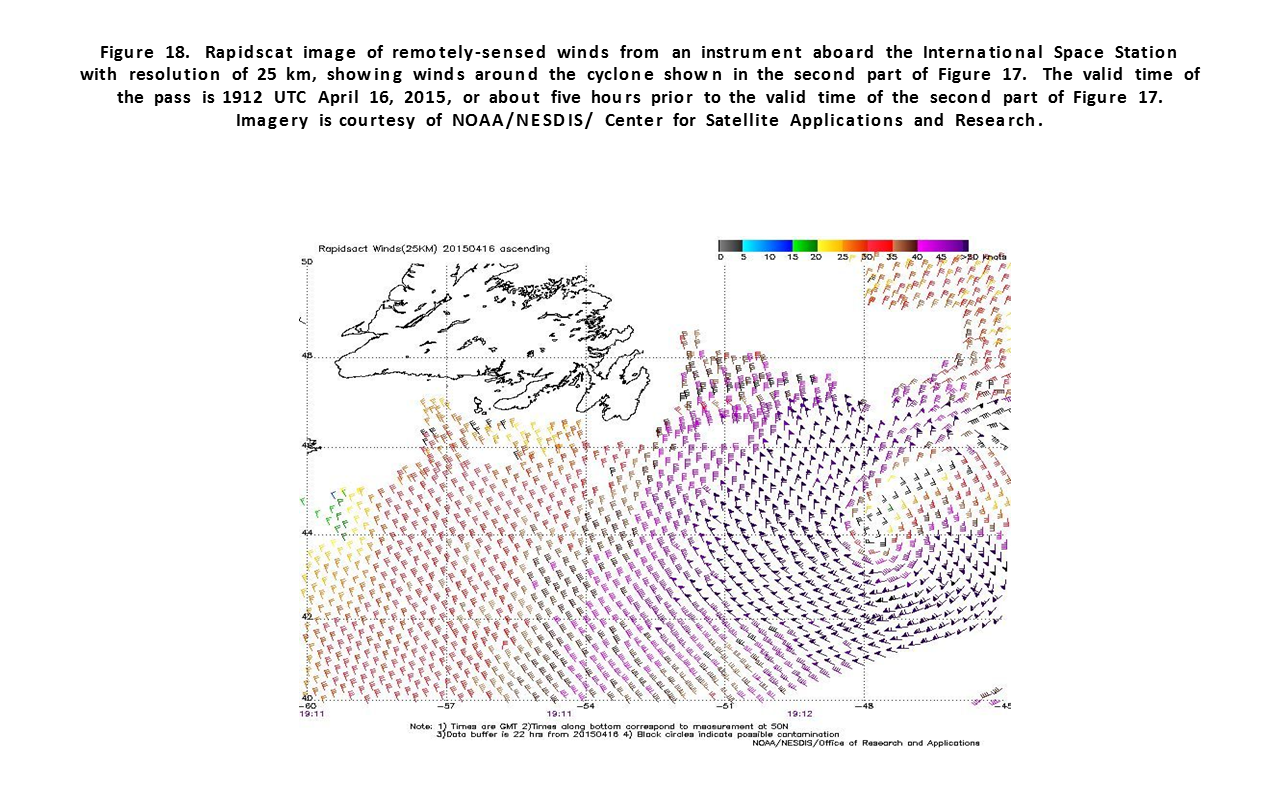
North Atlantic Storm, April 15-18: Low pressure moving off the Mid-Atlantic Coast of the U.S. intensified rapidly as shown in Figure 17 The central pressure dropped 43 hPa in the 24 hour period ending at 1200 UTC April 16th, quite impressive for such low latitude. The lowest central pressure was 962 hPa 12 hours later. The Rapidscat image in Figure 18 returned winds up to 70 kts west of the center and 65 kts to the south. Areas free of wind barbs are likely due to sea ice. The HIBERNIA platform (VEP717, 46.7N 48.7W) reportŁed north winds of 80 kts at a height of 139 m at 0000 UTC on the 17th, and TERRA NOVA FPSO (VCXF, 46.4N 48.4W) encountered north winds of 70 kts at a height of 53 m three hours prior. The BREMEN EXPRESS (DGZL, 41N 57W) reported northwest winds of 50 kts and 7.3 m seas (24 ft) at 1800 UTC on the 16th. The system then tracked east northeast with a weakening trend on the 17th before turning north and weakening to a gale near Greenland late on the 18th.
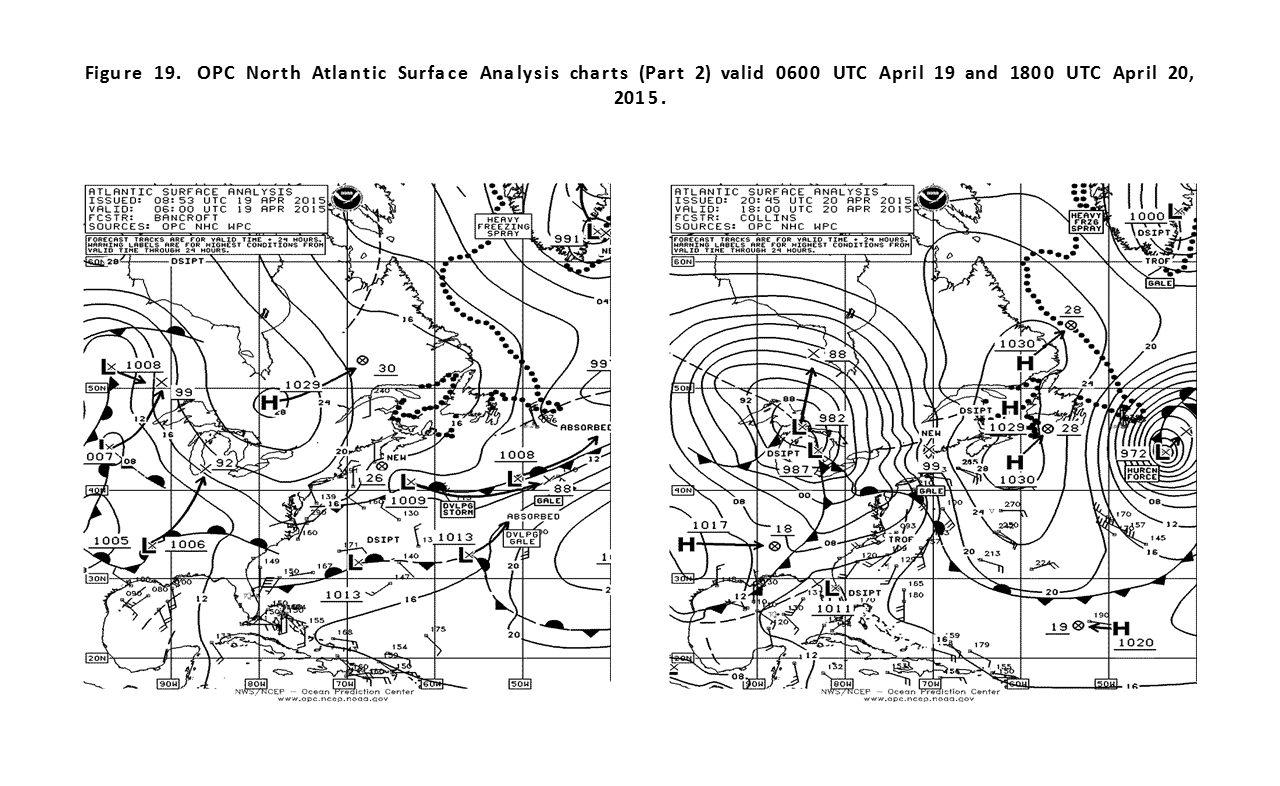
North Atlantic Storm, April 19-22: The development of another hurricane force low that reached maximum intensity in about the same place as its predecessor is depicted in Figure 19 Initial development was as a frontal wave that moved southeast from New England late on April 18th then tracked east near 40N before turning northeast and rapidly intensifying. The central pressure fell 33 hPa in the 24 hour period ending at 1200 UTC on the 20th and a lowest presŁsure of 972 hPa occurred six hours later. A Rapidscat image from 2205 UTC on the 20th was similar to Figure 18 for the previous event. The ATLANTIC COMPANION (SKPE) near 46N 38W reported southeast winds of 62 kts at 1200 UTC on the 20th. HIBERNIA (VEP717, 46.7N 48.7W) reported northeast winds of 66 kts at 0000 UTC on the 21st, and 7.0 m seas (23 ft) six hours later. The cyclone subsequently tracked over the central waters with a weakening trend, stalled and then moved southeast and inland over Spain.
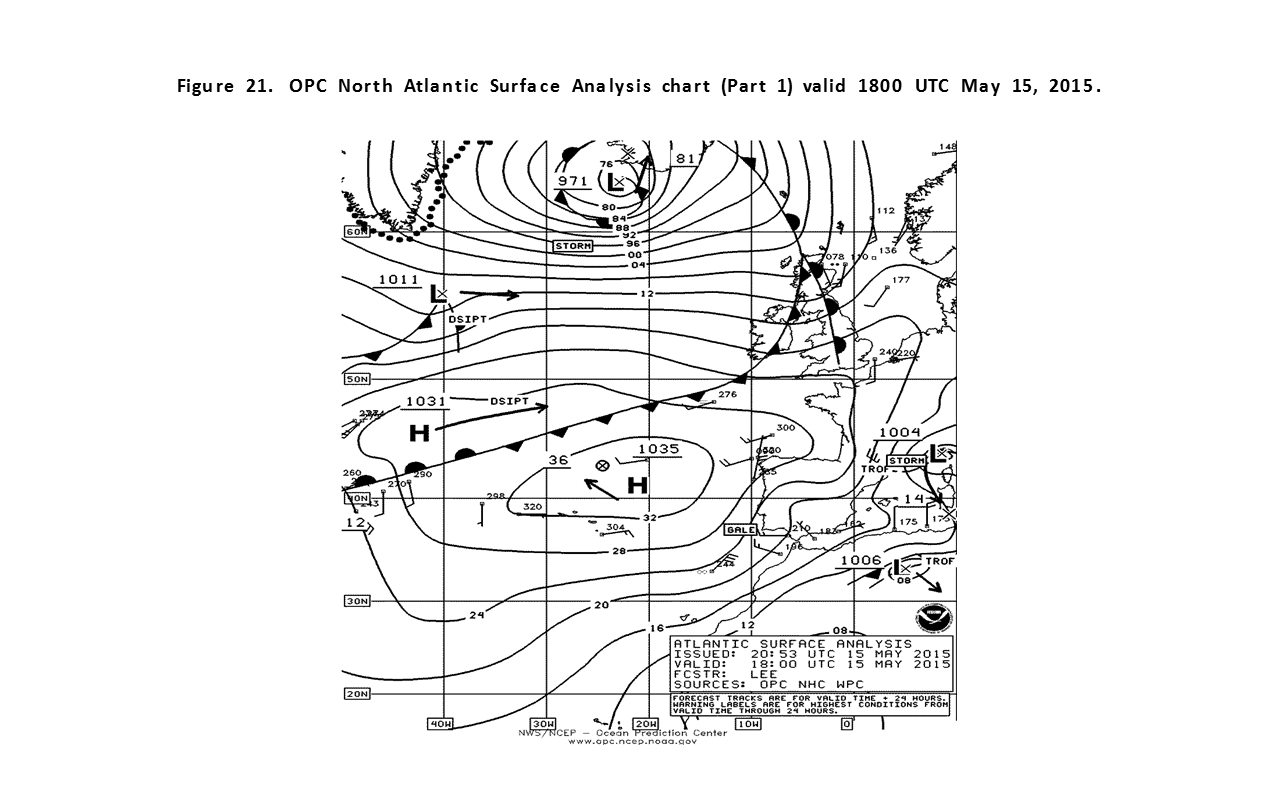
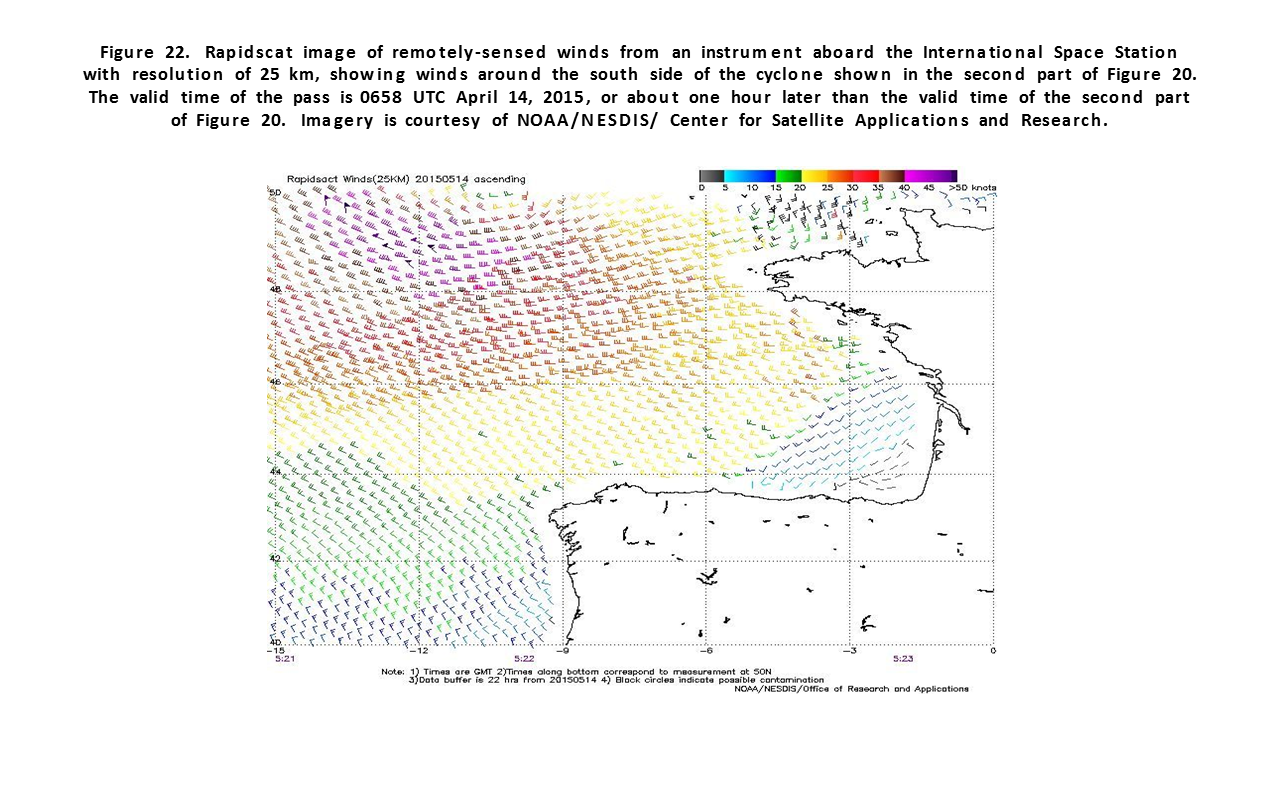
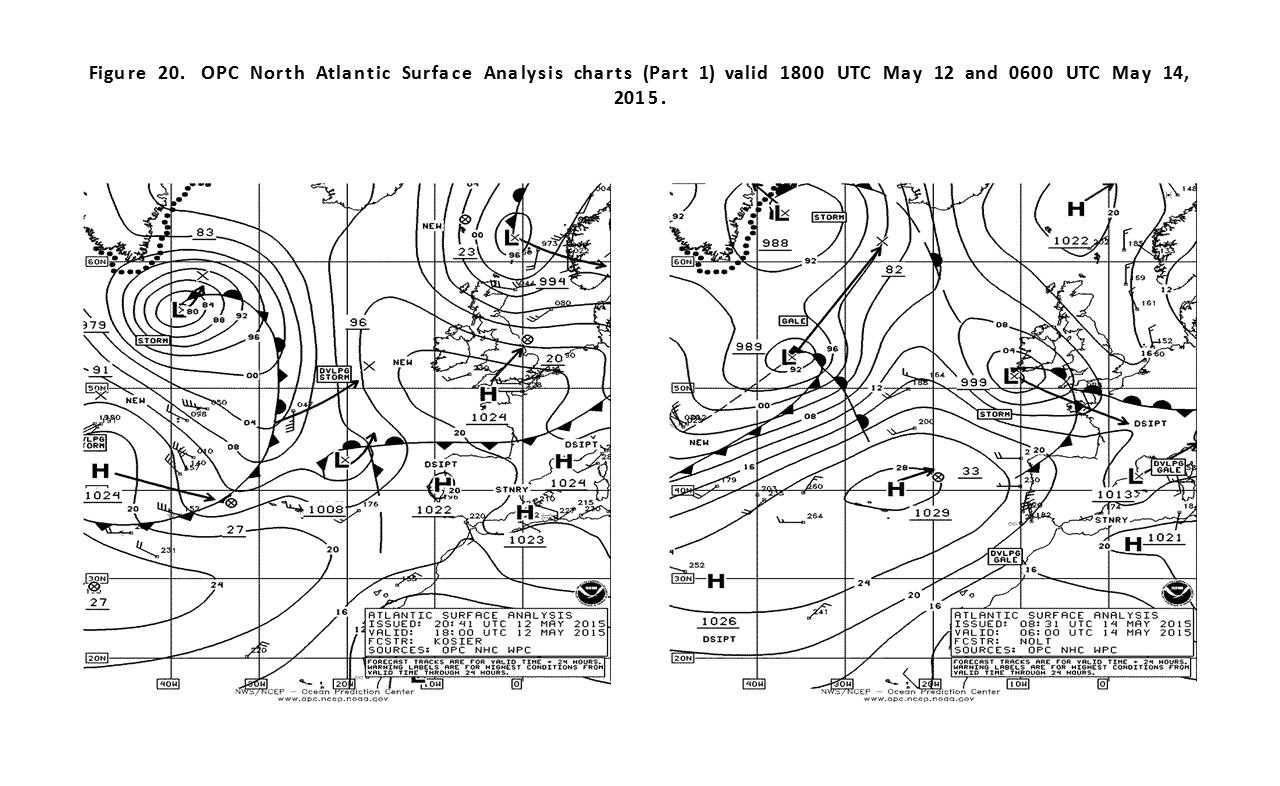
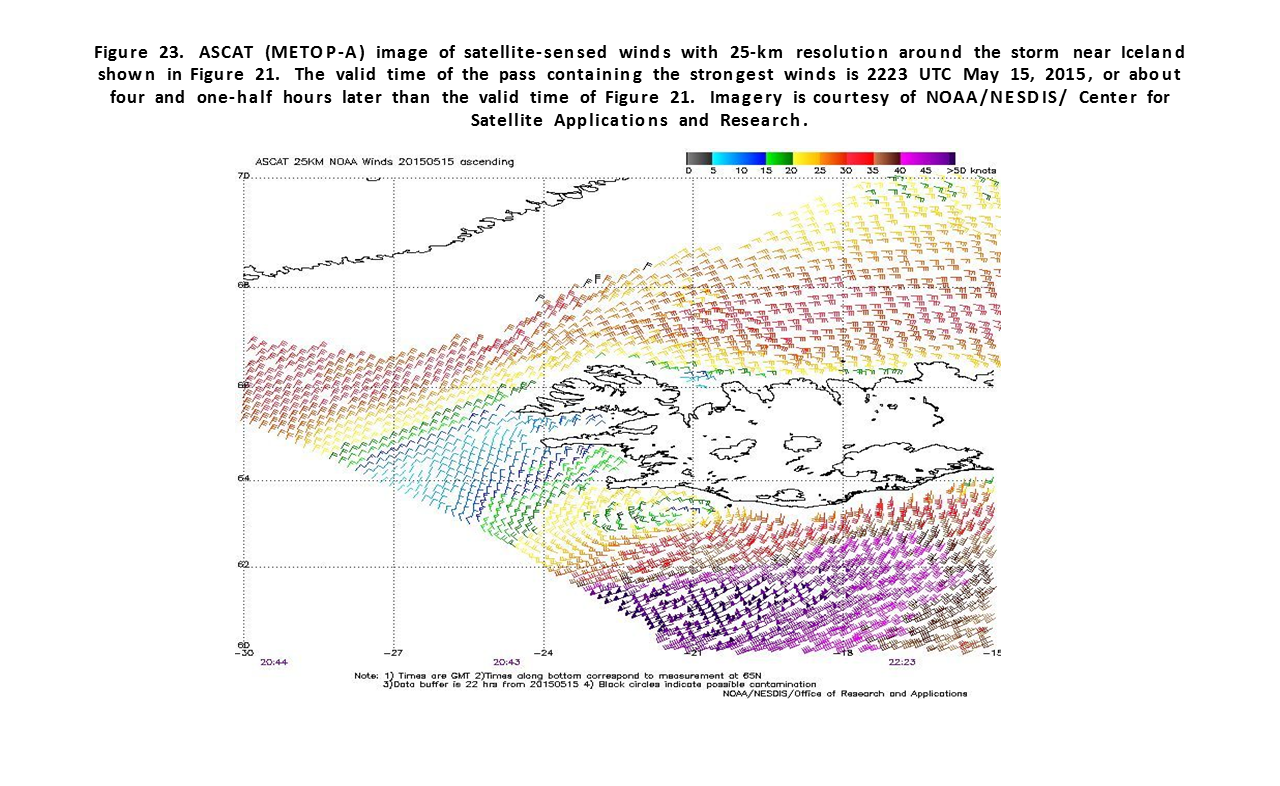
North Atlantic Storms, May 11-16: Figure 20 and Figure 21 depict an active pattern over the northern and eastern waters in mid-May. The storm southeast of Greenland formed as a new low early on the 11th in association with a primary low in the Davis Strait. Meanwhile a secondary storm center formed on its front and moved toward Europe. The Rapidscat pass from 0658 UTC on the 14th (Figure 22) depicts the stronger winds of up to 55 kts south of the secondary storm center. At 1800 UTC on the 13th the HONOR (WDC925) reported west winds of 45 kts near 50N 19W. Buoy 62029 (48.7N 12.4W) reported west winds of 40 kts with gusts to 50 kts and 8.5 m seas (28 ft) at 0600 UTC on the 14th and highŁest seas 9.8 m one hour later. Meanwhile the cyclone heading toward Iceland in the second part of Figure 20 came from the Canadian Maritime Provinces late on the 12th and in Figure 21 appears as the storm near Iceland which developed a lowŁest central pressure of 970 hPa at 1200 UTC on the 15th, makŁing it the most intense cyclone of the May to August period in terms of central pressure. ASCAT-A winds with this cyclone appear in Figure 23, with up to 55 kts south of the center. The storm approaching Europe is dissipated inland in Figure 21 or reformed in the Mediterranean.
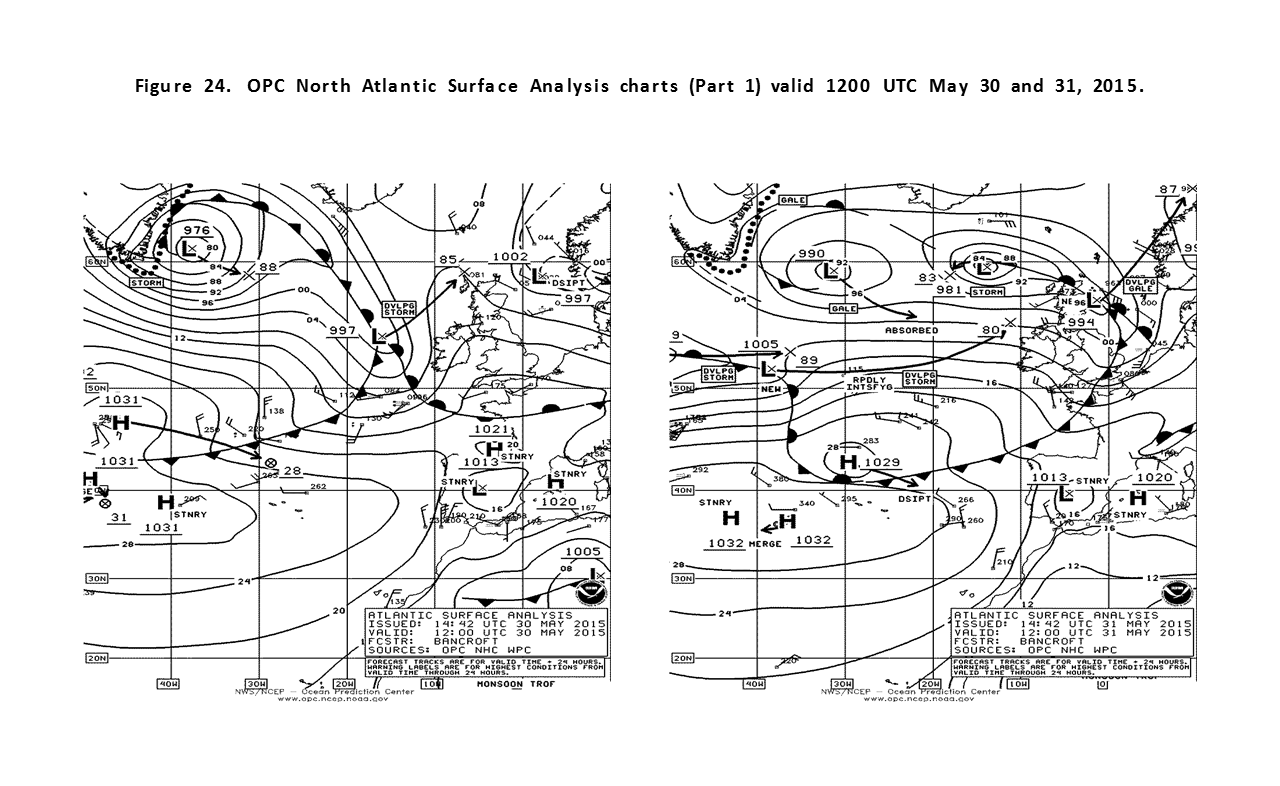
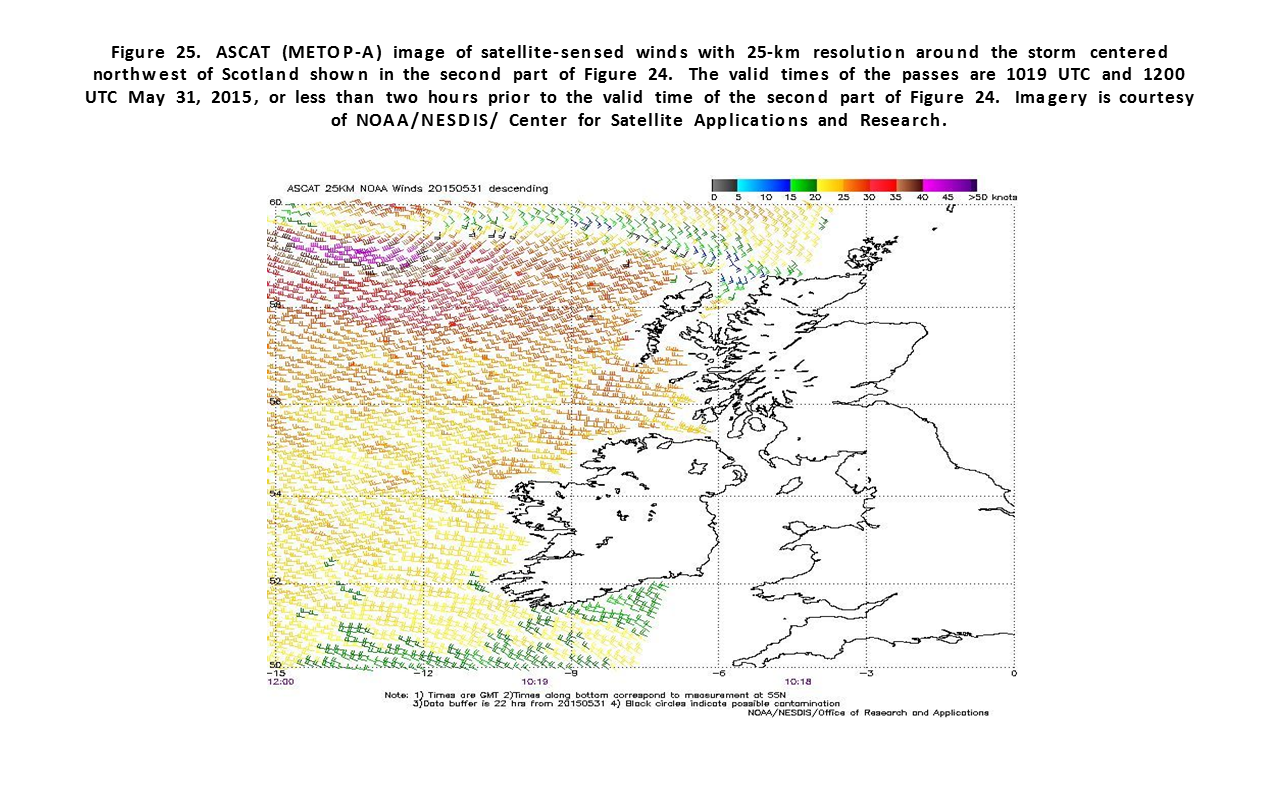
North Atlantic Storms, May 29-31: The storm with a 976 hPa cenŁter (Figure 24) originated as a developing low moving off the north Labrador coast two days prior. An ASCAT-A image from 2232 UTC on the 30th revealed winds up to 50 kts both south of the center and north of the front near the Greenland coast. Figure 24 also depicts a secŁondary storm center forming on the front while the primary low weakens. Figure 25 is an ASCAT-A image of the secondŁary cyclone with winds to 45 kts detected south of the center. Both of these systems became absorbed by new development coming off the Labrador coast, described below.
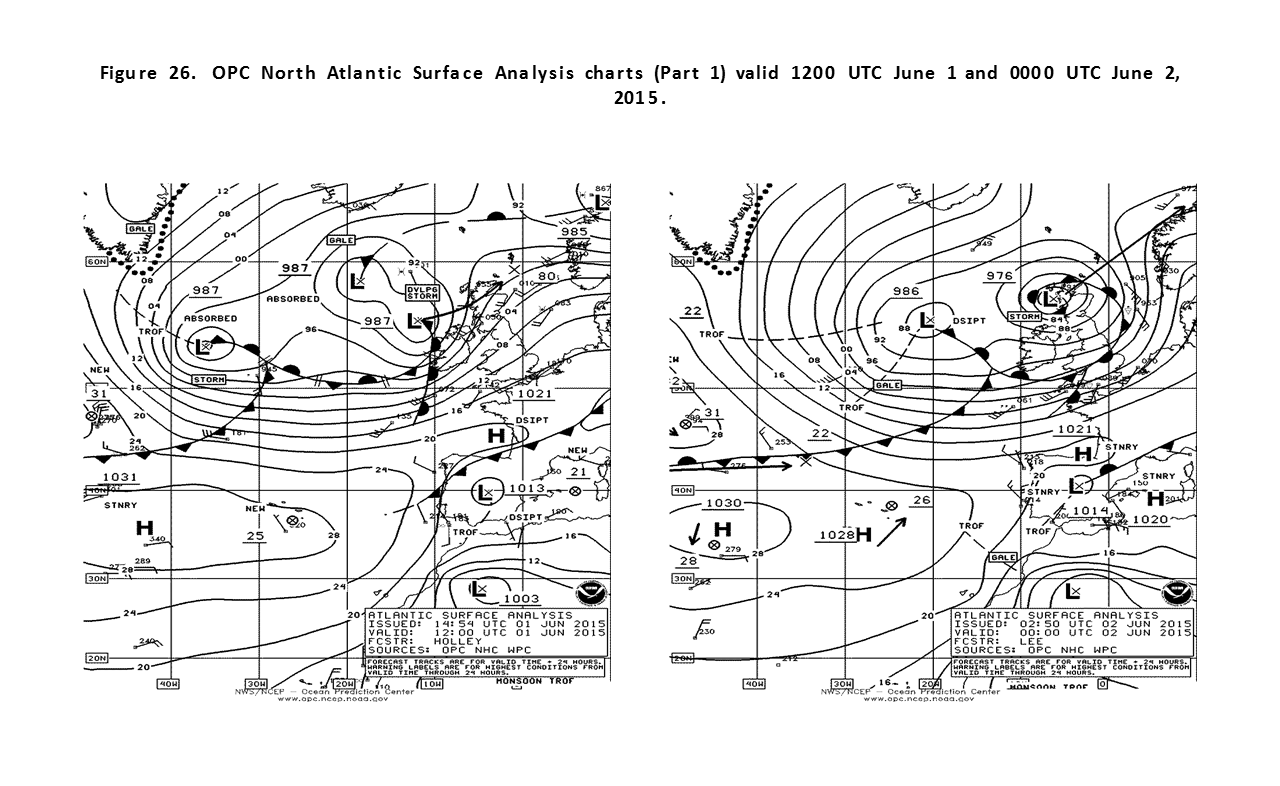
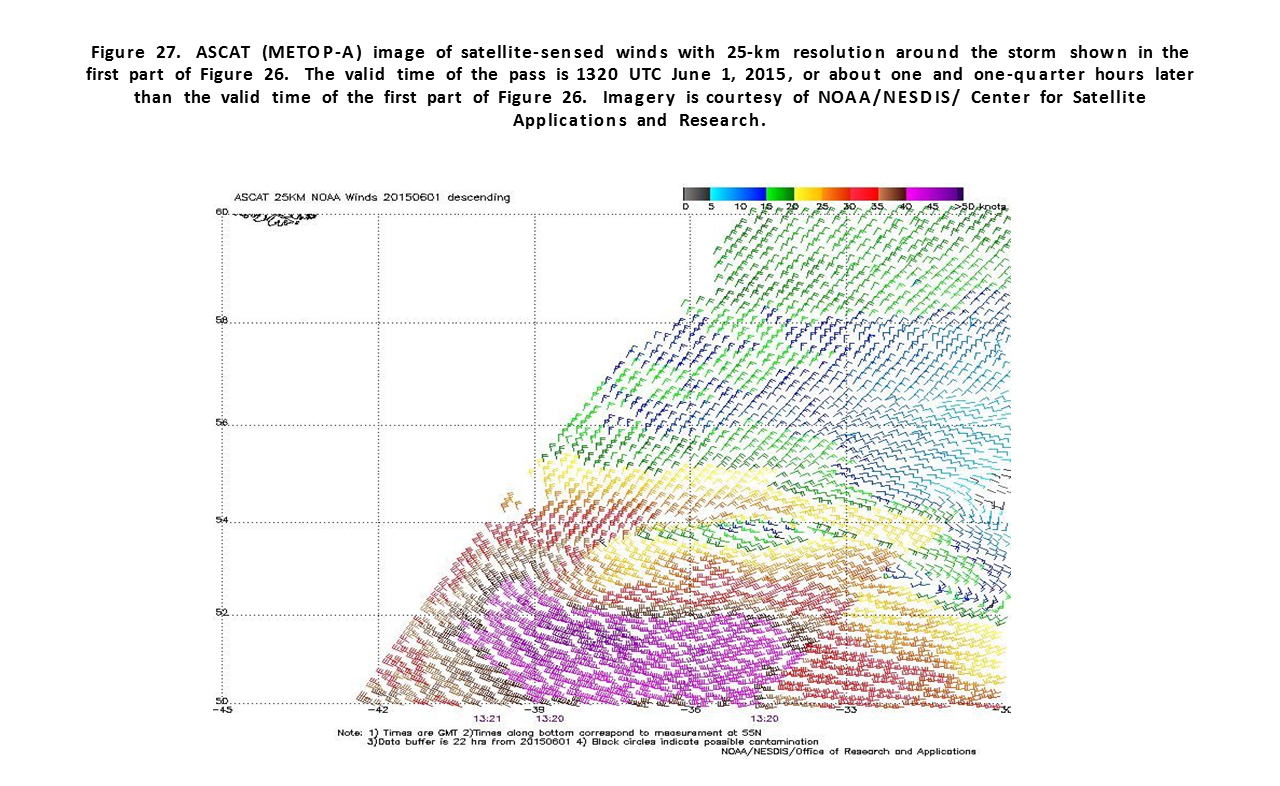
North Atlantic Storms, May 31-June 2: A complex system moved off the southern Labrador coast along 52N early on the 31st consisting of a primary and a secondary low (Figure 24, secŁond part). Figure 26 shows the primary low becoming a storm in the first part and the secondŁary low intensifying near the British Isles, with both attaining their lowest central pressures in the second part, 12 hours later. The ASCAT imagery in Figure 27 shows winds of 45 kts with the primary system with even a few 50 kts retrievals. The SHIP (BATFR03) (50.4N 1W) reported southwest winds of 50 kts south of the secondary storm at 0000 UTC June 2nd. The TYCO RESPONDER (V7CY9) at that time reported west winds of 40 kts and 11.9 m seas (39 ft), with the author uncertain of the accuracy of the reported seas. Both cyclones weakened thereafter.
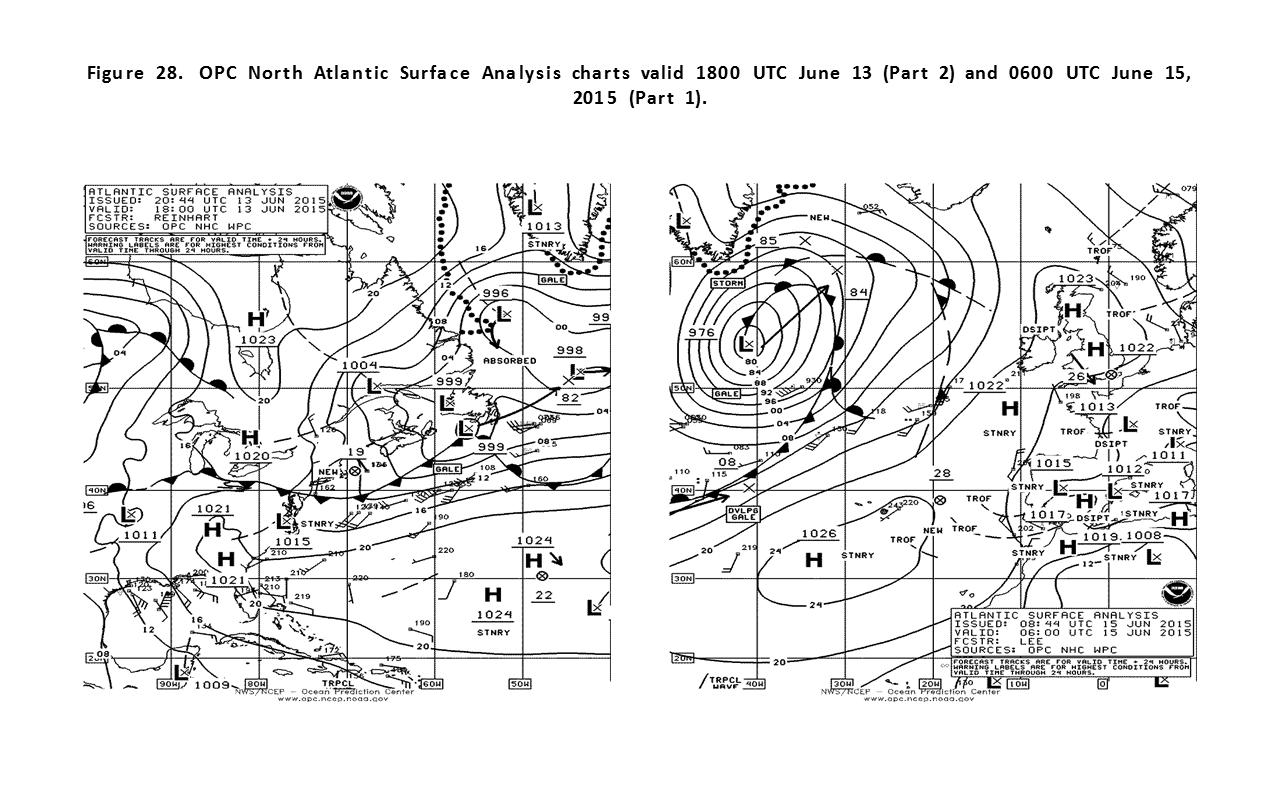
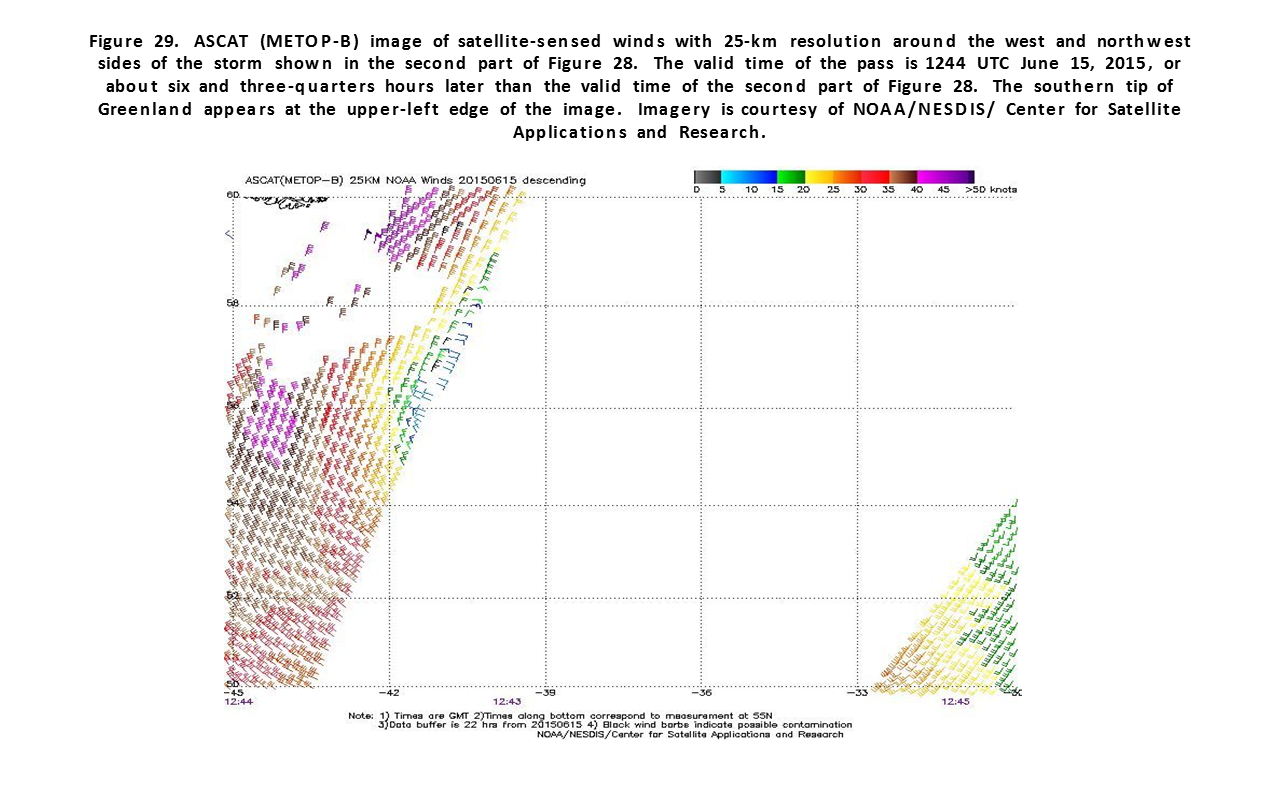
North Atlantic Storm, June 14-16: An area of low pressure moved off the New England coast early on June 13th and moved northŁeast, becoming a gale 12 hours later near Newfoundland and a storm force low over the central waters at 0600 UTC on the 15th with an unusually deep 976 hPa center (Figure 28). An ASCAT-B image from 1244 UTC June 15th (Figure 29) shows a swath of stronger northerly winds to 50 kts to the west and northwest of the cyclone center. The TYCO RESPONDER (V7CY9) encountered southŁeast winds of 45 kts near 50N 35W at 1200 UTC on the 15th. The cyclone subsequently driftŁed into the east Greenland waters and weakened during the following two days.
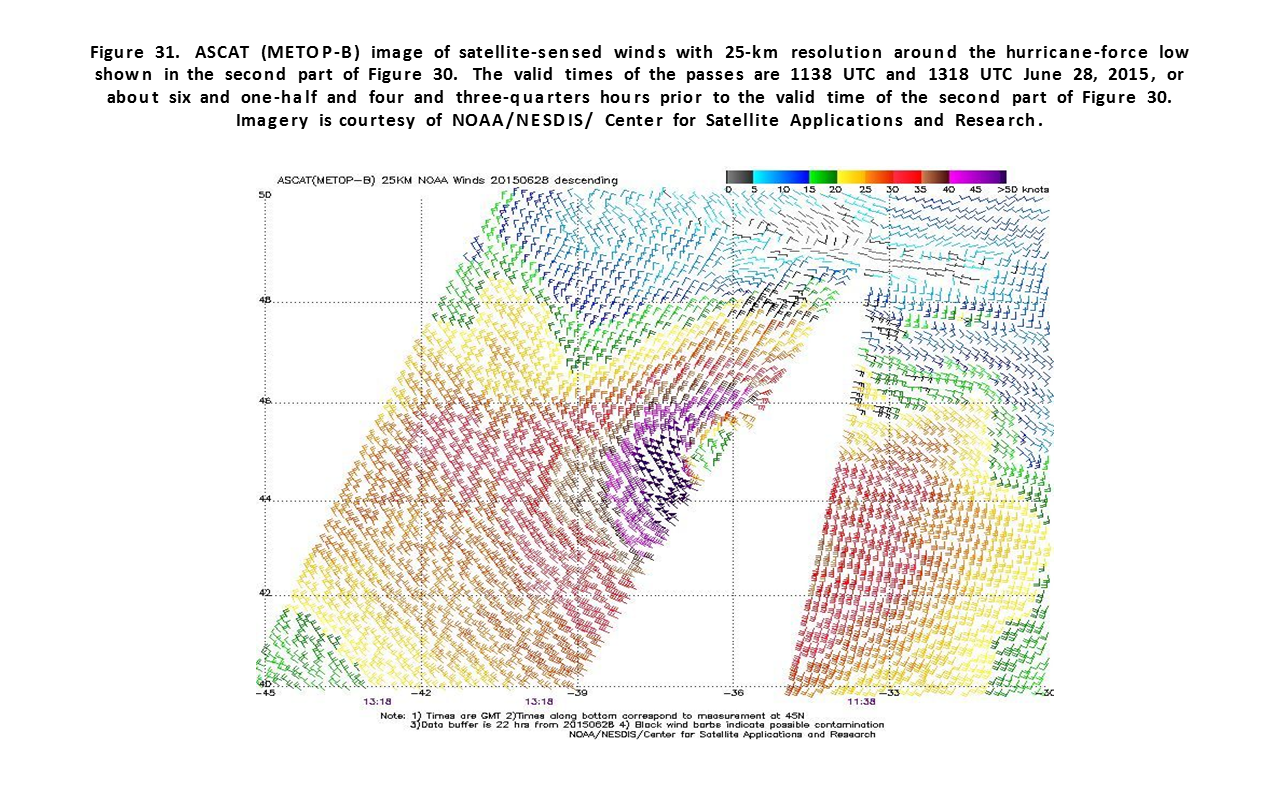
North Atlantic Storm, June 27-29: This cyclone was one of two summer hurricane force events in 2015, which are rare. It origiŁnated as a low pressure wave near the Mid-Atlantic Coast of the U.S. early on June 26th and moved east northeast and rapŁidly intensified after 0000 UTC on the 28th. The central presŁsure dropped 14 hPa in only 12 hours after 0600 UTC on the 28th and the lowest central pressure was 982 hPa 46N 34W (Figure 30). With no ships nearby reporting more than 40 kts, an ASCAT-B pass revealed winds to 60 kts Figure 31), which would support a hurriŁcane force label. A slow weakŁening trend followed, with winds diminishing to gale force the
next day and then sub-gale as the system stalled over the north central waters by July 2nd.
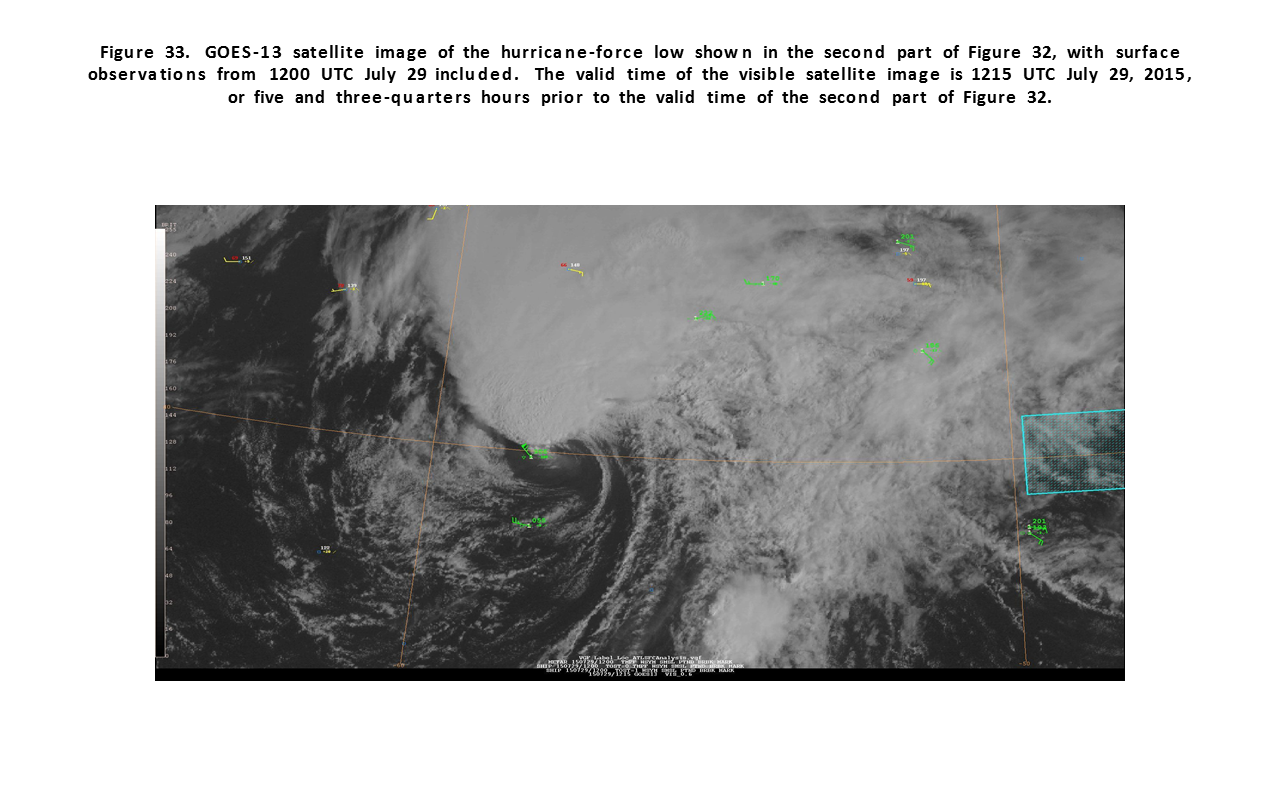
North Atlantic Storm, July 28-29, August 2-3: Low pressure originating off the southeast U.S. coast moved northeast and developed into a gale late on July 28th before rapidly intensifying to hurricane force the next morning (Figure 32). The central pressure fell 16 hPa in only 12 hours after 0600 UTC on the 29th. Figure 33 is a visiŁble satellite image of the cyclone with a ship plotŁted near the center, the INDEPENDENCE II (WGAX) near 40N 58W reporting northwest 65 kts. The ship reported that its pressure had fallen 14.4 hPa in 6 hours. At 1800 UTC, six hours later, on the 29th the OCEAN GIANT (WDG4379) reported west winds of 70 kts and 6.7 m seas (22 ft). The satellite image indicates frontal features but ASCAT imagery revealed a compact core of strong winds.After weakening to a gale the next day the cyclone moved into the eastern North Atlantic over the next two days and then reintenŁsified into a storm force low late on August 2nd and early on the 3rd with a central pressure as low as 977 hPa before weakening again and passing east of Iceland on the 6th.
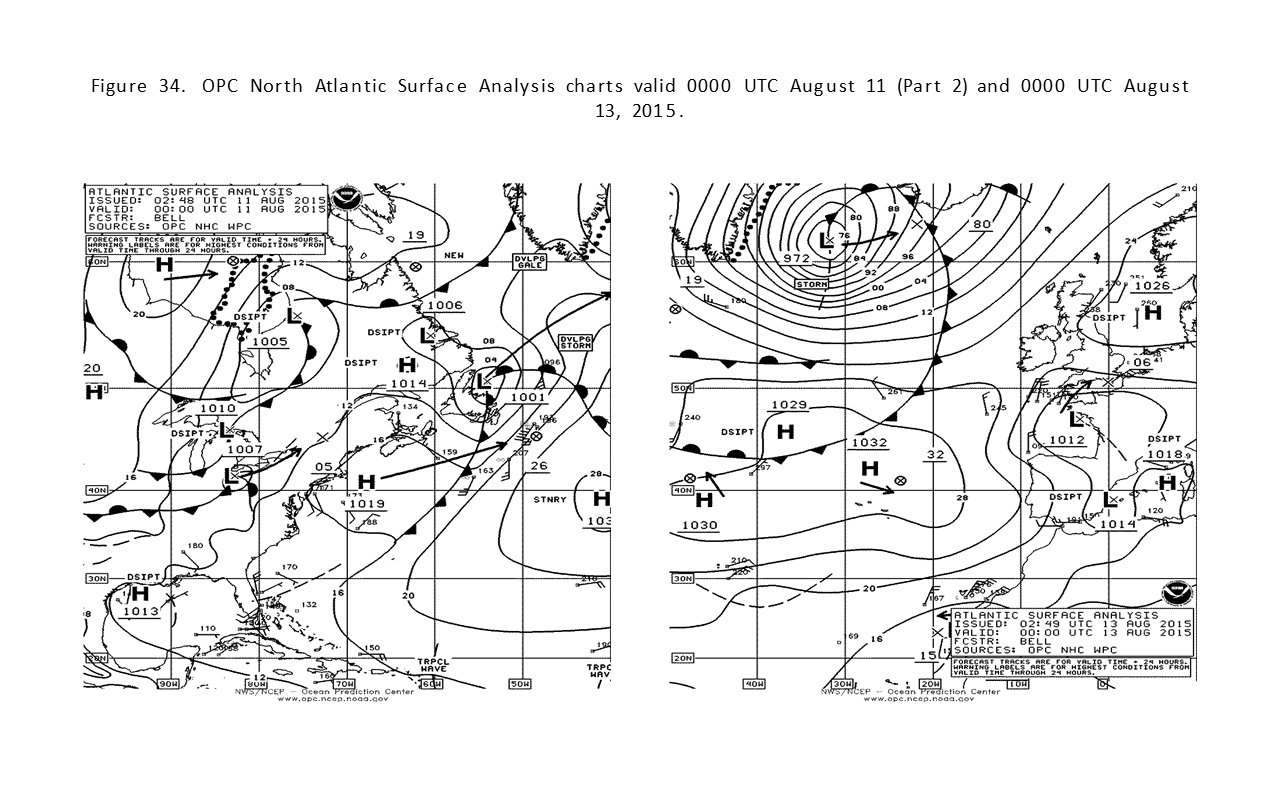
North Atlantic Storm, August 11-13: Initial development of this deep low was as a frontal wave moving off the North Carolina coast early on the 7th. The cyclone passed near Sable Island two days later and then after passing the island of Newfoundland began to intensify, develŁoping storm force winds by 1200 UTC on the 11th. Figure 34 shows the final development over a two day period with the cyclone at maxiŁmum strength in the second part. The SHIP (BATEU00) near 62N 41W reported northwest winds of 45 kts at 1400 UTC on the 12th. The cyclone subsequently stalled and weakened near Iceland late on the 13th and dissipated by the 16th.
References
1. Sanders, Frederick and Gyakum, John R., Synoptic-Dynamic Climatology of the "Bomb", Monthly Weather Review, October 1980.
2. Ocean Surface Winds, http://manati.star.nesdis.noaa.gov/products.php
3. VonAhn, Joan. and Sienkiewicz, Joe, "Hurricane Force Extratropical Cyclones Observed Using QuikSCAT Near Real Time Winds", Mariners Weather Log, Vol. 49, No. 1, April 2005.
4. Bancroft, George, "Marine Weather Summary, North Pacific Area, September 2014 to February 2015", Mariners Weather Log, December 2015.
5. Saffir-Simpson Scale of Hurricane Intensity: http://www.nhc.noaa.gov/aboutsshws.php
6. Tropical Cyclone Reports, 2015, National Hurricane Center,
http://www.nhc.noaa.gov/data/tcr/index.php?season=2015&basin=atl
7. Monthly Atlantic Tropical Weather Summary, http://www.nhc.noaa.gov/text/MIATWSAT.shtml
8. Central Pacific Tropical Weather Summary, http://www.prh.noaa.gov/cphc/summaries/
9. Frequently Asked Questions, http://www.usno.navy.mil/JTWC/