Mean Circulation Highlights and Climate Anomalies September through December 2015
Anthony Artusa, Meteorologist, Operations Branch,
Climate Prediction Center NCEP/NWS/NOAA
All anomalies reflect departures from the 1981-2010 base period.
September - October 2015
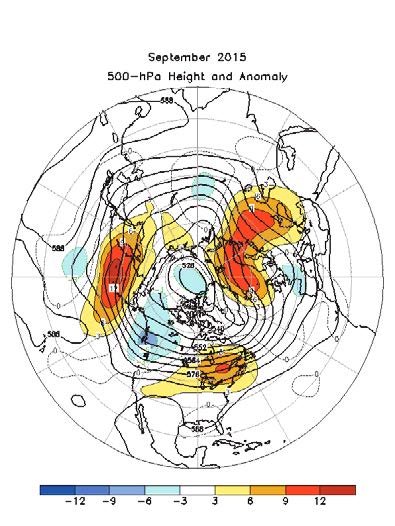
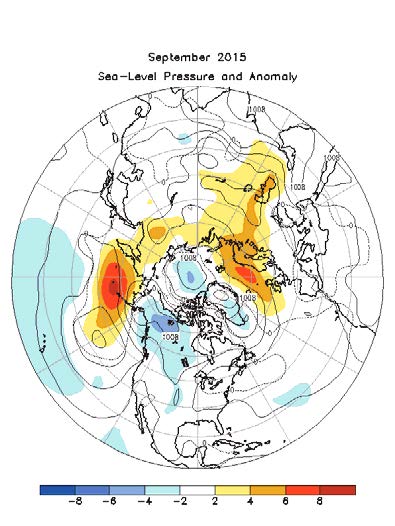
The mid tropospheric flow pattern during September featured above average 500 hPa heights over the high latitudes of the North Pacific Ocean, the northeastern quadrant of the contiguous U.S., eastern Canada, Scandinavia, and western Russia, and below average heights over western Canada and western Europe Figure 1. The sea level pressure (SLP) pattern mirrored the more pronounced features of the circulation pattern Figure 2.
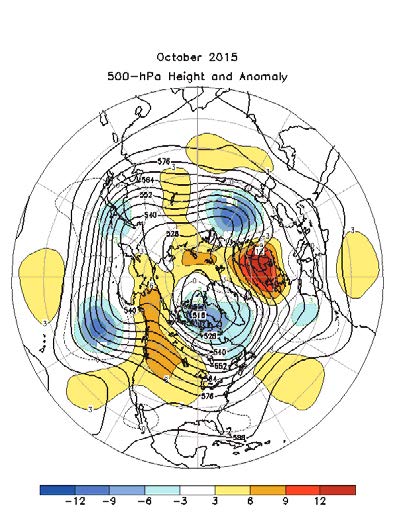
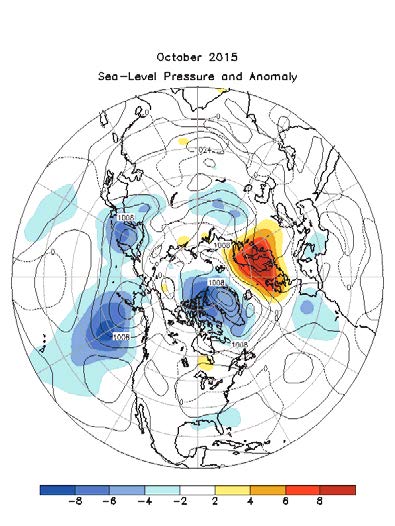
The October 500 hPa mean circulation featured above average heights over much of western North America and Scandinavia, and below average heights over the high latitudes of the North Pacific, eastern Canada, the eastern North Atlantic, and west central Russia Figure 3. The SLP pattern for October generally mirrored the 500 hPa height anomaly pattern Figure 4.
The Tropics
Sea surface temperatures (SSTs) were above average across the equatorial Pacific during both September and October, and the monthly Nino 3.4 index values were +2.3C and +2.5C, respectively. The depth of the 20C isotherm (oceanic thermocline) remained above average across the eastern equatorial Pacific in September and October, with corresponding subsurface temperatures 1-6C above average. The low level westerly wind anomalies remained strong across much of the equatorial Pacific (September and October). Deep, tropical cumuliform clouds and thunderstorm activity was enhanced over the central and eastern equatorial Pacific, and suppressed over Indonesia and the western equatorial Pacific. These oceanic and atmospheric anomalies collectively reflect a continuation of strong El Nino conditions.
November - December 2015
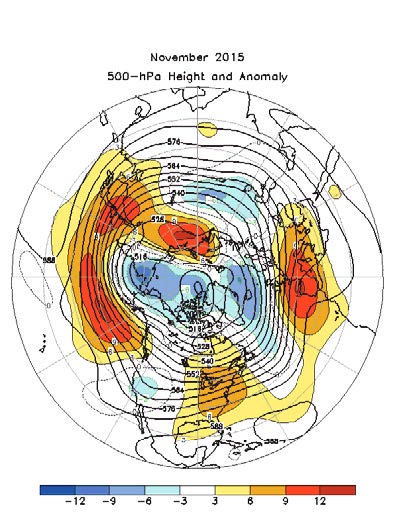
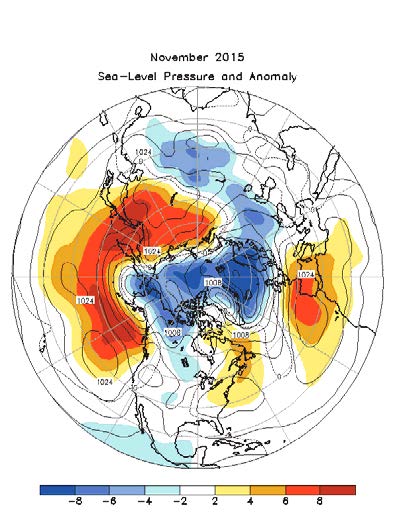
The mean 500 hPa circulation during November was characterized by above average heights over the central North Pacific, eastern North America, southern Europe, and eastern Asia, and below average heights over the western contiguous U.S., the polar region and central Russia Figure 5. The sea level pressure and anomaly map (Figure 6) generally mirrors the 500 hPa pattern.
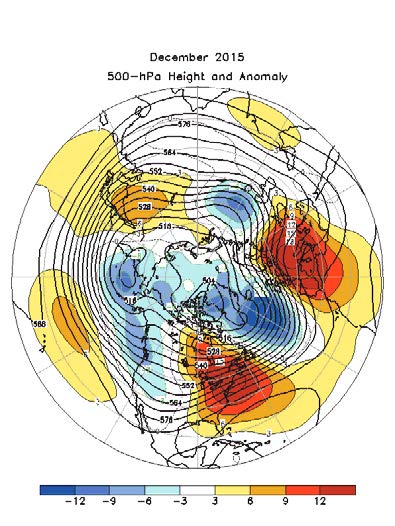
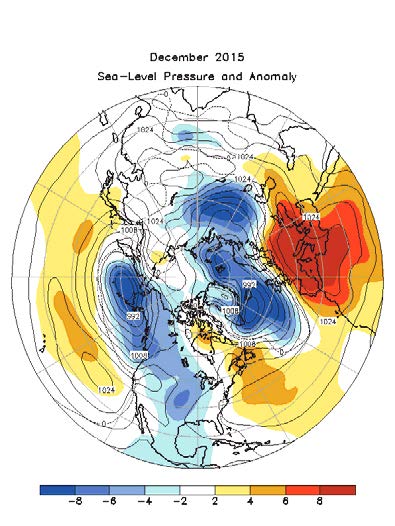
During December, the 500 hPa circulation featured a high amplitude pattern, with above average heights over eastern North America, much of Europe and the Mediterranean region, and China, and below average heights over Greenland and the North Atlantic, western Russia, and from the Bering Sea and Alaska southeastward to the U.S. Pacific Northwest Figure 7. As is typically the case, the SLP pattern generally mirrors the mid tropospheric pattern Figure 8.
The high amplitude ridge over the eastern contiguous U.S. in December contributed to record warmth in many areas. Kennedy Airport in New York City reported high temperatures at least 5.5 Celsius degrees (10 Fahrenheit degrees) above normal for 19 of the month's 31 days. The largest departure (15.6 Celsius degrees above normal) occurred on Christmas Eve, in advance of a cool front, when the temperature topped out at 20.6 degrees C Reference 3.
The Tropics
Strong and mature El Nino conditions continued during November and December 2015. Sea surface temperatures (SSTs) were well above average across the central and eastern equatorial Pacific. The latest monthly Nino 3.4 indices were +3.0C (Nov) and +2.8 (Dec). The depth of the 20C isotherm (oceanic thermocline) was above average over the eastern equatorial Pacific, and the corresponding subsurface temps ranged from 1-7C above average in that region. Low level westerly wind anomalies and upper level easterly wind anomalies remained strong across the central and eastern equatorial Pacific. Enhanced convection persisted over the central equatorial Pacific, and suppressed convection was observed across Indonesia and the western equatorial Pacific. This anomalous convection pattern is consistent with the current El Nino base state. However, in mid December, the pattern was temporarily disrupted as convection from the eastern Indian Ocean shifted eastward across the Maritime Continent and northern Australia. This was related to the Madden Julian Oscillation (MJO), which is a mode of sub seasonal variability that operates on a higher frequency time scale than El Nino Reference 4. In general, an MJO wave (with alternating regions of rising and sinking motion) makes a complete circuit of the global tropics in 30-60 days. This is a clear example of destructive interference (offsetting) between the lower frequency El Nino and the higher frequency MJO.
References
1. http://www.ncdc.noaa.gov/sotc/national/2015/10
2. http://www.weather.gov/chs/HistoricFlooding-Oct2015
3. http://w2.weather.gov/climate/index.php?wfo=okx
Back to top