Buoy Measurements of Wave Steepness during Hurricane Katrina
Professor S. A. Hsu
Louisiana State University
Email: shihahsu@outlook.com
Abstract: During Hurricane Katrina in 2005 over NDBC buoys 42003 and 42001 located on east and west side, respectively, along its northward track over the Gulf of Mexico, it is demonstrated that on the right side, the seas are dominated by the wind-wave interaction, whereas on the left, by the wind-wave-swell. This strong evidence further supports the long standing notion by the mariners that the left semicircle in a tropical cyclone is a better region for safe navigation due to its lower wave steepness and wind speed.
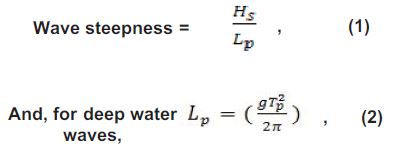
According to the National Data Buoy Center (www.ndbc.noaa.gov), wave steepness is the ratio of wave height to wave length and an indicator of wave stability. Operationally, here we use the measurements available routinely via NDBC that,

Here Hs and Lp are significant wave height and peak wavelength for the combined sea and swell spectrum, respectively, g is the acceleration of gravity, and Tp is the peak wave period. All parameters are measured routinely by the NDBC.
In order to minimize the swell effects, we use the criterion for the wave steepness set forth by Drennan et al. (2005) such that, for the wind seas,

Now, according to Hsu (1988, p. 217), on the right side of the hurricane track, winds, waves, and swells are all traveling nearly the same direction, whereas on the left, they are opposing each other. These phenomena are illustrated in Figure 1 thru Figure 3. During Hurricane Katrina in 2005, two buoys, 42003 on the right side of the storm track and 42001 on the left, are employed in this study (see Figure 1). On the basis of aforementioned discussions, variations of the wave steepness on both sides of the track are analyzed and presented in Figure 2 and Figure 3 for the right and the left, respectively. It is clear that on the right, wind seas prevail and on left the seas are mixed with wind seas and swells. This strong evidence further supports the long standing notion by the mariners that the left semicircle in a tropical cyclone is a better region for safe navigation due to its lower wave steepness and wind speed.

Figure 1. Hurricane Katrina's Track and NDBC Stations. Katrina's track (in red with the start of each day numbered) is from the current positions of the National Hurricane Center's Forecasts/Advisories (Data source: http://www.ndbc.noaa.gov/hurricanes/2005/katrina/).

Figure 2. Variation of wave steepness on the wind speed on the right side of Katrina's track.

Figure 3. Variation of wave steepness on the wind speed on the left side of Katrina's track.
Acknowledgements:
Buoy measurements provided by NDBC are greatly appreciated.
References:
Drennan, W.M., Taylor, P.K.,Yelland, M.J. 2005. Parameterizing the Sea Surface Roughness, Journal of Physical Oceanography, 35: 835-848.
Hsu, S.A.1988. Coastal Meteorology, Academic Press, San Diego, CA
Back to top
