MARINE WEATHER REVIEW NORTH PACIFIC AREA March to August 2014
George P. Bancroft Ocean Forecast Branch, Ocean Prediction Center, College Park, MD NOAA National Center for Environmental Prediction
Introduction
The main storm track across the North Pacific was from near Japan northeast toward the Gulf of Alaska, but occasionally the upper air pattern became more amplified and caused developing cyclones to turn north toward the Kurile Islands or Sea of Okhotsk, where they would slow down and weaken. Others would form secondary low centers or originate in the eastern North Pacific and move toward Alaska or British Columbia. March brought late winter weather with five cyclones developing hurricane force winds and five cyclones with central pressures in the 960s hPa or below. There was one hurricane force low in April, the last of the season. Although May had none, it did produce a 968 hPa low in the middle of the month. Cyclonic activity weakened and shifted north in the summer. July was the least active month, producing no cyclones exceeding gale force.
Tropical activity appearing on OPCs oceanic radio facsimile charts consisted of one typhoon each in March, April and July, and a super typhoon with sustained winds of 130 kt or more that became an extratropical storm force low while moving through the Sea of Japan in August. Additionally there were two cyclones in August, a typhoon and a hurricane, which moved into OPCs high seas waters north of 30N and east of 160E and originated in the eastern tropical North Pacific.
Tropical Activity
Typhoon Faxai: Faxai formed as a tropical storm near 9N 150E at 1200 UTC March 1st with maximum sustained winds 35 kt with gusts to 45 kt. The cyclone drifted northeast over the next three days and intensified to a typhoon near 19N 152E by 1800 UTC on the 4th with maximum sustained winds of 75 kt with gusts to 90 kt. The cyclone then began to weaken, becoming a 60 kt tropical storm 12 hours later near 21N 154E and then a post tropical remnant low with gale force winds at 23N 156E 1800 UTC on the 6th. Weakening continued thereafter, with the low dissipating near 30N 173E at 0000 UTC on the 9th.
Typhoon Tapah: A non-tropical low near 11N 146E at 1200 UTC April 27 became a tropical depression six hours later with maximum sustained winds of 30 kt while drifting north, and then intensified to a tropical storm at 0000 UTC on the 28th with maximum sustained winds of 50 kt with gusts to 60 kt, and then at 0000 UTC on the 29th became Typhoon Tapah near 16N 147E with maximum sustained winds 65 kt with gusts to 80 kt. A weakening trend began on the 29th with the cyclone drifting northwest, and the maximum sustained winds lowered to 35 kt (minimal tropical storm) near 21N 145E at 0000 UTC May 1st. The cyclone was downgraded to a tropical depression six hours later and to a remnant low after another six hours. Dissipation followed by May 2nd.
Typhoon Neoguri: A non-tropical low near 10N 147E at 1800 July 2nd drifted northwest and became Tropical Depression 08W six hours later and a minimal tropical storm near 12N 143E 1800 UTC on the 3rd. Rapid strengthening followed; with the system becoming Typhoon Neoguri near 15N 139E at 1800 UTC on the 4th with maximum sustained winds 65 kt with gusts to 80 kt. Six hours prior, a vessel with a SHIP call sign reported northwest winds of 40 kt and 4.6 m seas (15 ft) near 13N 138E. At 1800 UTC on the 5th Neoguri developed a maximum intensity of 120 kt for sustained winds and gusts to 145 kt. This is at Category 4 on the Saffir-Simpson scale (Reference 4). The cyclone maintained this intensity over the following twenty- four hours and passed west of 130E, the western boundary of the National Weather Services unified surface analysis. At 0600 UTC on the 6th a vessel with a SHIP call sign reported northeast winds of 45 kt and 7.0 m seas (23 ft) near 17N 134E. Neoguri weakened west of the area and then turned back toward the northeast, passing near 32N 131E as a tropical storm with maximum sustained winds 45 kt at 0000 UTC July 10th. The cyclone then passed near Tokyo at 0000 UTC on the 11th with similar intensity and then became a post tropical/extratropical gale near 37N 144E with a 991 hPa central pressure six hours later. A slow weakening trend then continued as the cyclone moved northeast, with no redevelopment into a strong extratropical low.
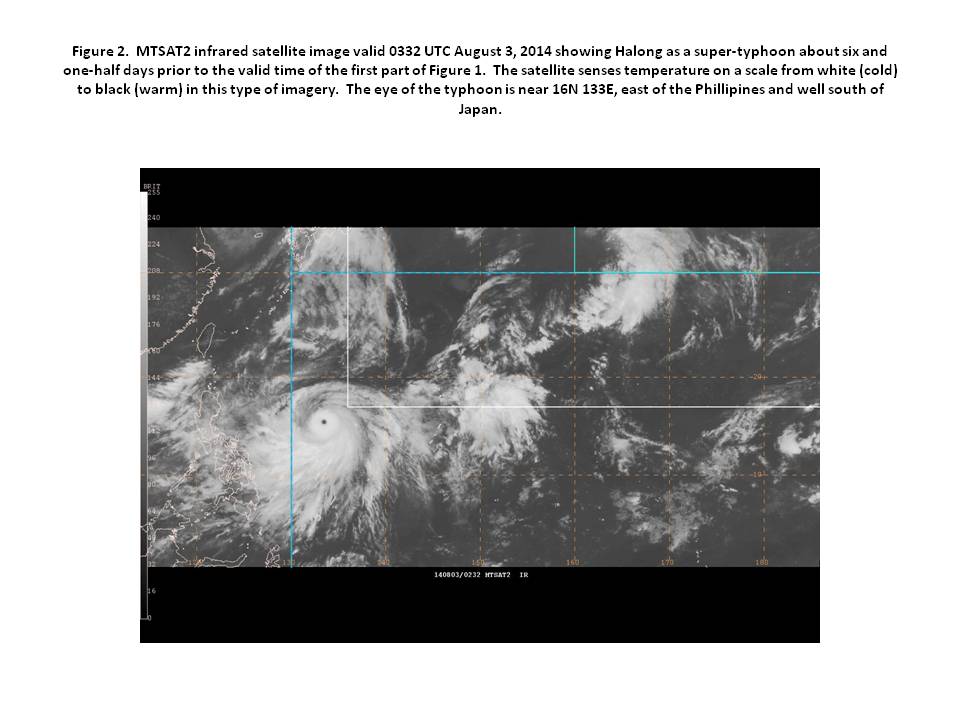
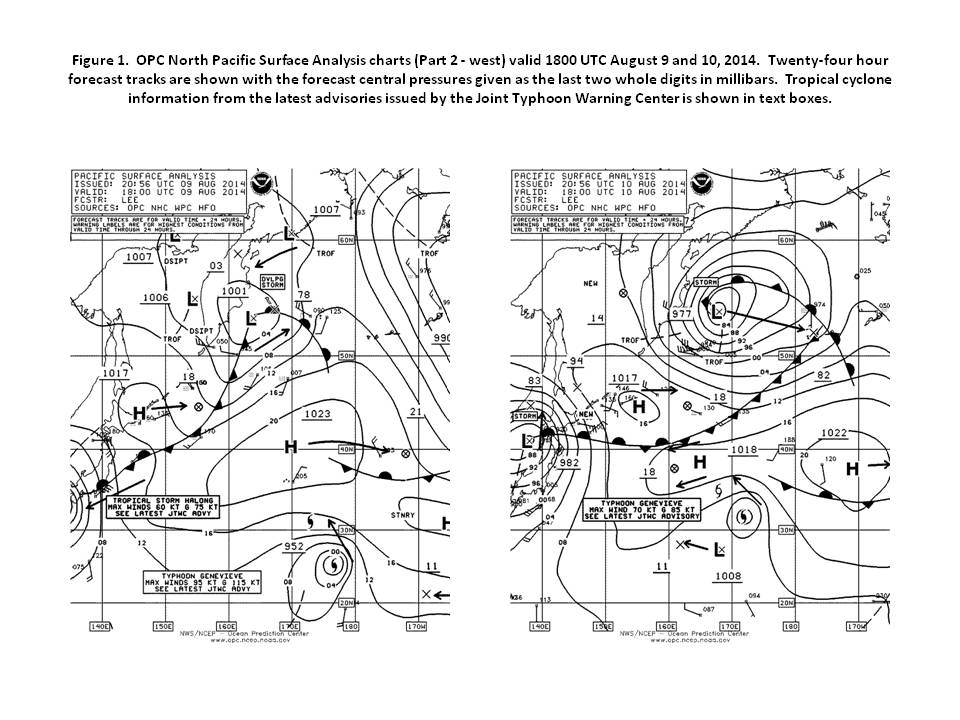
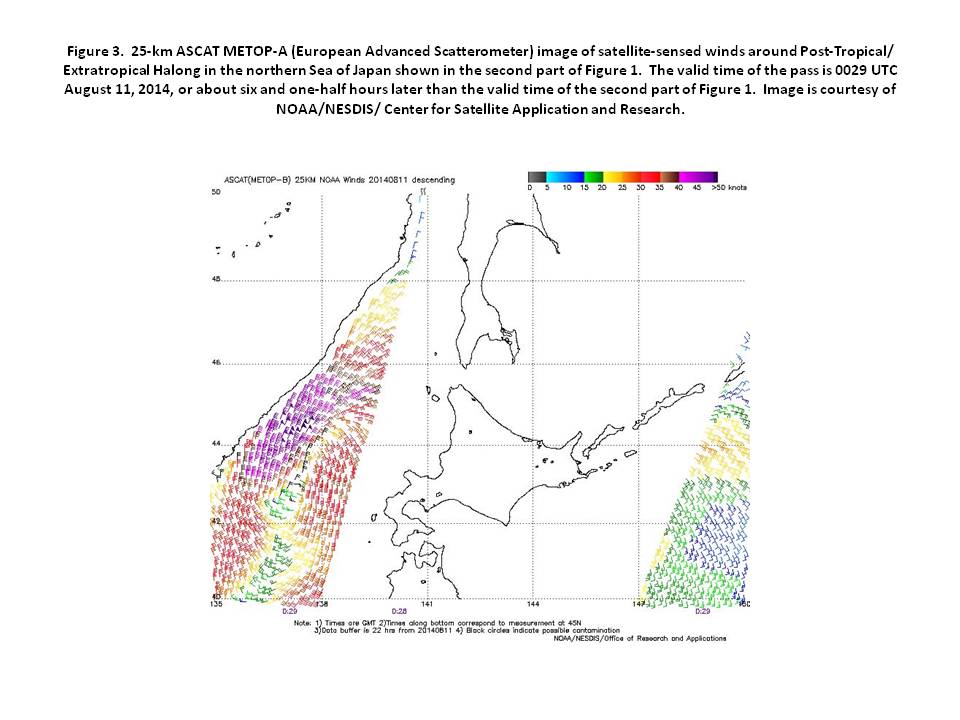
Super-Typhoon Halong: A non-tropical low near 11N 155E at 1800 UTC July 26 drifted northwest over the next two days and became Tropical Depression 11W near 13N 149E at 1800 UTC on the 28th and a tropical storm six hours later with maximum sustained winds 45 kt with gusts to 55 kt. A vessel using the SHIP call sign reported northeast winds of 56 kt and 5.2 m seas (17 ft) near 21N 132E at 1800 UTC on the 30th. The cyclone became Typhoon Halong south of Japan near 15N 137E at 1800 UTC August 1st with maximum sustained winds 75 kt with gusts to 90 kt. Rapid intensification to a super typhoon followed over the next 18 hours, with Halong passing near 15N 135E with maximum sustained winds 135 kt with gusts to 165 kt at 1200 UTC on the 2nd. The maximum intensity was 140 kt for sustained winds and gusts to 170 kt with a central pressure of 918 hPa (27.11 inches), reached at 0000 UTC on the 3rd near 15N 134E. This placed it at Category 5 on the Saffir-Simpson wind scale, the highest in a range of 1 to 5. An infrared satellite picture from MTSAT2 near this time (Figure 2) shows Halong with a well defined eye and a circular central dense overcast or eye wall within an expansive area of cirrus outflow. A weakening trend began on the 3rd as the cyclone drifted north along 130E over the next three days. The Northwest Shearwater (ZCAO7) near 13N 133E reported southwest winds of 45 kt and 3.7 m seas (12 ft) at 2100 UTC on the 3rd. The typhoon began a turn toward the northeast on the 6th and by 1200 UTC on the 7th the center passed near 26N 132E with an intensity of 75 kt for sustained winds. The cyclone passed over western Japan later on the 9th as a strong tropical storm. The APL Thailand (WCX8882) near 34N 137E reported southwest winds of 45 kt and 9.0 m seas (30 ft) at 0600 UTC on the 10th. Figure 1 depicts transition of Neoguri into a post tropical storm force low. Post tropical Neoguri passed near 43N 137W with a lowest central pressure of 979 hPa at 0600 UTC August 11th. At this time the Santa Cruz (LXCA) encountered southwest winds of 35 kt and 7.9 m seas (26 ft) near 40N 139E. The ASCAT image in Figure 3 reveals a vigorous circulation with 50 kt wind vectors northwest of the center. The cyclone subsequently drifted northeast to near Sakhalin Island later on the 12th, where its top winds weakened to below gale force.
Tropical Cyclone Genevieve: Genevieve originally formed as a tropical storm in the eastern Pacific tropical area near 12N 135W at 1200 UTC July 25th, an area monitored by the National Hurricane Center. Genevieve passed west of 140W on the 27th into the area monitored by the Central Pacific Hurricane Center, where it was classified as a tropical depression or even post- tropical while passing well south of Hawaii. Rapid intensification followed late on August 5th, with the cyclone becoming Hurricane Genevieve near 13N 176W at 1200 UTC on the 6th and Super Typhoon Genevieve near 15N 179.7E at 0600 UTC on the 7th, after passing 180W into the Joint Typhoon Warning Centers area of responsibility. The peak intensity was 140 kt for sustained winds and gusts to 170 kt, reached six hours later. A weakening trend began by the 8th as the cyclone turned northward toward cooler water. Figure 1 shows a weakening Typhoon Genevieve moving north of 30N into OPCs high seas area of responsibility (north of 30N east of 160E and east of a line from 50N 160E to the Bering Strait. Rapid weakening followed on the 10th and 11th with Genevieve becoming a post tropical remnant low late on the 11th near 34N 165E.
Hurricane Julio: Julio was another eastern tropical Pacific system which moved northwest into the Central Pacific Hurricane Centers (CPHC) area as a major hurricane 0600 UTC August 8th and then weakened at first while passing north of Hawaii. By 1200 UTC on the 12th its intensity was down to 55 kt for sustained winds while passing near 29N 157W (tropical storm strength). Julio then re intensified into a hurricane upon moving north into OPCs high seas area, usually a hostile environment for tropical cyclones. One of the hurricane discussions issued by CPHC indicated that sea surface temperatures north of Hawaii were unusually high. The cyclone developed maximum sustained winds of 70 kt with gusts to 85 kt near 31N 159W at 1800 UTC on the 13th. Julio then drifted north and weakened to a tropical storm the next day and to a post tropical low at 1800 UTC on the 15th. The cyclone then dissipated near 39N 159W by the 18th.
Other Significant Weather of the Period
Northwest Pacific Storm, March 5-7: A developing cyclone coming from just south of Japan late on March 4 rapidly intensified while passing east of Japan on the 5th . The central pressure fell an impressive 35 hPa in the twenty-four hour period ending at 0600 March 6th , when the central pressure reached 967 hPa over the central Kurile Islands. The cyclone briefly developed hurricane force winds in the southern Sea of Okhotsk early on the 6th before stalling and weakening. The Zim Chicago (A8SI9) near 37N 143E reported south winds 45 kt at 1200 UTC on the 5th. The ship UGSM (44N 137E) encountered northwest winds of 50 kt at 0000 UTC on the 7th. The Ludwigshafen Express (DILE) reported southeast winds of 55 kt and 6.7 m seas (22 ft) near 45N 151E at 0000 UTC on the 6th.
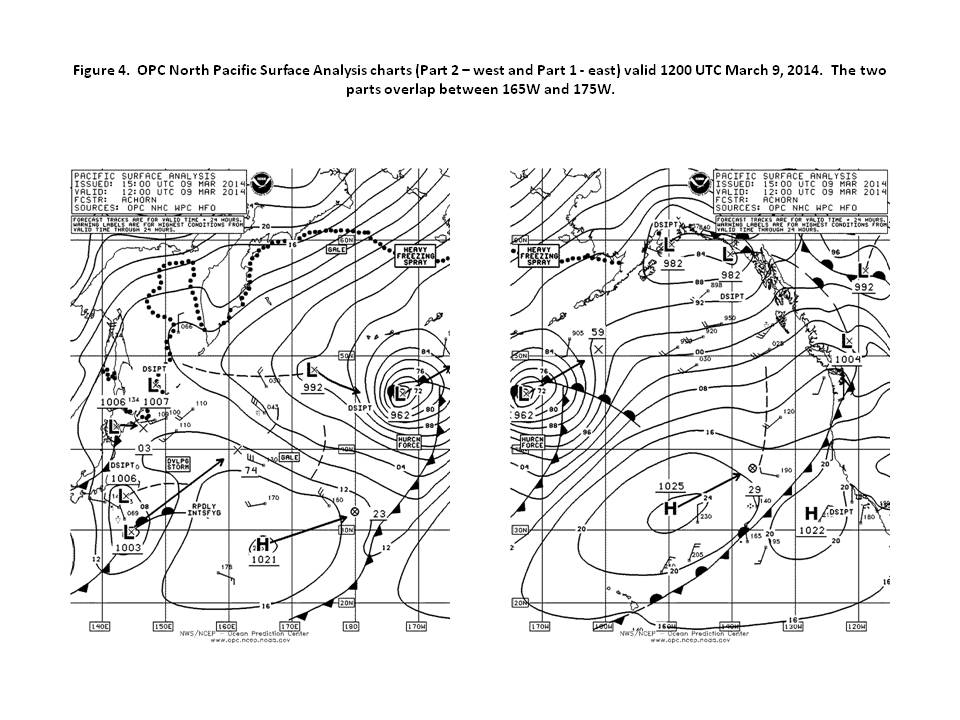
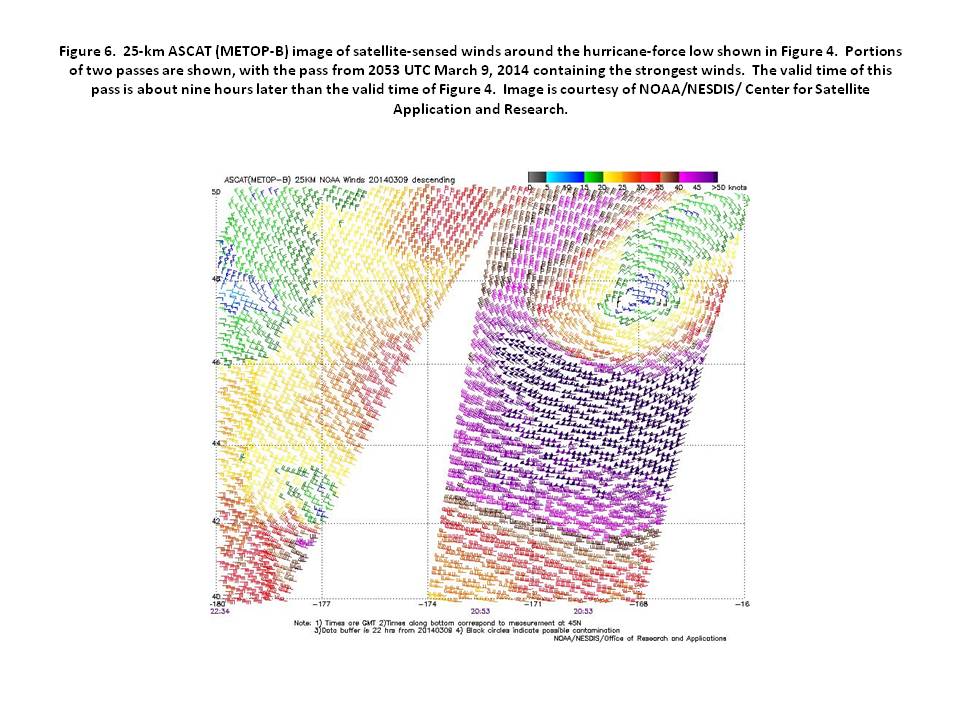
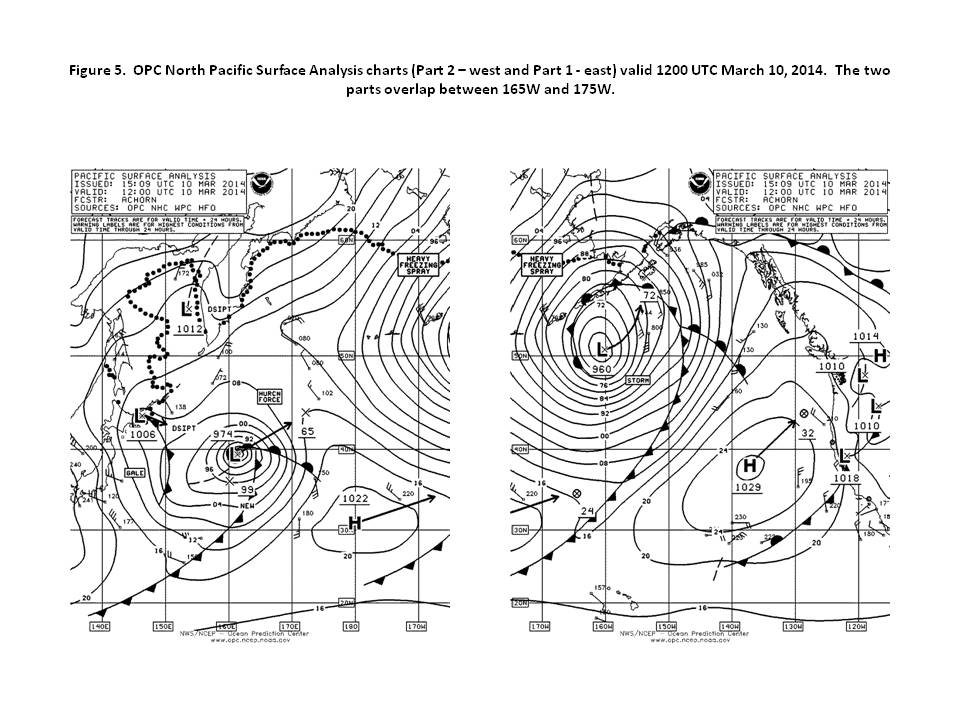
North Pacific Storm, March 8-10: Low pressure forming at the end of a front southeast of Japan at 0600 UTC March 7th moved northeast and rapidly intensified over the central Pacific, resulting in the central Pacific system in Figure 4. The central pressure fell 29 hPa in the twenty-four hour period ending at 1800 UTC on the 9th. The lowest central pressure was 958 hPa at 1800 UTC on the 9th, making it the deepest non tropical cyclone of the six month period. The ASCAT image in Figure 6 reveals a wind maximum of 50 to 60 kt on the south side of the well defined circulation center. The Antwerpen Express (DGAF) near 51N 148W reported south winds 50 kt and 9.0 m seas (30 ft) at 0000 UTC on the 11th. Figure 5 shows the cyclone becoming mature and expanding in size while beginning to weaken. Winds weakened to gale force the next day and then, late on the 12th, moved inland.
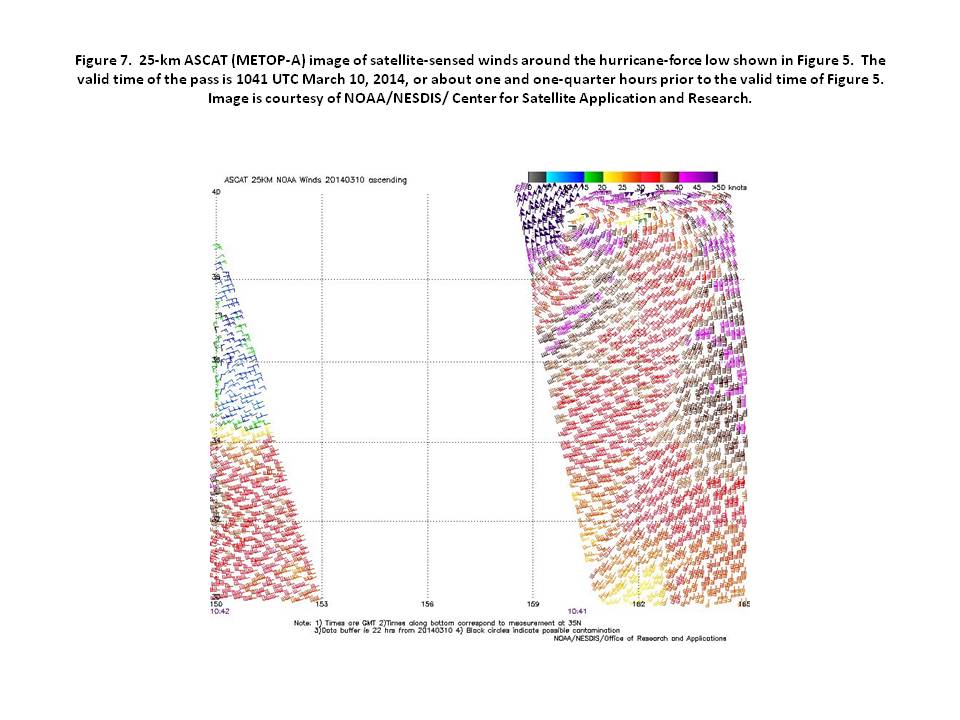
North Pacific Storm, March 9-12: The next hurricane force low is shown developing over the western waters in Figure 4 and Figure 5. The central pressure fell 30 hPa in the twenty-four hour period ending at 1800 UTC on the 10th, but the cyclone attained its lowest central pressure of 965 hPa twenty-four hours later near 45N 178E when top winds were down to storm force. An ASCAT image (Figure 7) near the valid time of Figure 5 shows a more compact cyclone with the highest winds, up to 65 kt, in the northwest semicircle. The system maintained storm force winds until dissipation near 46N 170W at 1800 UTC on the 12th, as a new low formed to its northeast.
North Pacific Storm, March 13-15: A low pressure system tracked east northeast across the Pacific, starting as a storm force low with a relatively modest pressure of 1001 hPa near 39N 156E at 1200 UTC March 11th. After weakening over the central waters, the cyclone re-intensified east of 170W and developed hurricane force winds on the 14th. The lowest central pressure was 978 hPa near 44N 153W at 1800 UTC on the 14th. An ASCAT (METOP-B) image from 2049 UTC on the 14th revealed a swath of west to northwest winds 50 to 60 kt on the south side of the cyclone, somewhat like Figure 6 for larger and more intense event but a smaller area. The Parana (ZDNC4) encountered north winds of 45 kt and 8.0 m seas (26 ft) near 48N 154W at 0000 UTC on the 15th. The cyclone subsequently turned toward the northeast and weakened to a gale the next day and moved inland on the 16th.
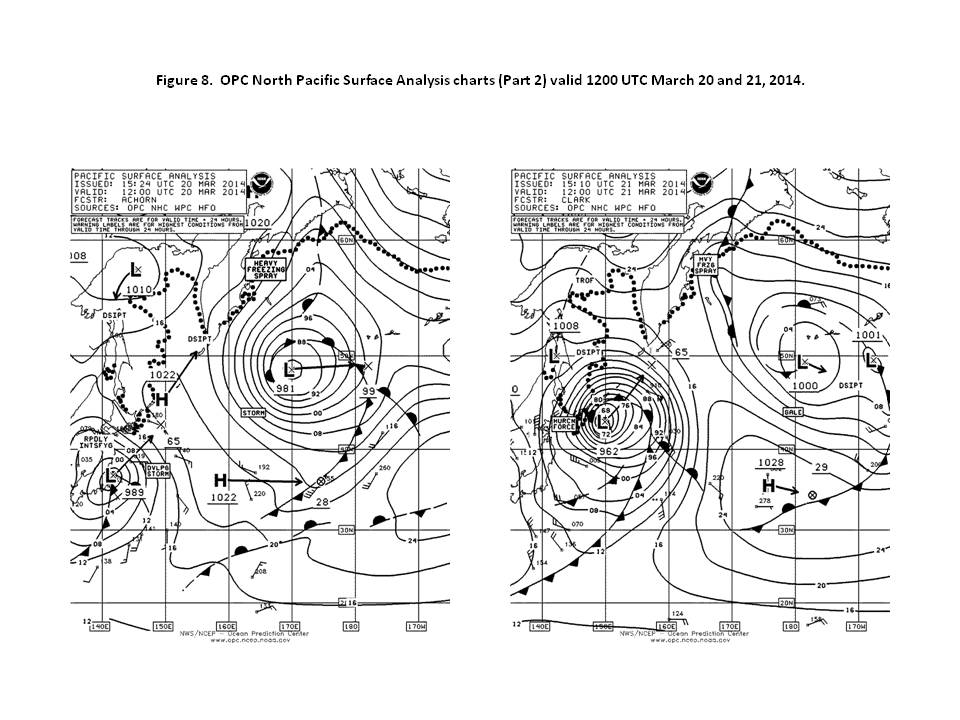
Western North Pacific Storm, March 20-22: Low pressure originating over southern Japan, already a gale at 0600 UTC on the 20th moved northeast and rapidly intensified over the next thirty hours. A drop in central pressure of 27 hPa in twenty four hours led to a lowest central pressure of 962 hPa near 43N 150E at 1200 UTC on the 21st (Figure 8). The ASCAT data in Figure 9 is a partial view of the winds around this cyclone, and it may miss the highest winds. It does show winds of at least 60 kt on the south side of this system. The Albert Maersk (OUON2) near 46N 157E reported east winds of 60 kt and 8.8 m seas (29 ft)at 1200 UTC on the 21st. The Baltic Cougar (V7AA2) near 49N 155E encountered northeast winds of 45 kt and 10.7 m seas (35 ft) at 0000 UTC on the 22nd. The cyclone began to weaken late on the 21st and its top winds dropped to gale force late on the next day.
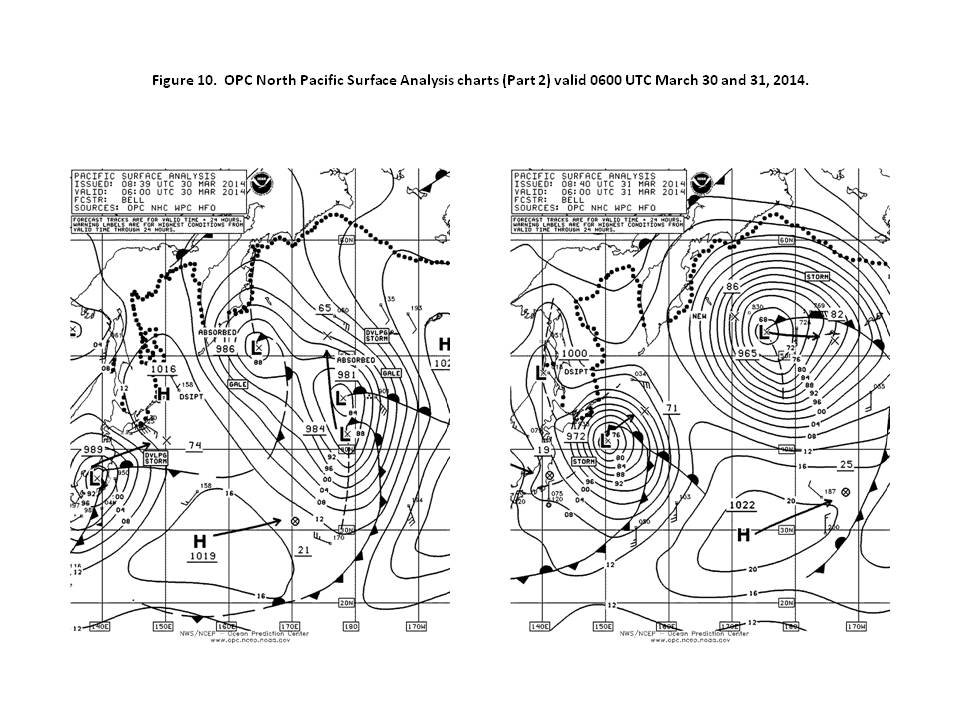
Western North Pacific Storm, March 30-April 2: Figure 10 depicts the development of the next low moving off Japan, emerging already as a strong system. The second part of Figure 10 shows the cyclone at maximum intensity. The Hanjin Vienna (DIBZ) near 45N 156E reported east winds of 68 kt at 1500 UTC on the 31st. The ship DGXT2 (43N 149E) reported northwest winds of 50 kt and 10.1 m seas (33 ft) at 0000 UTC April 1st. The ASCAT imagery in Figure 11 shows a swath of 50-55 kt wind retrievals. With the low bias of ASCAT at high wind speeds and the ship report noted above, this may be a hurricane force event. The cyclone subsequently moved slowly northeast and began to weaken late on May 1st, and reached the central Aleutians by the 3rd as a gale.
Northeastern Pacific Storm, April 17-19: Figure 12 shows the development of the seasons final hurricane force event. The cyclone originated as a weak low south of Japan. It tracked east northeast and developed storm force winds upon crossing 172W. The second part of Figure 12 shows the cyclone at maximum intensity. An ASCAT (METOP-A) pass from 1928 UTC April 18th shows a swath of northwest winds 50 to 55 kt but with a large data gap but is otherwise similar to Figure 11 for the March 30th April 2nd event. This was the last hurricane force low analyzed by OPC during the heavy weather season ending in the spring of 2014. At 0800 UTC on the 18th the APL Korea (WCX8883) encountered southwest winds of 49 kt near 40N 154W. Later, the Polar Resolution (WDJK) near 50N 135W reported southeast winds of 45 kt and 8.0 m seas (26 ft) at 0100 UTC on the 19th. Buoy 46036 (48.4N 133.9W) reported southwest winds of 35 kt and 8.0 m seas (26 ft) at 1500 UTC on the 19th, and highest seas 9.8 m (32 ft) seven hours later. The cyclone subsequently turned north into the Gulf of Alaska, stalled and drifted southeast through the 22nd with diminishing winds.
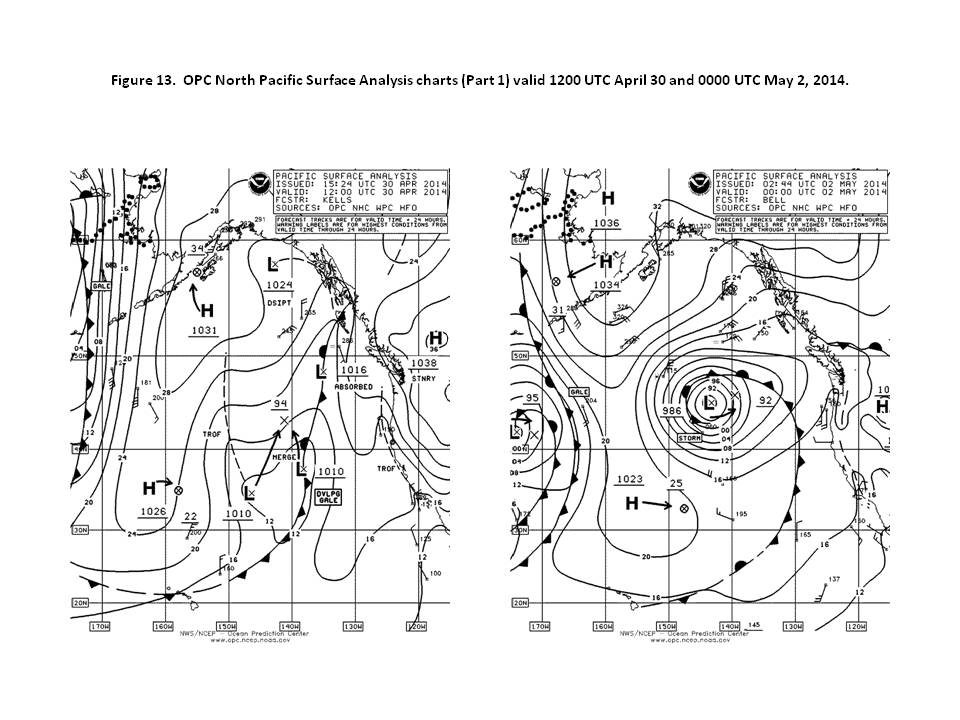
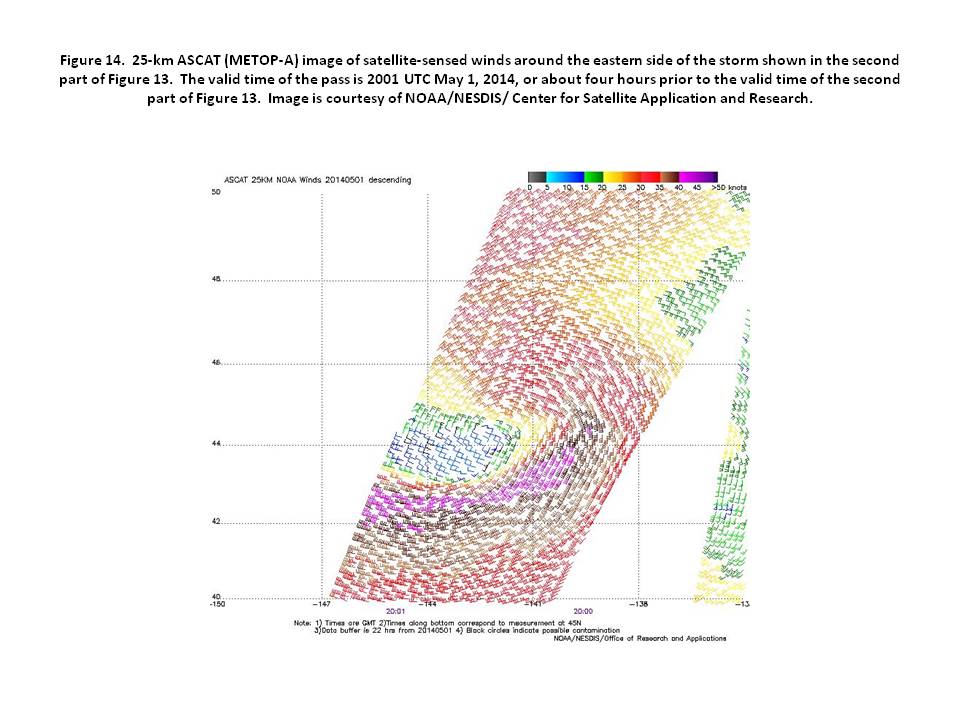
Eastern North Pacific Storm, April 30-May 2: The storm shown in the second part of Figure 13 formed from the merging of two weak lows west of California. The Matsonia (KHRC) near 43N 145W reported northwest winds of 38 kt and 6.7 m seas (22 ft) at 1500 UTC May 2nd. Figure 14 is an ASCAT image of the storm showing a swath of 40 kt or more around the south and southeast sides of the cyclone, where there are most likely to be storm force winds. The system subsequently drifted northeast over the next three days with diminishing winds.
Northwestern Pacific Storm, May 15-16: A low pressure wave south of Japan rapidly developed as it moved east of Japan toward the Kurile Islands. The lowest central pressure was 968 hPa making it the deepest low in the May to August period. The ASCAT image in Figure 16 shows an area of 35 to 40 kt with a possible isolated 45 kt around the north side of the cyclone. The system subsequently drifted northeast near the Kurile Islands with its top winds diminishing to below gale force late on the 18th.
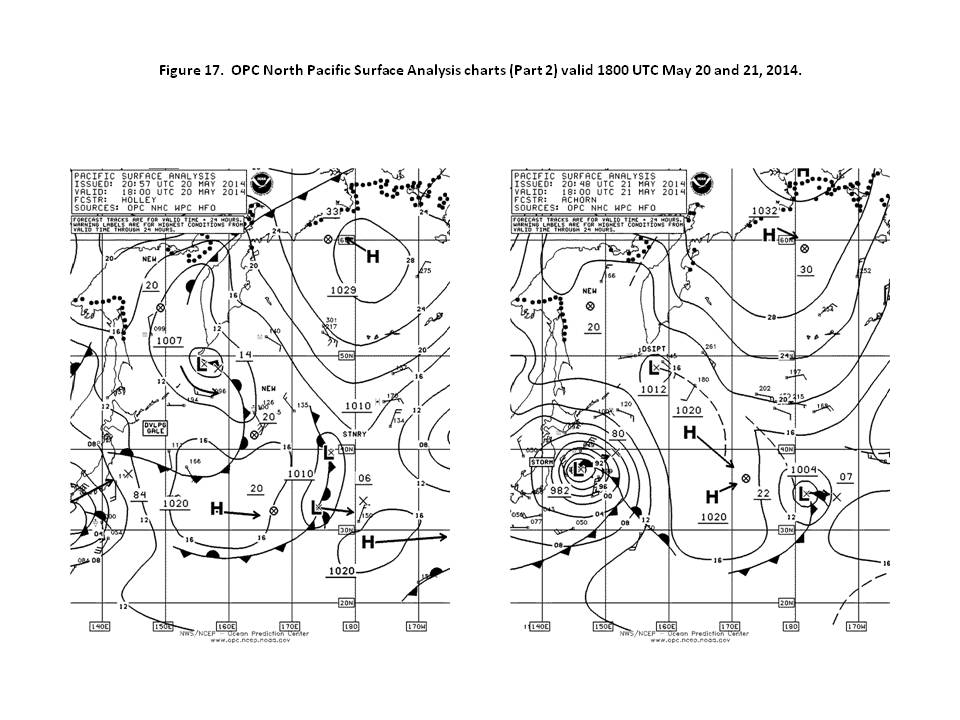
Western North Pacific Storm, May 20-22: Another storm force low formed east of Japan in late May as depicted in Figure 17. It was already well developed while still over Japan. The cyclone developed a lowest central pressure of 980 hPa at 0600 UTC May 22nd. A vessel using the SHIP call sign reported west winds of 57 kt and 8.2 m seas (27 ft) near 36N 148E at 0300 UTC on the 22nd. The ship 7JDE (36N 148E) encountered west winds of 50 kt at 0600 UTC on the 22nd. The cyclone subsequently moved slowly east and then northeast and weakened, approaching the western Aleutian Islands by the 25th with winds below gale force.
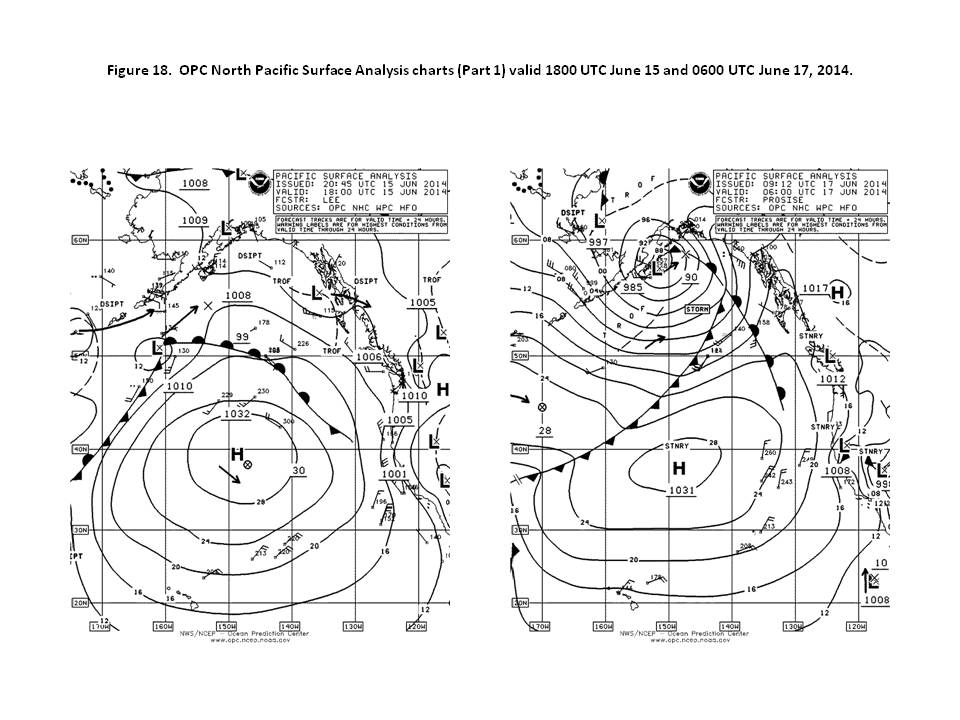
Northeastern Pacific and Gulf of Alaska Storm, June 16-17: The storm force low near Kodiak Island in Figure 18 originated as a new low near 44N 170W at 0000 UTC June 15th and was the stronger of two cyclones that tracked northeast into the Gulf of Alaska in the middle of June. The cyclone developed gale force winds on the evening of the 15th near 52N 159W and briefly storm force conditions 0600 UTC on the 17th (Figure 18) when it developed its lowest central pressure. The ship WDA2760 (60N 148W) reported northeast winds of 50 kt at 0600 UTC on the 17th. The Oosterdam (PBKH) near 59N 143W encountered southeast winds of 45 kt five hours prior. Buoy 46061 (60.2N 146.8W) reported east winds of 40 kt with gusts to 51 kt and 5.2 m seas (17 ft) at 0800 UTC on the 17th. The cyclone then stalled and weakened near the Alaskan coast by 1200 UTC on the 18th when top winds dropped to below gale force.
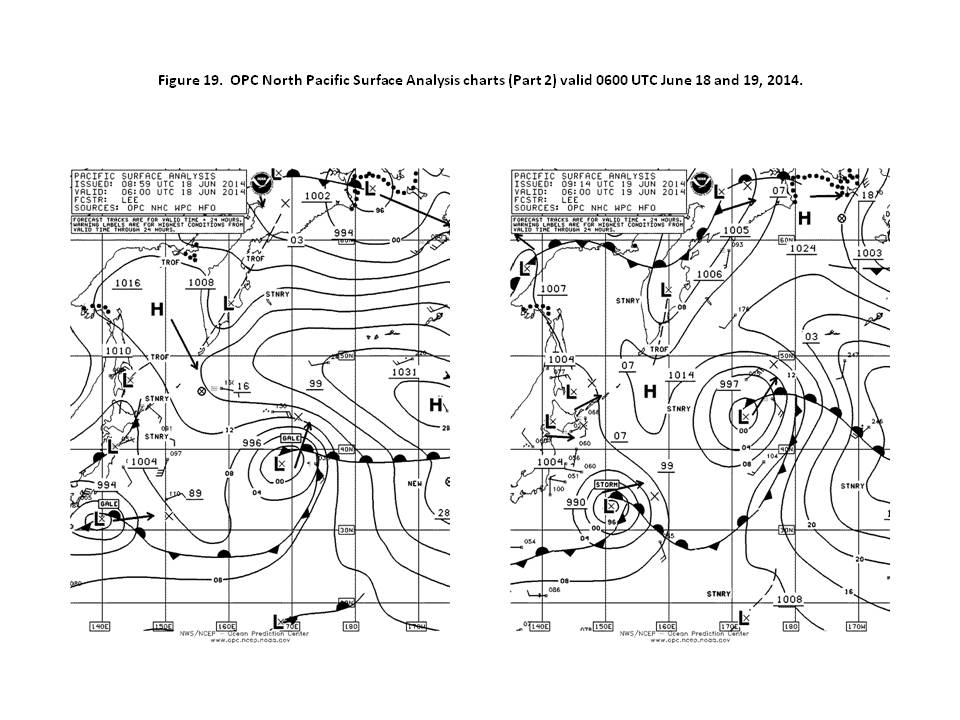
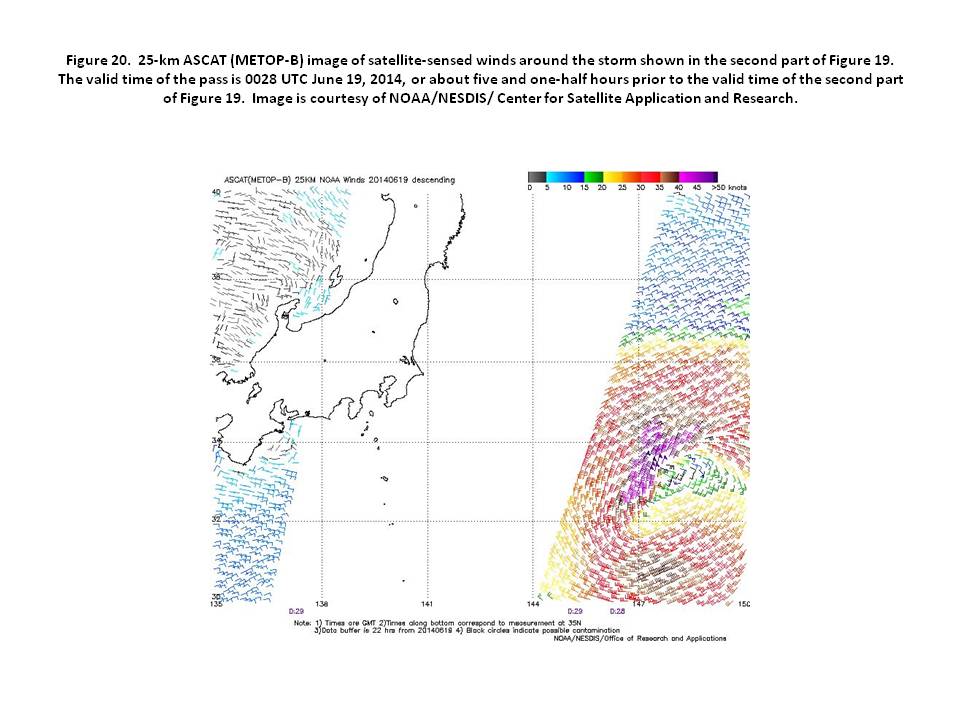
Western North Pacific Storm, June 18-19: A relatively compact cyclone formed southeast of Japan in the middle of June, where it briefly developed storm force winds (Figure 19). It originated southwest of Japan early on the 17th. The compact circulation of this storm appears in the ASCAT image of Figure 20 with the strongest wind retrievals, up to 50 kt, on the northwest side close to the center. The lowest central pressure was 988 hPa when the center was near 33N 148E at 0000 UTC on the 19th. The cyclone subsequently weakened and turned toward the northeast, with its winds diminishing to below gale force as the center passed near 37N 161E at 1800 UTC on the 20th.
Northeastern Pacific Storm, June 18-20: A developing low in the eastern waters developed storm force winds while moving from 45N 142W to 49N 132W over the twenty four hour period ending at 1800 UTC on the 19th, when it briefly developed storm force winds with a compact circulation and a 997 hPa central pressure. The Polar Enterprise (WRTF) reported northwest winds of 50 kt near 48N 133W at 1800 UTC on the 19th. Another ship nearby, Adrian Maersk (OXLD2) near 48N 131W), encountered southwest winds of 45 kt and 6.5 m seas (21 ft) at that time. The cyclone then weakened and moved inland over British Columbia early on the 20th.
Northeastern Pacific Storm, June 21-22: A somewhat stronger eastern Pacific formed later in June, originating as a secondary development on a front associated with an older low to the west, near 48N 150W at 0600 UTC on the 21st. The cyclone moved northeast and developed a lowest central pressure of 992 hPa and storm force winds for a brief period near 53N 137W at 0600 UTC on the 22nd. The Sofia Express (DGZT2) near 51N 134W encountered south winds of 45 kt at 0200 UTC on the 22nd. Another vessel, the Carnival Miracle (H3VS) near 55N 134W, reported southeast winds of 45 kt and 8.5 m seas (28 ft) at that time. The cyclone subsequently moved north and then stalled and weakened in the Gulf of Alaska later on the 22nd and the 23rd.
References
1. Sanders, Frederick and Gyakum, John R., Synoptic-Dynamic Climatology of the Bomb, Monthly Weather Review, October 1980.
2.Ocean Surface Winds, http://manati.star.nesdis.noaa.gov/products.php
3. VonAhn, Joan. and Sienkiewicz, Joe, Hurricane Force Extratropical Cyclones Observed Using QuikSCAT Near Real Time Winds, Mariners Weather Log, Vol. 49, No. 1, April 2005.
4. Saffir-Simpson Scale of Hurricane Intensity: http://www.nhc.noaa.gov/aboutsshws.php
5. Tropical Cyclone Reports, 2014, National Hurricane Center, http://www.nhc.noaa.gov/data/tcr/index.php?season=2014&basin=atl Back to top